Ozone by the Extrathoracic and
Intrathoracic Airways in Man. (Under
the direction o-f Dr. Parker C. Reist)
Extrathoracic and intrathoracic ozone removal were
studied in eighteen healthy, nonsmoking volunteers
using a controlled environmental chamber.
Ozone-containing air was drawn through a polyethylene
sampling tube placed through one nostril into the
posterior pharynx, and analyzed with a rapidly
responding ozone analyzer. Measurements were made
using a randomized split-split plot design -for each
subject at ozone concentrations o-f 0.1 ppm, 0.2 ppm and
0.4 ppm, using three breathing modes (nasal, oronasal
and mouth) , and at two di-f-ferent breathing frequencies
(12 and 24 BPM). For extrathoracic ozone removal,
significant effects were demonstrated for mode of
breathing and breathing frequency (both with p< 0.001),
but not for ambient ozone concentration. Forintrathoracic ozone removal, significant effects were
demonstrated for ambient ozone concentration (p" 0.032)
and for breathing frequency (p<0.001), but not for mode
of breathing. Mechanisms are postulated to explain the
LIST OF ABBREVIATIONS iii INTRODUCTION 1 BACKGROUND 8
Formation and transport of ozone 8 Health e-ffects 16 HYPOTHESES 25 MATERIALS AND METHODS 27
Subject* 27
Exposure technique 28 Measurement of ozone removal 31 Protocol 34 Analysis 41 RESULTS 46
Subjects 46
Ventilatory Parameters 47 Extrathoracic and intrathoracic
ozone removal 52
Post-exposure nasal examinations 57 Post-exposure questionnaire 61
DISCUSSION 64
CONCLUSIONS 76
BIBLIOGRAPHY 78
ADDITIONAL REFERENCES 87 APPENDIX 1
Subjects' Informed Consent Form 90
APPENDIX 2
Flow Sheet for Post-ozone Exposure
Examinations 94
APPENDIX 3
Post-ozone Exposure Symptom Questionnaire 96
APPENDIX 4
Mean Ventilatory Parameters and Mean
Ozone Removal Data for All Subjects 98
FIGURE 2
FIGURE 3
FIGURE 4
FIGURE 5
FIGURE 6
Solenoid Sampling Valvo
Gould Rscordar Channalm
Rampitrac* Calibration
Prvinsartion Tub* Loss
Calculation
Calculation o-f Extrathoracic and Intrathoracic Ozona Ramoval
33 37
38
43
Subjects
TABLE 2A Msan Ventilatory Parameters 12 Breaths Per Minute
TABLE 2B Mean Ventilatory Parameters
24 Breaths Per Minute
TABLE 2C Analysis of Ventilatory Parameters Across Ozone Level, Breathing
Mode, and Breathing Frequency
TABLE 3 Statistical Analysis- Percent
Extrathoracic Removal of Ozone
TABLE 4 Statistical Analysis- Percent Intrathoracic Removal of Ozone
TABLE 5A Post-exposure Nasal Examination Erythema
TABLE 5B Post-exposure Nasal Examination
Edema
TABLE 6 Post-exposure Questionnaire
Summary
48
49
50
51
53
54
58
59
ACKNOWLEDGEMENTS
I would like to express my sincere appreciation to
Dr. Timothy R. Oerrity for his continual support,
encouragement and guidance throughout the course of
this research project. Without his many hours of
manuscript reading and re-reading, sage advice,
pertinent commentary and intimate knowledge not only of
pulmonary physiology but also of the conduct of
research, the quality and completness of this report
would suffer greatly.
I would like to thank Dr. John J. O'Neil and the
staff of the Clinical Research Branch of the U. S.
Environmental Protection Agency for their cooperation
and for allowing me to participate in research in their
facility.
I would also like to thank my wife for her
unflagging support and encouragement during the course
BPM breaths per minute
CBC complete blood count
CORD chronic obstructive pulmonary di(
•fr- respiratory -frequencyFir. inspiratory -flow
FEVi -forced expiratory volume in one second
FVC forced vital capacity
HEPA high e-f-ficiency particulate absolute
Ki rate constant -for nitrogen dioxide
K3 rate constant for nitric oxide
M energy absorbing molecule
MMPI Minnesota Multiphasiic Personality Inventory
NAAQS National Ambient Air Quality Standards
NMOC non-methane organic compounds
NO nitric oxideNOs nitrogen dioxide NOk oxides of nitrogen 0 atomic oxygen
0= oxygen
O3 ozone
PPM parts per million
R«w airway resistance
S.E. standard error
INTRODUCTION
The present study characterizes the removal o-f ozone by the oro-nasal mucosa (extrathoracic airways) of human volunteers, and assesses how much of the ozone passing the extrathoracic airways is removed by the intrathoracic airways. Ozone removal is evaluated as a function of mode of breathing (oral, nasal, and oro-nasal), of ozone concentration, and of breathing
frequency.
Ozone is a highly reactive and unstable gas, which is formed naturally at high altitudes by photochemical dissociation. It is also formed as a result of the action of sunlight on ozone precursors released as pollutants from man-made sources. Schoebein^ observed, soon after the discovery of ozone, that ambient air
colored sensitive ozone reagent paper in the same way
Ozone has been recognized as a major component of urban air pollution for the past forty years. However, knowledge of its toxic properties has been accumulating since its discovery by Schonbein in 1839='^. In the early 1850's^ death was demonstrated in animals as a result of injury to the respiratory tract. It was found that "the breathing of oxygen which contains 1/240 of ozone kills, with high reproducibility, all animals even within a very short time.... The breathing of such a mixture of ozone for only thirty
seconds kills small animals. Some of them died even
after fifteen seconds whereas similar animals lived in
of ths hsartbsat. Similarly ths tsmpsraturs dscrsasss
in ths animals by thrss to fivs dsgrsss Csntigrads.
Aftsr dsath, ths blood is found in its vsnous
condition. Nsithsr ths capillary circulation nor ths
rsflsx activity of ths spinal cord is rsmarkably
affsctsd. Ths sams is trus for ths contractility and
ths working fores of ths musclss."Many rscsnt studiss havs bssn carrisd out sxamining
ths sffscts of ozons on animals as wsll as humans.
Thsy havs mainly addrssssd ths pulmonary sffscts of
ozonSf with a small body of information on ths
SMtrapulmonary sffscts sssn with ozons sxposurs. Whils
many of ths sarly toxicity studiss utilizsd
concsntrations of ozons in sxcsss of 1 ppm, mors rscsnt
studiss havs svaluatsd concsntrations mors rsprsssntativs of rsalistic ambisnt ozons concsntrations.
Sevsral invsstigators havs attsmptsd to quantify
ths doss-rssponss sffsct of ozons on ths lung using a
"critical doss" or "sffsctivs doss" concspt to sstimats
ths amount of an inhalsd bolus of ozons which rsachss
and oropharyngeal removal o-f ozone as a -factor to be
considered in determining dose to the lower airways.
Mathematical models o-f ozone removal by the intrathoracic airways have been developed'*•'*'* •'*''. However, a determination o-f absorbed ozone dose in the lungs requires knowledge o-f the amount of ozone removed by the extrathoracic airways- data which cannot be accurately modeled.
There are a plethora o-f animal data evaluating the upper airway removal o-f various gases including ozone=»''*'^ •=*•'*='•-**•*ͣ•=» •*='''=', but only one study assessing nasal removal o-f a gaseous pollutant in humans, and that was -for sulfur dioxide.^'^ At present there are no studies published which evaluate human extrathoracic or intrathoracic airways removal o-f
ozone, critical -factors in the determination of how
much of an inhaled dose of ozone reaches its site of
action in the lung.
Several investigators have found a wide range of
sensitivity of human pulmonary function response to a
given ozone concentration. *'^^ ***•=* •=**»=*=»»=«''»'*o»*»«'
response -from individual to individual is due to
differences in age, sex, and smoking habits. =^^
However, studies done on populations of non-smoking
males have shown this inter-subJect variability of
response, and have also shown that the variability
exists regardless of age.'- Although there is a wide
range of individual responses to ozone, if the same
person is retested, pulmonary responses to ozone
exposure are consistently reproducible for each
individual for as long as ten months.^"^
One factor which could account for the
inter-subject variability of response is alluded to in
the "effective dose" concept. The reaction of the
pulmonary receptor is not to the concentration of ozone
in the inspired air, but to the amount of ozone
reaching the pulmonary region after transit through the
upper respiratory passages. There are three possible
routes by which air can reach the lung in a normal
individual- through the nose, through the mouth, or
through a combination of both routes. If naso- and
breathing awitchea to oronaaal breathing at a mean
minute ventilation (0=) o-f 35.3 liter a/minute,'*'* with
15,5 litera/minute occurring orally, and 19.8litera/minute occurring naaally. Aa Ok increaaea to 90
litera/minute, oral -flow increaaea to 53.4 litera/minute and naaal flow to 36.6 litera/minute. In the approximately 15'/. of individual a who are mouth breathera (compulaively breathe with their mouth open at reat), the oronaaal airflow diatribution pattern ia aimilar.-*" Thua it can be aeen that even during oronaaal breathing, a aignificant proportion of minute ventilation paaaea through the noae.
The total aurface area of the human noae, approximately 160 cm''**, ia amall compared to the 70 m^' aurface area of the entire reapiratory ayatem.** For normal roating ventilation <400 cc/aec), inapired gaa will have a reaidence time of only 0.05 aeconda, and for increaaed ventilatory ratea, an even ahorter
reaidence time. The noae haa aeveral featurea which
compenaate for thia ahort reaidence time and email
vasculatura which is wall dasigned for tha uptaka of
substancas dissolved in tha nasal mucus.
BACKGROUND
Formation and transport of oione
Ozone is a colorless gas with the chemical formula O3, and a molecular weight of 48. It can remove electrons from, or share electrons with other molecules, and thus is a strong oxidant, having a
standard redox potential of +2.07.*** Stratospheric
ozone reaches the earth's surface in sufficient
quantities to account for a background concentration of 0.05 parts pmr million (ppm).*^ Ozone is formed in ambient tropospheric air when two major classes of precursor pollutants, volatile nonmethane organic compounds (NMOC)'^ and nitrogen oxides, react in the presence of sunlight to form ozone as a secondary pollutant. These two classes of precursors are produced primarily from man-made sources (industrial processes, transportation, and stationary source
combustion).
There are many NMDC's which are precursors to the formation of ozone, including alkenes <the most
a.) Since lany halogenated and oxygenated carbon coipounds play iiportant roles in photocheiical air poliutim processes, and since eethane is essentially unreactive in tite photocheiical processes tihich lead to the foriatiim of ozone, the tere nonNthane organic
involved in the photochemical processes leading to the
formation of ozone are nitric oxide (NO), and nitrogen
dioxide (NOa)- which is itself an oxidant.
The chemical reactions which take place leading to
the formation of atmospheric oxidants are extremely
complex, but three relatively simple reactions canillustrate the relationship between nitric oxide,
nitrogen dioxide, and ozone. First is the photolytic
breakdown of NOa by sunlight} second is the reaction of
the atomic oxygen formed in the photolytic process with
atmospheric oxygen in the presence of an energy
absorbing third molecule (M) to form ozonei third is
the reaction of NO with the ozone formed, leading to
the regeneration of NOa.*° These reactions are
summarized belowi
NOa + photon ---> NO + 0 (I)
0 + Oa + M ---> O3 + M (2)
NO + O3 ---> NOa * Oa <3)
The rate of ozone formation depends upon a rate
constant, k, which is related to the flux of solar
relationship between NO, NOa, and O3 can be expressed
as followsi
CO33 - kiCNOal/ksCNO]
where kt is the rate constant for nitrogen dioKide, and
ks is the rate constant for nitric oxide. This equation is the photostat!onary state expression for ozone.^^ ks is usually SO-100 times greater than k&. From this equation, then, it can be seen that the concentration of ozone is also dependent upon the ratio of CNOal/CNO^. ^'=' Because the ratio of ki/ks is on the
order of 0.01-0.02, most of the NO must be converted to
NO2 before significant amounts of ozone can be formed.
If reactions 1-3 above were the sole atmospheric reactions taking place, the ozone formed would be consumed in the re-formation of NOa. However, volatile nonmethane organic compounds present in the atmosphere react to form free radicals which enter the NO-NOa-Os cycle and consume the nitric oxide formed during the production of ozone. These reactions are as followsi
Thum, am NO im conmumadi aquation 2 procaadm and ozona
accumulatam in tha atmomphara.
Equatlonm 1-5 do not continua indafinitaly.
Dacraaaing molar -flux am tha day programmaa mloMm tha
raactionm, and tarminating raactionm gradually refflov*
NO and NOz -From tha atmomphara. Tha cycla would coma
to a halt i-f -framh oxidam of nitrogan (NOx> amimmionm
wera not continuoumly injactad into tha atmoaphara.
Ambient concentrations o-f ozone depend on the
concentration o-F the precursors at the source,
scavenging during transport, local and synoptic weather
conditions, emissions from multiple source areas along
the path o-f the air mass, and the degree o-f atmospheric
mixing which occurs from the time the pollutant or its
precursors are emitted, to the time they arrive at the
receptor. The amount o-f atmospheric mixing depends, in
turn, on the wind speed and direction, and on the
amount of turbulent mixing which occurs. Since
pollutants do not spread laterally or upward through
stable layers, atmospheric stability then becomes one
of the major determinants of turbulent mixing. The
most stable atmospheric conditions occur with
temperature inversions.
carried great distances. Transport can be urban-scale <20-30 miles downwind from the source), meso-scale (up to 200 miles downwind from the source), or synoptic-scale, associated with high pressure systems with weak winds and limited vertical mixing (may cover hundreds of miles).
It has been shown that ozone trapped above a surface inversion can have a half-life of 46-104
hours'^*, and that air parcels can travel over multiple source areas picking up ozone and its precursors from each source, distributing them over widespread and far—removed areas.^'^ It has also been shown that as much as two-thirds of a peak ozone concentration in one state may have its origin in a metropolitan area of another state.^^ Peak and average concentrations of ozone may be higher in non-urban than in urban areas because of transport of ozone into areas that lack the nitric oxide required to scavenge ozone, and because of the induction and transport times for ozone. In addition, ozone persists longer in non-urban areas because of the absence of chemical scavengers.
An interesting perspective on the urban/non-urban
distribution of ozone can be found in the examination of ozone literature prior to the proliferation of
"ozone is rarely found in the ambient air of big
cities, except in the suburbs if the wind is blowing
from the countryside. It is only very rarely and
exceptionally found in the air of very big and well
ventilated rooms. Indeed it is quickly destroyed in
rooms where a great number of people are living, by
smoke and other conditions of dirt. This destroying
effect was observed by me two to three English miles
away from a factory town even during bright and nice
weather.
"However, ozone is rarely missing during bright
weather in the countryside and is more often found on
hills than in the plains.... It has also been found in
exceptional concentrations after thunderstorms. This
might be explained by the effects of free electricity
on air or its oxygen. ...researchers found higher
ozone concentrations in the spring and summer than in
autumn and winter."
In an interesting comment on scavenging, Andrews
substancas.... If tha amount o-f ozona appaars to ba too
small to cause such graat results, so ona should ba
reminded that ozone is continuously consumed and therefore must be continuously produced."Prior to the early 1970's, ambient concentrations
in excess of 0.6 ppm were not rare, especially in and
around pacific coastal cities of Southern California.'^
Air quality standards for ozone were originally
established by the Environmental Protection Agency in 1978 at 0.08 ppm <1 hour average)*•=, but were revisedin February, 1979 to 0.12 ppm (1 hour average). Since
implementation of this standard, peak and average ambient ozone concentrations have decreased. However,examination of national trend data for 1975-1983
reveals that the composite average of the second
highest value among daily maximum l-hour ozone
concentrations'' at 176 state, local, and national air
monitoring sites remains above 0.12 ppm for every yeari
California station averages are all above 0.15 ppm.
During this same period, ozone monitoring sites
established at pristine sites in several national
forests recorded readings at or above 0.12 ppm on
ͣ
avaral occasions.^^ Ona National Air Pollution
Background Natwork station in tha Mark Twain National
Forast in Missouri, -for axampla, maasurad a ona hourpaak ozona concantration o-f 0.125 ppm during passaga o-f
an air mass, tha trajactory of which was calculatad tohava passad ovar Datroit, Cincinnati, and Louisvilla in
tha hours bafore raaching tha national -forast sita. **»Thus ozona pollution is a problam which has not
baen solvad by promulgation of National Ambiant Air
Quality Standards (NAAQS). It is also a problam which is not solaly restricted to urban and industrializedareas.
Health affects
Functional biological changes have been reported as a result of acute, short term exposure to moderate and
low levels of ozone. The main target of ozone in the
human is the respiratory tract, which can be consideredas comprising three major compartments for purposes of
inhalation toxicology- the nasopharyngeal region, the
tracheobronchial region, and tha pulmonary region. The
nasopharyngeal compartment extends from the externalterminal bronchioles) the pulmonary compartment is
comprised of the -functional gas exchange region
(respiratory bronchioles, alveolar ducts, and
alveoli) .'=*** For the most part, the linings o-f the
nasopharyngeal and tracheobronchial compartments are
similar, and consist o-f ciliated, pseudostratif ied
columnar epithelium and mucous (goblet) cells.
On a molecular level, evidence points to cellular
membranes as the site of ozone toxicity. Since ozone
is a potent oxidant, it has been postulated that
oxidation o-f thiols in tissue proteins and/or oxidation
o-f unsaturated -fatty acids mrm responsible -for the
toxic e-ffects seen.**^ Damage to ciliated cells o-f the
nasopharyngeal and tracheobronchial compartments o-f
animals has been demonstrated at concentrations as low
as 0.2 ppm, and destruction o-f type I pneumocytes with
proliferation of type II pneumocytes in the pulmonary
region has been demonstrated at concentrations as low
as O.S ppm.'*=«
There are a number of extrapulmonary effects which
have been ascribed to ozone exposure. Since ozone is a
very reactive gas, little is absorbed into the
circulation, so it is not believed that these effects
Arm due to direct absorption. Postulated mechanisms
systams producing biochamical or structural changas, or
ralaasa of neurohumoral substances as a result of
interaction of oione with pulmonary neural receptors.*"*
These effects in humans range from alteration in
indexes of vision with short term exposure to 0.2--0.S
ppm^", to increases in red blood cell osmotic fragility
with exposures to 0.5 ppm for 165 minutes'^. Among the
biochemical abnormalities which have been demonstrated
in animal studies are altered hepatic nucleic acid
concentrations, shifts in the content of metals in the
liver, and changes in urinary pH. *"*•'•=*
The major concern in humans exposed to current
ambient levels of ozone<= has been the demonstration of
pulmonary function decrements. Many animal studies
have bean conducted to evaluate the effect of ozone on
pulmonary function. However, many of the animal
pulmonary function tests comparable to those performed
on humans after acute exposures to ozone are very
difficult to interpret. In recent years several
studies have examined human response to ozone
concentrations of less than 1 ppm. Epidemiologic
studies have shown little or no effect on pulmonary
c.} Nith the exception of Dccasional inversion conditions in California, and rare invtriion
conditions in the northeast, peak aibient levels oi ozone are beloM 0.3 ppa and do not
function of resting individuals with ozone concentrations less than 0.15 ppm,='' and controlled
experimental exposures to resting subjects have shown
no effect up to 0.3 ppm. For exposures between 0.3 and i.O ppm, the commonest and most consistent pulmonaryresponses are cough, substernal discomfort with deep
inspiration (sometimes called chest tightness), and
decreased lung volumes. ^°'=^"*'=^*''=^'''=*=*'^^•^^•ͣ*'^•='='• ^=
Several studies have shown that exposures to ozone concentrations of 0.3--0.8 ppm in resting subjects have resulted in significant decrements in forced vital capacity (FVC) and/or forced expiratory volume in one
second (FEVi.o) .'•^'^'''=^'*'^^ •'="=''^^ These decreases are
felt, at this concentration of ozone, to be due to decreases in inspiratory capacity (perhaps secondary to
inspiratory discomfort), and not due to airway
obstructive processes. ==^'=®'== There has been some
small increase in airway resistance (R-w), but most
studies concentrate on the FEVt.o since it represents
both volume and resistance changes.
exercise. Exposure to 0.37 ppm ozone with light
intermittent exercise** (Ok < 24 L/min) for 2 hours
demonstrated significant decrements in FVC and
FEV1.o.***'"*"' With moderate intermittent exercise for 2 hours <Obe 24-43 L/min.) FVC and FEVi.o were decreasedat 0.3 ppm.^*'" With very heavy intermittent exercise
(Oe >63 L/min.) for 2 hours, statistically significant
decrements in FVC and FEVi.o were noted at ozone levels
of 0.18 ppm, and coughing was noted at 0.12 ppm.'^'='
Other investigators have noted an increase in
respiratory frequency (f.^) during exercise accompanied by a decrease in tidal volume (V-r) , (so that minute volume remains unchanged), at ozone concentrations of0.37 ppm- 0.75 ppm-^*** Although exposure times and Oe
are both important factors in this exercise effect,
ozone concentration still remains the dominant factor
in effecting pulmonary function decrements. *•="ͣ •==
Several mechanisms may account for this exercise
effect. During maximal exercise, minute ventilation
can increase ten-fold leading to a greater absolute
exposure to ozone. As mentioned previously, at Ve's
above 35 l/min., an individual shifts from nasal to
oronasal breathing, allowing a large portion of
d.) Interiittent exercise in lost studies is defined as 15 linutes (rf eiercise m a treadeill
inspired air to bypass the putative scrubbing effects
of the nose for ambient pollutants. Decrements in FVC
attributed to decreased inspiratory effort are
speculated to result from sensitization or stimulation
of irritant receptors in the lung resulting in
voluntary or involuntary inhibition of maximal
inspiration secondary to discomfort.** •==*•'***
It has been argued that chamber studies with
exposure to pure ozone mrm unrealistic. Ambient
pollution contains many potentially toxic substances
which may act additively, synergistically, or
antagonistically with ozone. However, controlled
studies have been done utilizing mobile laboratory
facilities and volunteers breathing polluted ambient
air.* The alterations in pulmonary function noted in
these subjects were not statistically different from
controlled chamber studies. Their conclusion was that
there is no evidence of an alteration of ozone effect
in the presence of other pollutants.
An interesting phenomenon is the so-called
development of tolerance to the effects of inspired
ozone with repeated exposure, which has been shown in
animals** as well as in humans. *'='• *•*•=»* With repeated
ozone exposures on successive days, the decrements in
exposures, and this ablation o-f response is usually
accompanied by an absence o-f the cough and chest
tightness normally associated with ozone exposure. On
the average, this blunted response lasts 2 weeks, with
a range o-f 1-3 weeks. ^"^ The mechanism o-f this
phenomenon has yet to be elucidated. This adaptation
e-f-fect is an important consideration when evaluating
the results of studies of ozone exposure done in areas
of frequent high ambient ozone levels.
Since the Clean Air Act specifies that ambient air
quality standards should be written to protect the most
susceptible individuals, much work has been done to
define such groups. Ozone has been shown to cause
hyperreactivity to bronchoconstricting agents in
healthy individuals at concentrations of 0.4 and 0.6
ppm.==*'=^ Because of this it has been speculated that
asthmatics and patients with chronic obstructive
pulmonary disease (COPD> may be more susceptible to the
pulmonary effects of ozone. However, studies comparing
subjects with asthma and COPD to normal subjects at
ozone concentrations up to 0.6 ppm, have shown no
difference in pulmonary reactivity.=«o,3a.s^
Children have also been considered as possibly more
susceptible to the effects of ozone exposure. Studies
no di-f-ference in their reeponeem when compared to
adult* expoeed to eimilar ozone level*.^'
ͣ
•=** The
elderly, too, have been postulated to comprise a
susceptible group, but as yet, no studies have been
done to con-firm this hypothesis.
It appears -from the above series of studies, that
the group most susceptible to the acute effects of
ozone exposure is comprised of healthy, exercising
athletes, not the young or the infirm.
Some studies have described a population of
"hyperresponders" to ozone.^'**'*** As the concentration
of ozone increases, the distribution of pulmonary
function changes widens and becomes skewed toward
larger decrements of pulmonary function. The term
"hyperresponders" is used to describe 5-20X of the
population who ArB at the upper end of this
distribution. There Mrm no criteria which clearly
define this population, and the reasons for their
sensitivity are not known. Also, in spite of the
studies which show no difference in the response of
individuals with pre-existing pulmonary disease to
ozone when compared with normal subjects, they should
still be considered at high risk. In individuals who
impair tha ability of thoaa with pulmonary disaasa to
HYPOTHESES
In the modeling o-f removal of soluble vapors by the
nose, Aharonson et al=* addressed the effect of vapor
concentration on the uptake coefficient of the vapors.
Their modeling showed that as concentration increased,
the uptake coefficient also increased, leading to
removal of a greater proportion of vapor at higher
concentrations. Because of this concentration effect,
it is hypothesized that the amount of ozone removed by
the extrathoracic and intrathoracic airways is
dependent on the ambient concentration of ozone.
The concentration upon which intrathoracic ozone
removal is based is the concentration entering the
trachea after passage through the extrathoracic
airways. Mode of breathing and ambient ozone
concentration, although affecting the amount of ozone
reaching the trachea, should not affect the manner in
which the intrathoracic airways handle the ozone. Thus
it is hypothesized that the amount of ozone removed by
the intrathoracic region is independent of
extrathoracic airway removal, and depends only on the
concentration of ozone presented to the lung.
airway as compared with the oral airway. Due to
anatomical, air flow, and chemical differences, it is
hypothesized that the amount of ozone removed by the
extrathoracic airways varies with the mode of
breathing.
Aharonson et al^, in their modeling of soluble
vapor removal by the nose found that vapor removal
varied with changes in air flow rate. It is
hypothesized that the amount of ozone removed by the
extrathoracic and intrathoracic airways varies with
changing minute ventilation (Oe).
In the present study, ozone removal by the
intra-and extrathoracic airways is evaluated as a function of
ambient ozone concentration, mode of breathing, and
MATERIALS AND METHODS
Subjects
To determine the extra- and intrathoracic removal
of ozone, eighteen healthy, non-smoking male
volunteers, 18-35 years old, were recruited from the
population in and around Chapel Hill, NC. All subjects
underwent a screening procedure which included the
Minnesota Multiphasic Psychological Inventory (MMPI),
complete medical history, physical examination, SMA-20
blood chemistry screen, and complete blood count <CBC)
with differential.
Only individuals with normal screening parameters
were eligible for this protocol. Those who passed the
initial screening procedure, and who desired inclusion
in the present study, were further screened for history
of any nasal or oropharyngeal abnormality or disease,
and for history of tonsillectomy and adenoidectomy.
Reasons for exclusion from participation included a
history of upper respiratory disorder within four weeks
of the study} history of allergic rhinitis) history of
nasal polypsi history of acute or chronic
cardiovascular disease) use of medication for the week
Each candidate then underwent a nasal and
oropharyngeal examination through use of a head mirror,
nasal speculum, and tongue depressors. Abnormalities
warranting exclusion included presence of nasal polyps,
nasal septal perforation, nasal septal deviation
causing greater than 30% occlusion, or presence of
tonsillar tissue sufficient to cause significant
alteration of airflow.
Accepted subjects were informed of the purposes and
procedures of the study, and of the potential risks
from participation. Each subject was then asked to
read and sign a statement of informed consent (see
Appendix i>. The study design and the consent form
were approved by the Committee for the Protection of
the Rights of Human Subjects of the University of North
Carolina School of Medicine. Physical characteristics
of the subjects are summarized in Table 1.
Exposure technique
litars. Th> door to tha sxposura chambar is a 76.2 cm.
X 208.3 cm. Bhsst of 1.3 cm. thick acrylic plastic, with ths door opsning mads smallsr than ths door to allow ssaling by gaskst matsrial. This providss a gas-lsak-proo-f door.
An intake -fan -forces ambient air through two standard -furnace-type dust pre—filters, a charcoal
ͣ
filter containing 90 pounds o-f charcoal, heating and air conditioning coils, and a high efficiency particle absolute <HEPA) filter. Three steam humidifiers then
humidify the air to the desired level of humidity. The conditioned air enters an air supply duct which extends 2.4 meters from the top of the chamber, ozone is added, and the air passes into a 71.1 cm. X 71.1 cm. square X 10.2 cm. high dispersion boK which is contiguous with the ceiling of the chamber (see Fig. 1). The dispersion box and air supply duct are both constructed of acrylic plastic. A perforated aluminum grill in the ceiling of the chamber covers the outlet of the air supply duct and acts as a flow profile flatener.
FLOW PROFILE FLATENER
*
yJ CHARCOAL F
ILTERBLOWER
HEATING & COOLING
DISPERSION
BOX
FIG. 1
OZONE EXPOSURE CHAMBER
CO
to the rear wall o-f the chamber at the -floor line and
an exhaust duct extends along the rear wall and both
side walls at the floor line. The chamber is
maintained at 24.4'='C (76°F> , and 30-557. relative
humidity. The intake and exhaust fans are required to
maintain the air flow, and the atmospheric balance at
-0.2 inches of water relative to atmospheric pressure.
Ozone is generated from bottled oxygen passed
through a silent arc ozonator. Oxygen is subjected to
a 60 Hertz alternating electric field between
electrodes connected to a high voltage transformer, and
this electric field allows the transfer of energy
needed to form a stable O3 molecule. This ozone is fed
into the air supply duct, the dispersion box where it
is mixedi, and then enters the chamber. The chamber
ozone concentration is monitored with a Dasibi Model
1003 AH ultraviolet ozone monitor. The Dasibi monitor
is calibrated against an EPA certified ozone monitor.
Measurement of ozone removal
For instantaneous readings of ozone concentration,
concentration possible.* This analyzer was placed in
the chamber with the subject, and calibrated against
the Dasibi ultraviolet ozone monitor. Connection was
made to the analyzer with a two way electric solenoid
valve which was activated -from the control center
outside the chamber. One port o-f the valve sampled
ambient chamber air to give a continuous readout of
chamber ozone concentration, and the other port was
connected to the nasopharyngeal sampling tube to
measure changing ozone concentrations in the pharynx
(see Fig. 2).
Each subject was exposed to 0.1, 0.2, and 0.4 ppm
ozone while seated, at rest, with both feet on the
floor. At each concentration of ozone, three modes of
breathing were tested. The three modes were nasal
breathing with the mouth closed, oro-nasal breathing
with the mouth open, and mouth breathing with a nose
clip in place. Breathing frequencies of 12 breaths per
minute <BPM) to represent normal resting respiration,
and 24 BPM to simulate hyperventilation sufficient to
double resting Ve, were targeted at each breathing
mode. Total exposure time to each concentration of
ozone was approximately 15 minutes. The order of ozone
ASOPHARYNGEAL PLING TUBE
3 e
TWO-WAY SOLENOID VALVE
CHAMBER AIR
FIG. 2
concentration was randomized. At each concentration,
the order o-f breathing mode was randomized, and -for
each breathing mode, the order o-f breathing frequency
was randomized for each subject so that no two subjects
had the same order of breathing frequency, mode, and
concentration. This is called a split-split plot study
design.
Protocol
On the day of the exposure, each subject's height,
weight, pulse, and blood pressure were obtained, and
they were asked about recent medication use or recent
infectious processes or injuries. If qualified, the
subjects were fitted with a Biotransmitter TT-23 EKO
telemetry system, with electrodes placed in the left
midclavicular line, second intercostal space, and the
right anterior axillary line, fifth or sixth
intercostal space. A Respitrace (TM) inductance
plethysmograph was used to measure tidal volume and
respiratory rate''. The thoracic belt of the Respitrace
i.) The Respitrace plethysiograph consists of tm stretchable fabric belts into Hhich are sewn an insulated iipedance Mire. The belts are placed around the subject's chest andabdoaen. As the subject breathes and expands his abdoien and rib cage, the nire stretches,
and the iapedance in the Hire changes. This signal is then fed through an oscillator into a
calibrator/deiodulator, and then to a strip chart recorder. The atount of change in
ͣ
illivolts Hith each respiratory cycle can then be converted to a voluKtric equivalent, the
sue of the abdoiinal and rib cage output correlating Hith the voluie of air loved Hith eachwas placed around the subject's chest Just below the
axillae, and the abdominal belt was placed Just above
the level of the iliac
crests.°*-Each subject was then seated in the eNposure
chamber, trained in the use of a calibrated spirometer,
and in performance of each breathing mode and
frequency. A Franz electric metronome was used to time
respirations and assure a 12 BPM and 24 BPM rate. An
Ohio 840 Closed Seal spirometer was was calibrated with
a 1 liter calibration syringe before each subject
exposure. The subject breathed into the spirometer for
six breaths at 12 BPM, and 6 breaths at 24 BPM to
calibrate the Respitrace's millivolt output against a
volumetric standard. This calibration procedure for
the Respitrace was repeated with each different
concentration of ozone to correct for any change of
A Gould Brush 260 six channel strip chart recorder was used at the control center to record the -following
(see Fig. 3)i
Channel 1- EKQ telemetry data
Channel 2- the sum o-f Respi trace abdominal and rib cage belt millivolt output
Channel 3- millivolt output o-f Respi trace abdominal belt
Channel 4- millivolt output o-f Respitrace rib
cage belt
Channel 5- spirometer data
Channel 6- continuous ozone concentration
readings from the Monitor Labs ozone
analyzer
The output -From the Respitrace sum channel could then be converted to a volumetric equivalent by comparison to the spirometer channel during the calibration maneuvers (see Fig. 4). The chart recording paper -for each subject was labeled with the subject number« the date, and the time of day.
rt'f&OHOl'wo SVlMR-fs} GHAPHIC CONTROLS CORPORATION BUFFALO. NEW YORK
ISi3^S33EE
^^^mm
I I I I I I I I I...
I I I I I I I I I I I I I I I I I I I I I I =t
^y i^i^i^ii^n
GOULD RECORDER
CHANNELS
FIG. 3
dSPS
fA
i^'^zl^
srftvi Tfftr"; nw5; - '^ te P? "T ij; S" fZ i ifi 5i 7-; Ii!ii^£'£<k!jiJi^^!£ii;t'>i^!ii^/^!i^<k!!a^^L%.'k'ik!fe:ii^..%?tel^s£^7yi?i:fia^^
RESPITRACE CALIBRATION: Channel 2 represents the sum of the abdominal and rib cage respitrace outputs, and channel 5 the spironetric volume displacement. The spirometer is calibrated using a 1 liter calibration syringe. The height of the Respitrace displacement representing expiration (b) is
ccmverted to inspiratory volume (c).
CALCULATION OF RESPIRATORY VOLUMES AND FLOWSs d-e-f
represents one respiratory cycle. The horizontal distance d-e equates to inspiratory time, and e-f to expiratory time. The vertical distance from the beginning of a cycle at d, to its peak at e, is converted to inspiratory volume. The vertical distance from the peak at e, to the bottom at f, is converted to expiratory volume. Flouts can then be calculated from these volumes and their corresponding
times.
FIG. 4
Z^^
I I I I ?=F I I I I I I I I I I -i—I—I—I—I—h
H—I—i—I—I—I—I—I-two fixed horizontal lines. The oscilloscope was
placed in the chamber at eye level in front of the subject. During quiet respiration, the two fined lines were adjusted to correspond to functional residual capacity on the lower line, and tidal inspiration on the upper. The subject was instructed to target the moving line (representing his tidal breathing) to reach the upper line on inspiration, and the lower line on expiration during both a 12 BPM and a 24 BPM breathing
frequency. This allowed an approximate doubling of Oe
when switching from the slow to the fast breathing
frequency.
sample was drawn through the tube to assure patency.
The subject was instructed to re-frain from swallowing
during each sampling interval (6-10 breaths per
interval) to prevent saliva from entering the sampling
tube.
Then, according to the randomized protocol, the
subject was told which breathing mode and frequency to
perform, and the Monitor Labs ozone analyzer was
switched from measuring ambient chamber air to
measuring oropharyngeal air by activating the two-way
solenoid valve. Six to ten breaths were recorded on
the strip chart recorder for each mode and frequency.
The subject was allowed to relax and swallow after each6-10 breath group. Each mode and frequency at that
concentration were similarly performed, for a total of
6 parameters at each concentration. The tube was
removed, and another sample of ambient chamber air
drawn through the tube to again document tube ozone
absorption (post-removal tube loss). After removal of
the tube, a nasal examination was performed and
recorded to document the state of the nasal mucosa (see Appendix 2).
complation oi all thraa ozona axposuras, tha monitoring
aquipmant was ramovad -from tha patiant and ha was askad
to fill out a post-axpoBura symptom quastionnaira
(Appandix 3). Tha quastionnaira was dasignad to alicit
symptoms common to ozone exposure <cough, chest
tightness, pain on inspiration, shortness of breath,
nasal irritation), resulting from the presence of the
nasopharyngeal sampling tube (sore throat, nasal
congestion), or caused by hyperventilation <dizziness).
Questions regarding headache, dizziness before rapid
breathing, and eye irritation were included as sham
questions. Subjects were asked to classify their
symptoms as none, slight, moderate, or severe.
At the completion of the protocol, each subject had
a post exposure evaluation consisting of a brief
symptom history, and pulse and blood pressure
determinations.
Analysis
Data from the strip chart recorder was analyzed on
a VAX li/780 , with a program written expressly for
this purpose by Timothy R, Oerrity, PhD using FORTRAN
Inspiratory and expiratory times -for each subject
were determined -from the Respi trace sum channel
(channel 2), and these times were used to calculate
mean inspiratory and expiratory times, and breathing
ͣ
frequency. These ventilatory times and the ventilatory
volumes obtained from the Respitrace plot (see Fig. 4)
were then used to calculate minute ventilation, average
inspiratory flow (Fio> and average expiratory flow.
The data from 6 breaths at each combination of
concentration, mode and frequency were then used to
calculate mean inspiratory and expiratory volumes and
flows.
T
3
n
1
1 ^
134 J.v.
—iT~r 7it—^
^
~7f=i e:^=4^—1—lrllMMH#f
^4d
^uiitiBiiiHIriiir1
isii^L ^^ͣ^ L; ==
«
<
^ RvE
—
===
^
—1—1—\—1—1—1—1—h^—1—1—\—
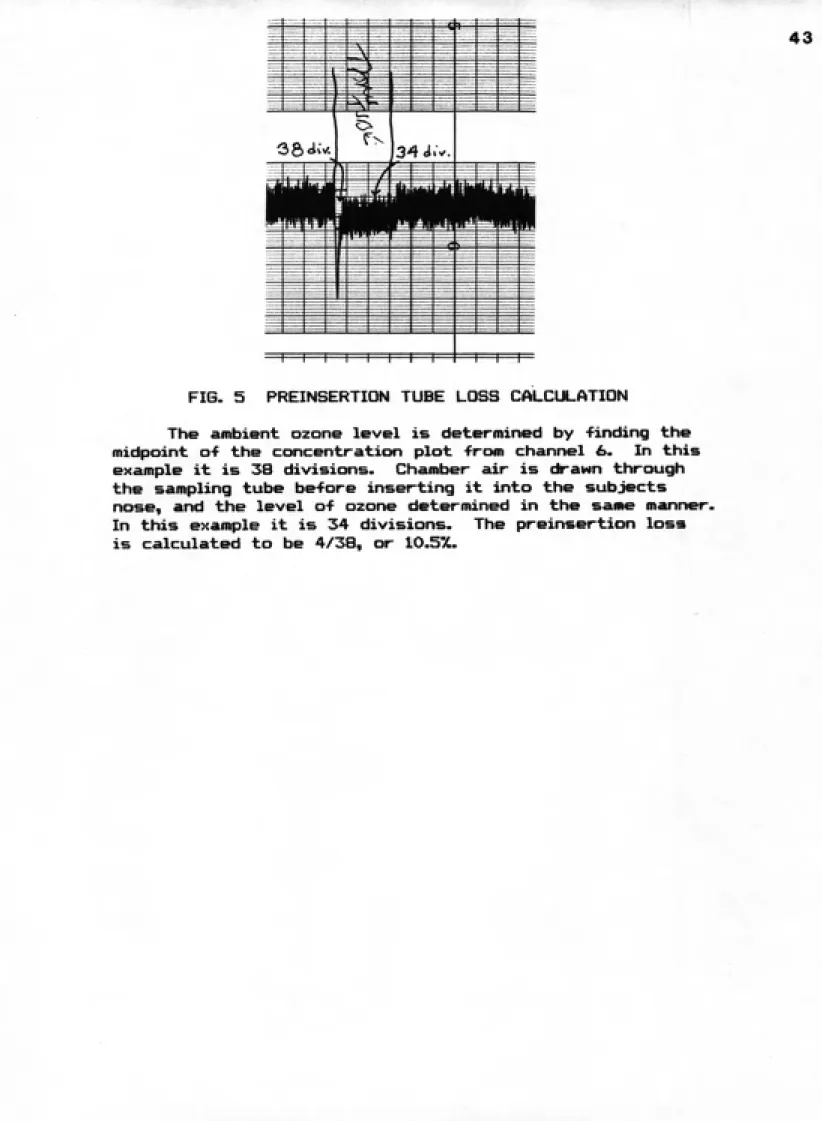
FIG. 5 PREINSERTION TUBE LOSS CALCULATION
The ambient ozone level is determined by finding the
midpoint of the concentratifjn plot from channel £>. In this
example it is 38 divisions. Chamber air is drawn through
the sampling tube before inserting it into the subjects
nose, and the level of ozone determined in the same manner.
In this example it is 34 divisions. The preinsertion loss
1 0 SECS
g Q<^'.*. Z.Odx-i
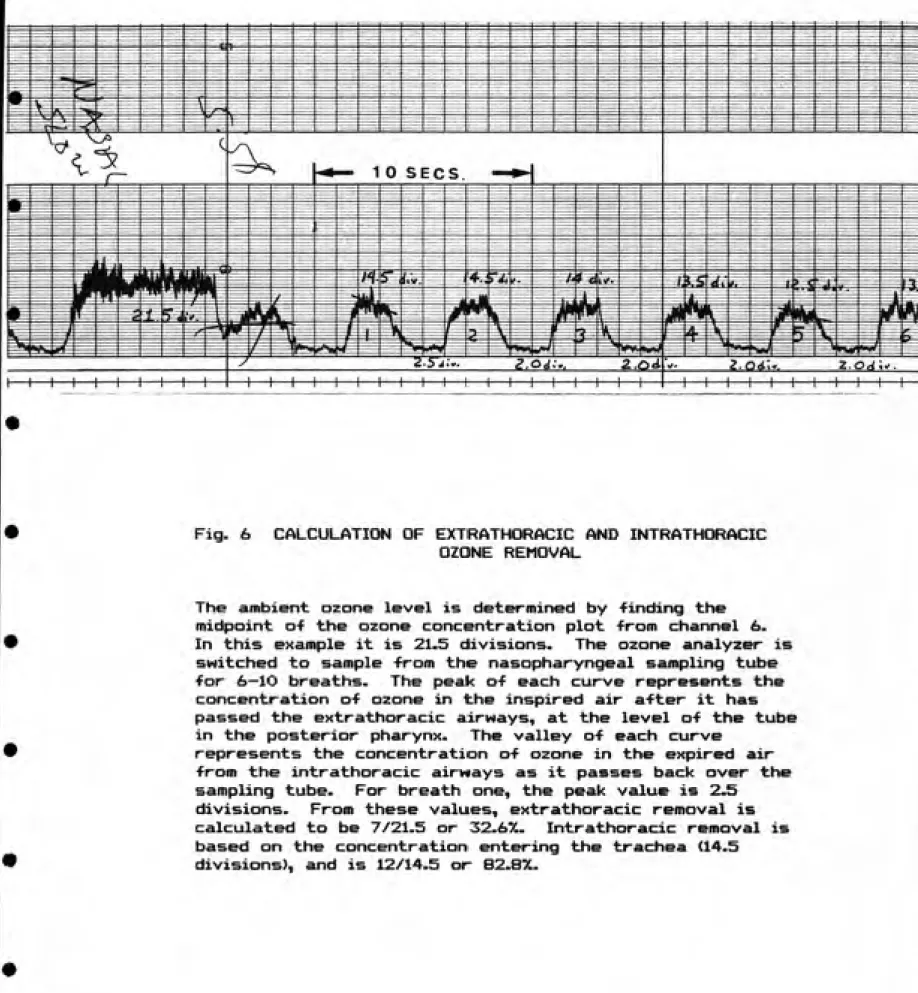
Fig. 6 CALCULATION OF EXTRATHORACIC AND INTRATHCfftACIC
OZONE REMOVAL
The ambient ozone level is determined by finding the
midpoint o-f the ozone concentration plot -from channel 6.
In this example it is 21.5 divisions. The ozone analyzer is
switched to sample -from the nasopharyngeal sampling tube
for 6—lO breaths. The peak of each curve represents the
concentration of ozone in the inspired air after it has
passed the extrathoracic airways, at the level of the tube
in the posterior pharynx. The valley of each curve
represents the concentration of ozone in the expired air
from the intrathoracic airways as it passes back over the
sampling tube. For breath one, the peak value is 2.5
divisions. From these values, extrathoracic removal is
calculated to be 7/21.5 or 32.6%. Intrathoracic removal is
based on the concentration entering the trachea (14.5
actually praaantad to tha trachaa. Data from six
braaths at aach combination of concantration, moda, and
fraquancy was usad to datarmina maan axtrathoracic and
intrathoracic airway ozona ramoval.
Statistical analysis was parformad using a four-way
analysis of varianca with subjact, ozona concantration,
moda of braathing, and braathing fraquancy as fixad
affects. Means were compared using the Nawman-Kuals
multiple comparison procedure^''. This procedure was developed to tell where, among a group of three or more means, significant differences exist. Critical p value
RESULTS
Subjects
None o-f the potential subjects was rejected because of abnormalities detected in the oro-nasal history and
examination. One subject was noted to have an absent
uvula, but this was not felt to be disqualifying for participation in our study. All subjects had either absent, atrophic or very small tonsils. Two subjects <011 and 030) had minimally deviated nasal septae. One
subject (002) who had a normal initial nasal
examination was noted to have a 1 mm area of erythema and denuded epithelium on his right middle turbinate. He related having done dusty yard work 2 days prior to the date of the study, but had no congestive symptoms. He was not excluded from the study because of the small size and asymptomatic nature of his lesion.
One subject (010) reported for the study with an
active conjunctival infection and was not studied.
Inability to pass the nasopharyngeal tube resulted in
dismissal of two subjects <004 and 009). One subject
nasopharyngeal tube for placement in one subject (021), and he was dismissed. Table 1 is a summary o-f the physical characteristics of the subjects.
Ventilatory parameters
Measured breathing frequencies at the 12 BPM target ranged from 11.86 to 13.20, and at the 24 BPli target
from 22.72 to 24.47 (see Tables 2A and 2B>. Tidal
volume ranged from 0.54 liters to 1.29 liters at the slower frequency, and 0.49 to 1.18 liters at the more rapid frequency. Inspiratory flow at the 12 BPM target ranged from .23 to 0.53 liters/ sec, and at 24 BPM from 0.40 to 1.01 liters/sec. At 12 BPM, minute ventilation varied from a low of 6.70 liters/min. to a high of 15.6 liters/min., while at 24 BPM it was as low as 11.16 and as high as 29.96 liters/min.
Analysis of mean ventilatory parameters (Table 2C) revealed an overall mean breathing frequency of 12.24
at the 12 BPM target frequency, and 23.78 at the 24 BPM target frequency. Mean inspiratory flow at 24 BPM was almost twice that at 12 BPM (0.64 liters/sec. vs 0.35 liters/sec.) as was mean minute ventilation (16.50 liters/min. vs 10.17 liters/min.). Mean tidal volume showed little change with changing breathing frequency
^
.^
.cS*i
/
001 188.0 78.2
29/7
002 172.0 66.8
21/8
003 175.5 71.0
20 / 11
006 182.5 64.8
35/2
Oil 182.5 90.1
24/9
016 175.5 74.0
30/5
017 179.0 74.5
34 / 11
018 183.0 70.0
35 / 11
019 173.0 70.0
31/9
023 168.7 78.3
21 / 11
024 190.0 73.0
35/6
027 158.2 73.5
22/4
029 172.3 69.9
31 / 1
030 169.0 66.6
35/6
031 173.6 72.9
23/5
032 176.7 77.6
27 / 2 ;
033 191.0 103.0
27/8
034 173.8 67.4
25/4
MEAN 176.9 74.528/8
S.D. 8.3 9.2
5/5
TABLE 1
001 002 003 006 Oil 016 017 018 019 023 024 027 029 030 031 032 033 034 <y/ Co
$4
#
^^
>vy4?
< ^^
#
.V Cv.^^
#0-^9
il.96(.04)
0.75 (.04)
0.32(.02)
8.91 (.53)
8
11.98(.05)
0.67(.03)0.26(.01)
7.99 (. 35)
9
12.08 (.05)
0.55(.01)
0.23(.01)
6.70 (.56)
9 12.21 (.20) 1.12(.13) 0.48 (.05) 13.66(1.49)9
12.39 (.20)
0.75 (.06)
0.31(.02)9.34(.71)
9
12.10 (.08)
0.60 (.06)
0.26(.02)
7.27 (.66)
9
12.33 (.20)
0.67(.01) 0.32(.01)8.29 (.16)
9
12.16(.07)
0.54(.01)
0.25(.01)
6.53 (.17)
9
11.86(.05)
0.73 (.06)
0.31 (.02)8.66 (.68)
9
13.20 (.46)
0.70 (.05)
0.30 (.03)
8.77 (.79)
911.97 (.03)
0.87 (.02)
0.37(.01)10.44(.21)
9
12.66 (.55)
0.88 (.04) 0.38(.02)11.07(.36)
9
12.36 (.09)
0.71 (.03)
0.30 (.02)8.73(.46)
912.12(.07)
0.a8(.01)
0.33(.01)
10.59(.17)
912.08 (.03)
1.29 (.09)
0.53(.04)15.6(1.03)
912.46(.18)
0.80 (.03)
0.33(.01)
9.90 (.36)
912.04(.04)
1.28 (.09)
0.50 (.03)15.37(1.06)
912.41 (.23)
1.21(.05)
0.53(.03)
15.00 (.75)
NUMBERS IN PARENTHESES ARE STANDARD ERROR (S.E.)
TABLE 2A
MEAN VENTILATORY PARAMETERS
001 002 003 006 Oil 016 017 018 019 023 024 027 029 030 031 032 033 034
<zr
.-^
^
#
#
9
23.51 (.23)
0.72 (.04)0.64 (.04)
16.84 (.98) 923.96 (.06)
0.62 (.03)
0.49(.02)
14.88 (.63)
923.90 (.09)
0.47(.01)0.40(.01)
11.16 (.16) 9 23.89 (.08) 1.02(.12)0.89(.10)
25.48(2.91)
922.72 (.52)
0.82 (.09)
0.63(.05)
18.38(1.59)
9
23.63 (.16)
0.49(.05)
0.40 (.04)
11.64(1.10)
9
23.84 (.12)
0.61 (.02)
0.49(.01)
14.59 (.40)
9 23.39 (.12)0.51 (.02)
0.41 (.02)
12.06 (.46)
923.88 (.12)
0.68(.05)
0.57 (.04)
16.11(1.33)
924.47 (.21)
0.70 (.04)
0.56 (.03)
17.10(1.07)
923.87 (.10)
0.85(.03)
0.73 (.02)
20.23 (.67)
9 23.79 (.20) 0.89(.03)0.73 (.02)
21.14(.48)
9 23.92 (.17)0.50(.03)
0.41 (.02)
11.86 (.75)
9 23.83 (.10)0.85(.03)
0.62(.03)
20.31 (.70) 9 24.19 (.17)1.15(.10)
0.94(.08)
27.91(2.42)
923.58 (.58)
0.80 (.06)
0.66 (.04)
18.64(1.19)
924.18 (.08)
1.12(.ll)
0.88(.09)
26.81(2.59)
923.61 (.35)
1.18(.09)
l.OK.OS)
27.96(2.27)
NUMBERS IN PARENTHESES ARE STANDARD ERROR (S.E.)
TABLE 2B
MEAN VENTILATORY PARAMETERS
0
i/
c- ^
#<5
(ST/
ͣ «? ^#
0.1 PPM 0.2 PPM 0.4 PPM 108 107 10817.92 (.09)
18.09 (.09)18.08 (.09)
0.80 (.04) 0.85 (.04) 0.77 (.04) 0.48 (.02) 0.52 (.02)0.48 (.02)
14.16 (.62) 15.15 (.63) 13.75 (.62)^
^
J'
Co C
-5" Jo'
S> ORONASAL NASAL MOUTH 107 108 108
18.05 (.06)
18.01 (.06)18.04 (.06)
0.83(.01)
0.75(.01)
0.83(.01)
0.51(.01)
0.46(.01)
O.SK.Ol)
14.88 (.25)
13.26 (.25)
14.92 (.25)
I
,1
^
<§^
I'
^#
c::3 ott_ OJ
•5-12 BPM
24 BPM
161112.24 (.05)
162123.78 (.05)
0.83(.01) I0.35(.01)
0.78(.01) l0.64(.01)
10.17 (.23)
18.50 (.23)
FIGURES IN PARENTHESES ARE STANDARD ERROR (S.E.)
TABLE 2C
ANALYSIS OF VENTILATORY PARAMETERS
ACROSS OZONE LEVEL. BREATHING MODE.
Extrathoracic and intrathoracic ozone removal
The targeted ozone concentrations upon which removal was based were 0.1 ppm, 0.2 ppm and 0.4 ppm. Analysis of the data revealed actual mean ozone concentrations of 0.100 0.001 ppm (S.E.), 0.203 +/-0.001 ppm <S.E.) and 0.410 +/- O.OOl ppm C8.E.>.
Statistical analysis was performed on the results of the mean percent ozone removal by the extrathoracic and intrathoracic airways to determine if there were significant differences in removal based on target respiratory frequency, ambient ozone concentration, or mode of breathing. Tables 3 and 4 summarize the results of the statistical analyses for extrathoracic removal and intrathoracic removal, respectively.
Tables 3A, 3B, and 3C give the means and standard errors for the percent ozone removal by the
extrathoracic airway at each ozone concentration, for
each mode of breathing, and for each target breathing
frequency. Four-way analysis of variance was performed
with subject, ozone concentration, mode of breathing
and target breathing frequency as main effects. Table
3D summarizes this analysis of variance. Target
breathing frequency and mode of breathing are both
0 1 PPM 108 45.8 1 75
0 2 PPM 107 43.3 1 75
0 4 PPM 108 43.1 1 75
6
/
^'ORO-NASAL 107 47 5 1. 14 NASAL 108 39 8 1 13
MOUTH 108 44 9 1 13
#
^
SUBJECTS
OZONE LEVEL (OL)
ERROR A
MODE OF BREATHING (MOB)
OL X MOB
B ERROR B
BREATHING FREQ (BF)
OL X BF MOB X BF
OL X MOB X BF
ERROR C TOTAL<5^
/
kj' Co 12 BPM 24 BPM 161 162 45.4 42.7 0.49 0.49^^
17 2 34 2 4 102 1 2 2 4 152 322/
#
/
893.9 2.71 236.9 0.72 328.9 1648.2 11.85 53.5 0.38 139.1 572,9 14.73 45.3 1.16 18.5 0.48 11,9 0.31 38.9 <.006 0.494 <.001 0.822 <.001 0.316 0.620 0.871D
TABLE 3
STATISTICAL ANALYSIS-PERCENT EXTRATHORACIC
REMOVAL OF OZONE
/
0 1 PPM 108 89 4 0 80 0 2 PPM 107 91 0 0 80
0 4 PPM 108 92 5 0 80
s> -^
.^
<3-<^
/
•^#
:^ <c/'
Co'
ORO-NASAL 107 91 0 0 41
NASAL 108 90 8 0 40
MOUTH 108 91 2 0 40
B
/^
#
SUBJECTS
OZONE LEVEL (OL)
ERROR A
MODE OF BREATHING (MOB)
OL X MOB
ERROR BBREATHING FREQ. (BF)
OL X BF MOB X BF
OL X MOB X BF
ERROR C TOTAL
/
Coio'12 BPM 161 92 6 0 17 24 BPM 162 89 3 0 17
^
<^^
#^ << <^
17 1266.3 18.51 <.001
2 261.5 3.82 0.032 34 68.4
2 4.3 0.24 0.787 4 13.5 0.76 0.554
102 17.7
1 838.3 182.2 <.001
2 3.4 0.74 0.479 2 6.5 1.41 0.247 4 4.1 0.89 0.472
152 4.6
322
D
TABLE 4
STATISTICAL ANALYSIS-PERCENT INTRATHORACIC
REMOVAL OF OZONE
Significantly more ozone was removed by the extrathoracic airwaye at a target breathing frequency of 12 BPM than at 24 BPH. Mode of breathing was also found to have a significant effect <p < 0.001) on extrathoracic ozone removal. Using the Newman-Kuels multiple comparison procedure, it was determined that the means for removal of ozone by oro-nasal and mouth breathing were not statistically different. Both, however, were significantly higher than the mean removal by nasal breathing (p < 0.01).
ͣ
'
There was more ozone removed by the extrathoracic airways at an ozone level of 0.1 ppm than at 0.2 ppm and 0.4 ppm, but the difference was not statistically significant <p » 0.494).
Interactions among the three factors of ozone concentration, mode of breathing and target breathing
frequency were not statistically significant.
Therefore, for extrathoracic removal of ozone, target
breathing frequency, mode of breathing and ozone level were all independent effects, and the results for themain effects mrm valid.
braathing mod* and aach targat braathing fraquancy.
Four-way analysis o-f varianca wa> par-formad as with tha
aHtrathoracic ramoval, and Tabla 4D aummarizas thaanalysis o-f variance -for tha maans o-f intrathoracic
ramoval of ozona. Ozona lavel and targat breathing
frequency were both statistically significant effects
(p o 0.032 and p < 0.001 respectively).There was significantly more pulmonary ozone
ramoval at 12 BPM than at 24 BPM (p< 0.001). There wasmore ozone removal at 0.4 ppm than at 0.2 ppm or 0.1
ppm, and more removal at 0.2 ppm than at 0.1 ppm. But by the Newman-Kuels multiple comparison procedure, there was significance only between 0.4 ppm and 0.1ppm.
There were no significant differences in
intrathoracic ozone removal noted when comparing modes
of breathing.
Evaluation of interactions among the three
parameters was performed. None of the interactions
were statistically significant. Therefore, for
pulmonary removal of ozone, target breathing frequency,
mode of breathing and ozone level are also all
independent, and the results for the main effects are
As demonstrated by the summary tables (Tables 3D
and 4D), the subject effect was significant.
Therefore, extra- and intrathoracic ozone removal are
not reproducible between individuals.Post-exposure nasal examinations
Post-exposure nasal examinations (Tables 5A and SB)
were performed on all but one subject (001). Twelve of
the subjects had nasal examinations after exposure to
each of the three ozone concentrations. One subject
had nasal examinations after the first and last
exposures, one had an examination after the second and
third exposures, one had an examination only after the
second exposure, and two had examinations only after
the last exposure.
Response of the nasal mucosa was more marked in the
nostril through which the nasopharyngeal tube was
placed, but in no case was there more than moderate
erythema or edema in either nostril.* With the
exception of one subject (024), the nasopharyngeal tube
was placed in the same nostril for all three
concentrations. This allowed the other nostril to
"^<^.
%
^
oi?"^^^^^
I
I
<5iOJ -^ -<T ͣ«H oj ru «^ ͣq- CM ai oj CM -^ -^ -^ -^ CM "^
ͣ
• • •
ͣ
^ CM T^rvj -^ ͣ^ojoj-^'<^'T-^oJOJ';r'=-i'^->-i -«}• ••H OJ ^ -T 'cH T ͣ^H •^ TT ^H 't '^ ͣ'H CM CM-^ CM
• ͣ • •
E E E E E
fO rci to to to
c
X
(UO + io X
03 +
O O ^ +0 + o s+ + +
o o O o o c c c c ce E E E E
(0 to to to to
^
X
03o o So X
03
O O O ^ OO o o
^ooo
O o O o oc c c c c
£ E K fO X 0} X 03 + +
+ + O + 0++ ++00 + 0+ +
o O c c E E ro (tl ^ X CD X
030 + 0000 + + o+oo + o + o
O O
C c
F
m+ +
e E + E + X+ o o + 0 + (D to m 03
oc X (U o X 03 O c
* X *
03
o c
O c
* 0*0 o* + o * * * +
E E E
m (t) ro
X X X E o o o + o o 03 03 03 tn +
^ O c O c c O o c X 03 O c
o* o* *o * * + o + *
^ ocMrncDt-tuDr^cDoim-^r^cDo-^cMm"^ooo-t-i-s-i^-^TrHCMCMCMCMmromcDm
ooooooooooooooooo O f—I 03 C 03 > 03
to tn
II a3 + .iM + CO 03 5 to _Q c O E 03
I %
03
, -° "O
-'-' x:
"q-•-; +j CM
II S.
+ 03 .,-,
-O jQ
03 -iH 3 C £0 CO
•%
'Osr
""^^
•^0^^^
%
I
I
OJ-T ^ ͣ«-l OJCU•^Hͣ^ c\j oj cu rvj -cH-T ͣ«^ ͣ^ (^J -^
ͣ
^" of •
4-r
•
t\J4h ͣ^" cSj 6j 4h ͣ^" '^" ͣ^* t\j" tM TT ͣin i-T 4h
ͣ
^" ͣi-T ru ͣ¥ V
ͣ
• •
ͣ
i-1
• •
4h" 4t ͣ^* 4h 4r 4r ͣ«H cJ dJ -¥ͣ cJ
e E e E E
(0 to to to to X X X X X
a 03 o + tu o 03 + OO03 O O + O 03 o +
+
O o O o o c cr c cz c
e E E E E
ro to to to to
X X X X + X +
^ cu oo 03 o 03 O O O 0) o o + + 03oo + o O O o ͣo
c c c c c=
£ E
to ro X X
+
oc 03 (U + + + 0 + o +
+00+0+0+ o o o c c E e to (O X X +
-1 03 03o + OO
o o + O OO + + + o +o
O O
c c
E
to
E £ E X + +
+
(0 to + to o 03 + o o +
o +
oc X X X
+ 03 03
5tC 03 * *o*oo*+o* * * o 1
O O O c c c *
e s E
ro CO to ,
J X 0} n X cu nO X 03 Oo E to X
O OO + 0*0**0* o * + + + o + + *
cz c c
o
* :: * c
HooJmiD'=-icDr^aDO)m'^rv,oio^ojrtT>q-ooo-cH'^'TH-^-cHCAjojojojmnmrom ooooooooooooooooo 03 C 03 > 03 tn II 03 -M to c_ 03 ͣ a o O <t CO 03 n CD x: +j o 03 +3 II + 03 + J3 -a
=3 to
+3 A-> XZ
JZ
cnx: ^
•rt +J rvi
,—I -iH o
en 2
II
+ 03 -r-^ 03 •ͣ-• :3 c tn tn
o
c * *
II o <C X LJJ
GD _j
lO < <
UJ '^ ^
"i <C LU
m ^ Q
serve as a control for the effects of ozone independent of the effects of the tube.
Nasal examination revealed slight mucosal edema in four subjects, moderate edema in six, and minimal or no
edema in seven. One subject was not examined after
exposure. One subject (IB) exhibited no change in the nasal mucosa on either side at the completion of all three exposure concentrations . Four subjects exhibited no change in the nasal mucosa on either side until after the last exposure (in three, the last exposure was to 0.2 ppm, and in one, the last exposure was to 0.4 ppm). Four subjects showed no change on either side until after the second exposure. Three subjects were examined only after the last exposure.