THE UNIVERSITY OF NORTH CAROLINA AT CHAPEL HILL
Fueling China’s Rise
Analyzing the Determinants of Chinese Foreign Energy Investments
Senior Honors Thesis Will Stelpflug April 18, 2016
Department of Economics
The University of North Carolina at Chapel Hill Thesis Advisor: Professor Patrick Conway
Faculty Advisor: Professor Klara Peter
Approved:
1
2
Abstract
3
Table of Contents
Abstract 2
Acknowledgements 5
1. Introduction 6
2. Background of China’s Foreign Energy Investments 8
2.1Background of China’s Energy Security 8
2.2Chinese Investors in Foreign Energy 13
2.2.1 National Oil Companies 13
2.2.2 Policy Banks 15
2.2.3 Sovereign Wealth Funds 16
3. Literature Review 16
3.1 Theoretical Literature 16
3.2 Empirical Literature 18
4. Theoretical Model 21
4.1Theoretical Framework 21
4.2 Theoretical Model 23
5. Empirical Model 28
5.1 Hypotheses 28
5.2 Empirical Model 32
5.2.1 Tobit Model with Random Effects 33
5.2.2 Heckman Selection Model 35
5.2.3 Simultaneous Equations 37
6. Data Sources 39
6.1 Dependent Variables 39
6.2 Explanatory Variables 40
7. Summary Statistics 43
7.1 Dependent Variables 43
7.2 Explanatory Variables 47
8. Results 48
8.1Tobit Model with Random Effects Results 48
4
8.3Simultaneous Equations Results 57
9. Conclusion and Implications 61
10.Works Cited 66
11.Appendix 70
5
Acknowledgements
Chinese foreign energy investment was an appealing topic to me in part because it was a topic on which much had been written and speculated, but few answers backed by economic research had been given. Soon after delving into this project, I began to understand the
challenges inherent in the topic that made this the case. I have only been able to surmount these challenges and offer some answers thanks to a tremendous degree of help from my advisors and inspiration from my classmates. The guidance of my faculty advisor Dr. Klara Peter was
immensely helpful as I narrowed my focus to this topic, and highly insightful as to the challenges I would face ahead and how I could begin to address them. My thesis advisor Dr. Patrick
6 1. Introduction
“We should think about what China really needs. I’ve considered this. Natural gas and oil are
the resources that China currently has the most pressing need for.”
—Chen Yuan, Governor of China Development Bank, 2009 (quoted in Mocker, 2014, pg. 23).
Over the last fifteen years, the People’s Republic of China, through its state-run energy firms, banks, and sovereign wealth funds, has engaged in an extraordinary level of foreign investment in the energy sector. From Brunei to Ecuador, Chinese institutions have committed billions of dollars to investments in mergers and acquisitions and portfolio investments targeted at foreign energy firms and loans to foreign governments and firms backed by the delivery of energy resources.1 China’s growing presence in the global energy sector has raised questions as to whether its investors’ motives are purely commercial or also align with the state’s goals of enhancing energy security and China’s global economic and political presence. I identify the major motives of China’s foreign energy investors through empirically investigating the major determinants of their reported investments.
China’s spectacular economic growth since the country’s “Reform and Opening Up” (改
革开放) beginning in 1978 has led the country to experience mounting energy insecurity, as its
growing domestic demand for oil and natural gas vastly outpaces domestic supplies. In 2009, China surpassed the United States as the world’s largest consumer of energy (Dannreuther, 2011) and in 2013, it also claimed the title of the world’s largest importer of oil (EIA, 2015). In
addition to developing new sources of domestic energy production, China’s leadership has turned to international markets to obtain new energy supplies for China. At its first meeting in
1 I include loans in my definition of “investment” for the sake of consistency with Mocker (2014), the piece of
7
2010, China’s National Energy Commission declared “securing energy supply through
international co-operation” to be one of its six major areas of focus (Jiang & Sinton, 2011, pg. 12). These efforts have come within the context of a larger Chinese shift towards global
economic expansion and investment, emphasized in the “Going Out” (走去出) policy announced
in 1999 (Buckley et al, 2007, pg. 3). This policy encouraged Chinese enterprises not merely to increase international trade, but specifically to increase investment abroad and seek new revenue sources from foreign markets.
As a result, Chinese investments have taken on a major role in the global energy sector, especially in oil and natural gas. These investments have been made in the form of both equity investments (Mergers & Acquisitions and portfolio investments) and loans. They have been extended by three main categories of state-owned investor firms: China’s national oil companies (NOCs), policy banks, and sovereign wealth funds (SWFs). The motives of these energy
investments are fiercely debated. Foremost is the question of whether these investments primarily follow the commercial interests of the investor firms, or whether they are the work of “China, Inc.: China’s government, state-owned banks, and NOCs operating as a coherent entity in a global pursuit of energy” (Downs, 2011, pg. 3).
8
much to invest in each separately, and a 2SLS simultaneous equations model to investigate the relationship between energy investment and Chinese OFDI.
I expand on prior literature through both my specific focus on Chinese foreign energy investments and my consideration of a full range of major theoretical motives for foreign
investment in its hypotheses. Whereas previous studies focusing specifically on Chinese energy investments examined the effect of risk factors that might deter investment, such as sovereign credit ratings and institutional quality, I look back to the theoretical literature on foreign investment to identify what factors encourage investment in the first place. Accordingly, my main emphasis is on the motives of investors in seeking foreign energy investment, whether those motives are commercial or otherwise.
The structure of the paper is as follows. First, I provide some background on the recent historical development of China’s foreign energy investments, and on the different types of investors. I then review theoretical and empirical literature of interest on the determinants of foreign investment, Chinese foreign investment, and Chinese foreign energy investment. Next, I present the theoretical model for the choice of investors, followed by the hypotheses and
empirical procedures used. I then detail my data sources and provide summary statistics, and proceed to describe the results for each of the empirical models. Finally, I conclude with remarks on the implications of my research and suggestions for future research.
2. Background of China’s Foreign Energy Investments
2.1 Background of China’s Energy Security
9
early 1960s, China imported a significant volume of oil from the Soviet Union (Qian, 2011, pg. 4). The discovery of larger domestic reserves, most notably the Daqing oil field in 1959, enabled China to become Asia’s largest oil producer and a net exporter by the 1970s. However, the rapid industrialization and economic growth that followed the Reform and Opening Up in 1978 led China’s energy demand to outstrip its domestic supplies. It again became a net oil importer in 1993 (Jiang & Sinton, 2011, pg. 10), the year after Deng Xiaoping’s “Southern Tour” led to a resurgence of economic growth. In 2013, China surpassed the United States as the world’s largest oil importer (EIA, 2015).
Figure 1.1: China’s Oil Production and Consumption
10 Figure 1.2: China’s Oil Imports by Country
11
Figure 1.3: China’s Natural Gas Production and Consumption
12
production remains at approximate parity with its consumption (EIA, 2015). For these reasons, China’s foreign investments in coal will not be included within this analysis. To do so would dilute this research’s focus on China’s energy security challenges, by including an energy type which China has adequate domestic reserves of.
As evidenced by the creation of a National Energy Commission in 2010, energy security issues have been assigned great importance by China’s leadership. Part of China’s response has been to increase investments in renewable energy, especially in wind and solar energy, but as displayed by the above chart, these energy sources constitute only a small proportion of China’s overall consumption. Ensuring adequate oil and natural gas supplies thus remains China’s central energy security challenge. China is investing heavily in domestic production by developing new oil and natural gas fields and by utilizing new exploration and production techniques such as hydraulic fracturing (EIA, 2015). This has included a more forceful assertion of its offshore claims in the South China and the Diaoyu Islands, bringing China into conflict with its maritime neighbors including Japan, the Philippines, and Vietnam. An example is the standoff with Vietnamese naval vessels that resulted from the China National Offshore Oil Corporation moving an oil rig into disputed waters near the Paracel Islands in May 2014 (Tiezzi, 2016).
China’s energy security strategy has also included a major focus on foreign investments. This began in earnest with the adoption of the Going Out policy in 1999, which exhorted
13
of the more outward-looking sectors; CNPC first pursued foreign investments in Sudan, Peru, and Kazakhstan in the early 1990s, while the government was still encouraging firms to focus on domestic development (Jiang & Sinton, 2011, pg. 10).
2.2 China’s Investors in Foreign Energy
2.2.1 National Oil Companies
China’s most prolific foreign energy investors have been its three national oil companies: China National Petroleum Corporation (CNPC), China Petroleum and Chemical Corporation (Sinopec), and China National Offshore Oil Corporation (CNOOC). The efforts of the NOCs to invest abroad actually precede the Going Out policy, with CNPC attempting to invest in Peru in 1992 and Sudan and Venezuela in 1996 (Jiang & Sinton, 2011, pg. 13). However, it was not until after the Going Out policy in 1999 that their international expansion attempts began to receive significant government attention and support. This support was couched not only as a means of enhancing China’s energy security, but also in terms of turning the NOCs into globally competitive firms, a major goal of the Going Out policy. The NOCs’ foreign investments have generally been in the form of Foreign Direct Investments, including both Merger and Acquisition (M&A) activity, entailing the acquisition of a controlling equity stake in a company, and
Greenfield Investments, entailing the organic creation of wholly-owned assets (ie. new
production sites) in foreign countries. Given data availability, the NOCs’ M&A activity will be the main focus of their investments that are analyzed in this thesis.2 Although this limits the scope of the analysis, it does permit a greater focus on the investments that entail acquiring existing foreign energy assets, rather than investments that simply involve the activities of Chinese energy firms in foreign countries. Moreover, the volume of global M&A activity in the
2 As I have not found any reliable database of Chinese Greenfield investments, these are excluded from this study
14
oil and gas sector vastly exceeds the volume of Greenfield Investments, so my data should continue to encapsulate the vast majority of China’s FDI in the oil and gas sector.
Figure 1.5: Volume of Global M&A and Greenfield Investments in the Oil and Gas Sector
Source: Deloitte (2013, pg. 5)
In addition to their role in securing foreign energy supplies to address China’s energy security, a number of motives have been ascribed to the NOCs’ foreign investments. Although they are state-owned firms, they also aim to be profitable and thus commercially viable, and accordingly their foreign investments play a role in enhancing revenues and reducing costs (Jiang & Sinton, 2011). As the domestic market is often not very profitable for China’s NOCs as the government sets non-market prices (Mocker, 2014, pg. 17), this includes selling oil and natural gas to international markets. Indeed, the International Energy Agency found that Chinese NOCs sold a high proportion of their foreign oil production to foreign markets rather than
shipping it to China, although due to paucity of data they could not form a reasonable estimate (Jiang & Sinton, 2011, pg. 17). Another potential motive is the acquisition of advanced
15
M&A activities and targeted at energy firms in developed countries, in addition to Joint Ventures they have entered with these firms.
2.2.2 Policy Banks
China’s energy investors also include two state-owned policy banks: the China Export-Import Bank and the China Development Bank (CDB). These banks, some of China’s most prolific overall foreign investors, have been the subject of multiple pieces of literature speculating as to their motives.3 As is the case for the NOCs, this discussion has focused on whether the policy banks are focused primarily on the “strategic interests of the Chinese
government,” including energy security, or the “commercial interests of Chinese firms” (Downs, 2011, pg. 2). Downs notes that the CDB in particular has striven to prioritize its commercial objectives and emerge as a major international bank, under the leadership of its Governor and later Chairman Chen Yuan. At the same time, Chen and the CDB have demonstrated a commitment to follow through on the CDB’s mandate to “support the Chinese government’s medium to long-term development strategies and policies” (Downs, 2011, pg. 10).4
The CDB and China Ex-Im Bank’s energy investments have primarily been in the form of loans, to either foreign state-owned energy companies or directly to foreign governments. These loans often require the recipient to sell a set volume of energy supplies to China’s NOCs at market prices over the term of the loan. The loans are in fact secured by the revenue the loan recipient earns from selling the energy supplies to the Chinese firms, (Downs, 2011, pg. 39), defining them as energy-backed loans (EBLs). An EBL is thus essentially a “futures contract to procure oil” (Forsythe & Sanderson, 2013). Although these loans are far fewer in number than the equity investments of the NOCs, they are generally larger, usually at least $4 billion, and
3 See Downs (2011) and Forsythe & Sanderson (2013).
16
have terms of up to 20 years. Some are also denominated in Renminbi, a component of China’s efforts to promote the internationalization of its currency.
2.2.3 Sovereign Wealth Funds
The final major type of energy investor is the sovereign wealth fund (SWF), represented by the China Investment Corporation (CIC) and the SAFE Investment Company. Rather than acquiring controlling shares in foreign energy companies, the SWFs’ investments are instead typically portfolio investments, which are the acquisition of non-controlling equity shares in companies. Portfolio investments do not grant the SWFs formal control over their targets’ operations; however, they do help the SWFs diversify their portfolios with the equity of foreign energy firms. This drive for diversification has arisen specifically in order to reduce the SWFs’ dependence on low-yielding U.S. Treasury bonds with higher-yielding foreign investments (Sun et al 2014, pg. 656). Moreover, some of these investments are still sufficiently large (multiple billions) as to grant the SWFs some influence over management of target firms. Accordingly, Sun et al (2014) proposes that the SWFs’ investments still share motives of seeking “strategic returns in policy and energy security,” by influencing foreign energy firms to be more open to granting concessions or joint ventures to Chinese firms (pg. 658).
3. Literature Review
3.1 Theoretical Literature
My analysis of China’s foreign energy investments has its foundations in the literature on general patterns of Outward Foreign Direct Investment (OFDI),5 especially regarding OFDI
5 Outward FDI consists of the foreign direct investment that one country grants to another, while Inward FDI (IFDI)
17
targeting resource acquisition, and on the patterns of Chinese OFDI specifically. I also touch on the literature on China’s foreign aid activities, which while not a component of OFDI has been suggested by research to have resource-seeking motives. I begin with the literature on the theoretical motives for OFDI, namely as to why foreign investment is attractive in the first place, and what characteristics make a host country an attractive target for FDI. Buckley & Casson (1976) present a twofold theory of FDI as (1) firms seeking to internalize external markets and (2) firms seeking to conduct operations in locations that minimize costs. Their theory addresses directly the profit motives of the firm, with each component addressing how firms use FDI to increase revenues and reduce costs, respectively. Their implication is that attractive targets for FDI will be characterized by both large potential markets and by low costs for factors of production.
18
More recently, literature has also emerged on specifically Chinese OFDI, the vast majority of which has emerged since the adoption of the Going Out policy in 1999. This literature includes both theoretical work on the probable motives for Chinese OFDI and
empirical work on the patterns and determinants of OFDI. The central theoretical piece is that of Cai (1999), who identified four motives for Chinese OFDI: (1) new markets, (2) natural
resources, (3) technology and managerial skills, and (4) financial capital. With this, Cai
recognized that the motives for foreign investment held by Chinese firms are often similar to the motives held by firms in developed economies, while also acknowledging the unique needs of Chinese firms and that “political considerations always play an important role,” especially since most multi-national Chinese firms are state-owned (pg. 870).
3.2 Empirical Literature
The vast majority of the empirical literature on Chinese foreign investment has emerged in the last decade, and analyzes data reported since the Going Out policy in 1999. One of the few studies to address data from before that threshold is Hong & Sun’s (2004) work, which used comparative data analysis rather than econometric procedure. They analyzed changes in the determinants of Chinese OFDI over the course of its early development in the 1990s. They found that while natural resource endowments were a significant positive determinant of OFDI, investments increasingly focused on acquiring foreign technologies and managerial skills over the course of the time period.
19
ordinary least squares model6 and a generalized least squares model incorporating random effects,7 they found that the target country’s market size, value of Chinese exports, and cultural proximity to China are all of positive significance8 to Chinese OFDI. More surprisingly, they found that a country’s level of political risk is of positive significance to investment, suggesting that Chinese firms “do not perceive or behave towards risk in the same way as do industrialised country firms” (pg. 30).9 They did not, however, find that a country’s natural resource
endowments are a significant determinant of investment. Cheng & Ma (2010), meanwhile, used a gravity model to analyze the determinants of Chinese OFDI. They found a negative
relationship between Chinese OFDI and target countries’ per-capita GDP, suggesting that Chinese FDI is more likely to flow to countries with a lower level of development (pg. 565).
The significance of resource endowments has continued to be disputed in further research on Chinese foreign investment. Cheung & Qian (2009) used a gravity model incorporating country fixed effects to analyze the determinants of Chinese Outward FDI stocks and flows. They found that resource endowments do have a significant effect, concluding that Chinese OFDI is both market-seeking and resource-seeking. Dreher & Fuchs (2011) examined the determinants of Chinese foreign aid, using a Poisson Pseudo Maximum Likelihood model designed to correct for heteroskedasticity and the large number of observations of zero in their data.10 They came to a conclusion similar to Buckley et al.’s (2007) regarding OFDI in that they
6 Pooled Ordinary Least Squares is the application of OLS to multiple independent samples drawn from the same
population at different time periods (McManus, 2011).
7 Generalized Least Squares (GLS) is used when the observations of the dependent variable may have unequal
variances and/or are correlated (ie. the residuals are correlated) (Kuan, 2004). It permits the inclusion of random or fixed effects in the model, and is thus extensively used in panel data analysis.
8 Unless otherwise noted, “significant” refers to a having a coefficient that is statistically significant at the 10%
level.
9 They attribute this potentially to the low cost of capital and support of state ownership enjoyed by many Chinese
firms, in addition to their expertise operating in emerging market economies.
20
found that while political factors are a significant determinant of foreign aid, resource
endowments are not. Lum et al. (2009), meanwhile, using comparative data analysis, concluded that China’s foreign aid has been “driven primarily by Beijing’s desire to secure and transport natural resources and secondarily for diplomatic reasons.” Returning to discussion of FDI, Kolstad & Wiig (2012) used an Ordinary Least-Squares model to examine the interaction effect between natural resource endowments and institutional quality. They found that the combination of a target state’s large natural resource endowments and low institutional quality led to a
positive relationship with Chinese OFDI.
Recognizing the ambiguity of the significance of natural resources in overall Chinese OFDI and foreign aid, some of the most recent research has addressed Chinese foreign investments that are specifically related to natural resources, especially energy. Qian (2011) used a Tobit model and then the Heckman two-stage method, modeling first the investor’s choice of whether or not to invest and then how much to invest, to analyze the determinants of Chinese OFDI in oil-producing countries. He found that while oil endowments did not predict the receipt of investment, there was a positive relationship between the size of oil endowments and the amount of investment. The first notable empirical analysis specifically studying the
determinants of Chinese foreign energy investments was completed by Mocker (2014). Using ordered logit and Tobit regression models, she found the target country’s sovereign credit rating, institutional quality, and degree of oil dependence to be of positive significance for the receipt and amount of Chinese energy investment.
I add to Mocker’s work on the determinants of Chinese energy investments by
21
such as credit risks and institutional quality that might deter investors, I focus more on factors that attract investment, such as opportunities to seek new markets or energy resources, as suggested by the theoretical literature. In my empirical methodology, I differ from her work in using the Heckman Selection model as opposed to multinomial logit, as well as by the inclusion of a 2SLS simultaneous equations model to investigate the relationship between energy
investment and FDI. My empirical analysis also includes a more detailed analysis of the effect of geographic region on energy investment, by including categorical variables for eight different regions rather than just a dummy variable for East Asia. Ultimately, I do not only address the role of specific empirical variables in determining Chinese foreign energy investment, but also provide insight into which of the broader theoretical determinants of foreign investment is receiving the greatest weight in China’s energy investment strategies.
4. Theoretical Model
4.1 Theoretical Framework
In constructing a theoretical model of Chinese foreign energy investments, I outline a theoretical framework that identifies the main possible rationales for foreign investment. In this, I start with Dunning’s (1977) eclectic paradigm for OFDI and further incorporate Cai’s (1999) motives for Chinese OFDI specifically.11 Dunning and Cai both offer seeking new markets as their first motive for foreign investment. Dunning’s second motive, efficiency and cost reduction, can be broken down into reducing the cost of operations and using financial capital efficiently, the latter of which is Cai’s fourth motive. Cai’s second motive, seeking natural
11 Although I am using the theoretical background provided by the literature on OFDI specifically, my theoretical
22
resources, overlaps well with the strategic assets subset of Dunning’s third motive of more general resource-seeking. I incorporate Cai’s third motive of seeking technology and managerial skills into the remainder of Dunning’s resource motive, so that the resource-seeking motive is divided between natural resources and more intangible resources (technology and managerial skills).
I also identify a fourth major theoretical motive of building political and diplomatic support through foreign investment. This motive is based on prior research including theoretical work by Zweig (2006) and empirical work by Dreher & Fuchs (2011) on the relevance of states’ institutional and cultural similarities and diplomatic relations with the investor country. This theory posits that states use foreign investment to support the development of political regimes and institutional designs compatible with their own, both to enhance the ease with which the investor government and its firms can conduct business within the target states, and as a freestanding goal to promote the global adoption of the investor state’s political model. They also use investment to support target states who will offer the investor state diplomatic support, in order to both support the economic development of their allies and to incentivize states to adopt foreign policy stances favorable to the investor state in the hope of increasing their probabilities of receiving investment.
23 Table 1.1: Theoretical Framework
Motive
1: Market-Seeking
2: Efficiency/Cost Reduction 2a Cost Reduction
2b Efficient Use of Financial Capital 3: Resource-Seeking
3a Natural Resource-Seeking
3b Technology and Managerial Skills-Seeking 4: Political/Diplomatic Support-Building
4.2 Theoretical Model
Based on the theoretical framework, I model the investor’s choices of whether or not to invest in energy in a given target country, and how much to invest. The literature on foreign investment, while rich in theoretical frameworks, is lacking in formal theoretical models, so I will here innovate by extending my framework to a formal model. My theoretical model will consist of three components: first the investor’s choice to invest in foreign energy assets, second the investor’s pursuit of various motives in foreign energy investment, and third the investor’s allocation of foreign energy investments between different countries.
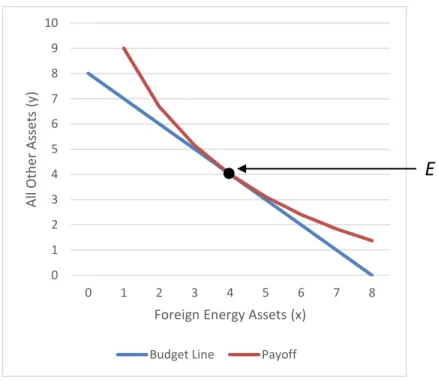
I first consider the investors’ choice between investing in foreign energy assets and all other assets as a choice between two goods. Chinese investors will choose to invest in foreign energy assets, here x, when the expected payoff12 of investing is greater than the payoff of investing in other assets, y. Investors seek to maximize their payoffs through combining each of these goods in optimal amounts. I express the investors’ payoff function as a standard Cobb-Douglas function, assuming convex preferences:
𝑃𝐼 = 𝑥𝛼𝑦(1−𝛼)
12 Here, I use “payoff” not to describe the monetary profit of an investment, but to describe its total benefits to the
24
Where 𝛼 is a value between 1 and 0, and 𝛼 and 1 − 𝛼 represent the payoff weightings placed on energy assets x and all other assets y, respectively.
The investors’ optimal payoff is constrained by their budget: the availability of funds with which to make investments. Given a set amount of funds I, the investors must choose how to allocate these funds between investments in energy assets and all other assets:
𝐼 = 𝑥 + 𝑦
The payoff-maximizing point can therefore be found at the point where, for a given I, the budget constraint is tangent to the outermost attainable payoff function, shown as point E:
Figure 2.1: Payoff Maximization between Investment Categories
Second, I examine investors’ pursuit of different sources of payoffs within foreign energy assets. My theoretical framework identified four main motives for Chinese foreign energy investors: market access, efficiency/cost-reduction, access to resources, and political/diplomatic
0 1 2 3 4 5 6 7 8 9 10
0 1 2 3 4 5 6 7 8
All Ot
h
er
As
se
ts
(y
)
Foreign Energy Assets (x)
Budget Line Payoff
25
support. Hence, I consider investment in foreign energy assets as the sum of investments targeting each of these four motives:
𝑥 = 𝑥1+ 𝑥2+ 𝑥3+ 𝑥4
Where 𝑥1 represents investments seeking market access, 𝑥2 represents investments seeking
efficiency and cost reductions, 𝑥3 represents investment seeking access to resources, and 𝑥4
represents investment seeking political support.
Investors seek the combination of these four sub-categories of foreign energy investment that will maximize their total payoff. I thus incorporate each sub-category into a Cobb-Douglas framework in order to specify the investor’s total payoff:
𝑃𝑥= 𝑥1𝛼1𝑥
2 𝛼2𝑥
3 𝛼3𝑥
4
(1−𝛼1−𝛼2−𝛼3)
Where 𝛼1, 𝛼2, 𝛼3, and 1 − 𝛼1− 𝛼2 − 𝛼3 represent the payoff weightings placed on investing in market access, efficiency/cost-reduction, resource access, and political support, respectively.
This payoff function is constrained by the investor’s total budget for foreign energy investments as previously specified, which must be allocated between investments pursuing each of the theoretical motives for foreign energy investment:
𝑥 = 𝑥1+ 𝑥2+ 𝑥3+ 𝑥4
For any two of these four types of foreign energy investment, while holding the other two
26
Figure 2.2: Payoff Maximization between Energy Investment Motives
(At constant x2 and x4)
Third, I consider how investors decide how much to invest in energy assets in each country. Energy investment in each country will yield different balances of the payoff sources of market access, efficiency/cost-reductions, resource access, and political support, depending on the characteristics of each country and its energy assets. An investment of one billion dollars in energy assets in one country may achieve massive cost reductions but provide little access to energy resources, while that same investment in another country may yield few cost benefits but provide access to vast amounts of energy resources. Investments at different time periods may also yield different balances of the payoff sources, depending on changes in factors such as country policy and global energy markets. Accordingly, I consider the actual attainment of the four identified motives of foreign energy investment as varying at the country and time level:
𝑥𝑖𝑡 → 𝑀𝑖𝑡, 𝐶𝑖𝑡 𝑅𝑖𝑡, 𝑆𝑖𝑡 0
1 2 3 4 5 6 7 8 9 10
0 1 2 3 4 5 6 7 8
Ma
rk
et
-Se
ekin
g
In
ve
stme
n
ts
(x1)
Resource-Seeking Investments (x3)
Budget Line Payoff
27
Where 𝑀 represents market access, 𝐶 represents efficiency/cost-reductions, 𝑅 represents
resource access, and 𝑆 is political support, in country i at time t. Here, the variables ,𝐶, 𝑅, and 𝑆
represent the investment’s actual payoff to the motives they represent, not simply the dollar value invested seeking each of these motives as 𝑥1, 𝑥2, 𝑥3, and 𝑥4 represent.
The total payoff to the investor for a given time period, therefore, is the aggregate payoff from each of these four motives for foreign energy investment across all countries in that time period:
𝑃𝑡𝑥 = ∑(𝑀
𝑖𝑡+ 𝐶𝑖𝑡+ 𝑅𝑖𝑡+ 𝑆𝑖𝑡) 𝑁
𝑖=1
28 5. Empirical Model
5.1 Hypotheses
I formulate hypotheses that use empirical proxies to indicate the significance of each of the motives for investment identified in the theoretical model. I first consider a null hypothesis where Chinese foreign energy investments are allocated randomly, or only by reference to geographic region or a time trend. I then seek to reject this null hypothesis in favor of each alternative hypothesis, which is proposed based on the theoretical model.
Hypothesis 1: Countries with higher gross domestic products (GDP) will receive higher levels of
Chinese energy investment.13
Hypothesis 2a: Countries with higher levels of oil production will receive higher levels of
Chinese energy investment.
Hypothesis 2b: Countries with higher levels of natural gas production will receive higher levels
of Chinese energy investment.
These hypotheses address the market-seeking component of my theoretical model. As Gross Domestic Product describes a country’s total market size, its significance would suggest Chinese energy investors are market-seeking in that they target larger overall markets, capable of
generating greater revenues for the investors. Production of oil and natural gas, which refers to the current volumes of oil and natural gas being produced in a country, serve as proxies for the current size of a country’s energy market. Their significance would indicate that investors are market-seeking with a more specific focus on the energy market by targeting countries with larger energy markets.
13 Can also be expressed as “will be more likely to receive Chinese energy investment,” in reference to the binary
29
Hypothesis 3: Countries with higher levels of Chinese outward foreign direct investment (OFDI)
will receive higher levels of Chinese energy investments
This hypothesis also relates to the market-seeking motive in the theoretical model. It proposes that investors will target countries that receive higher levels of overall Chinese FDI as these markets are already being developed by other Chinese firms and thus will be easier for Chinese energy investors to gain a market presence. It proposes that Chinese energy investors do not only pursue larger markets for their own operations, but may cooperate with Chinese firms of other industries to seek out new markets for Chinese firms of all industries.
Hypothesis 4: Countries with higher GDP growth rates will receive higher levels of Chinese
energy investment.
Hypothesis 5: The lower the rate of China’s GDP growth, the higher the level of foreign energy
investment will be.
These hypotheses both address the efficiency/cost-reduction motive, seeking to proxy the efficient use of financial capital. Hypothesis 4, also considered by Qian (2011), proposes that investors seek to enhance the efficiency of their capital by deploying it rapidly-growing markets where expected returns are greater. Along these same lines, Hypothesis 5 addresses the
competition from domestic investment as discussed in the theoretical model. It posits that if the prospects for domestic investment are less attractive as indicated by China’s GDP growth, investors will seek to more efficiently allocate their capital by shifting funds to foreign energy investments.14
14 At the same time, I recognize that the relationship between China’s economic growth and foreign investments
30
Hypothesis 6: Countries with lower per-capita GDP will receive higher levels of Chinese energy
investments
This hypothesis also addresses the efficiency/cost-reduction component of the theoretical model, by specifically addressing the cost reduction side. It proposes that as investors can conceivably operate with lower costs in less-developed economies where the costs of labor, natural resources, and other factors of production will presumably be lower, they will prefer to invest in
less-developed economies as indicated by lower per-capita GDP. This hypothesis was similarly considered by Cheng & Ma (2010) to investigate if Chinese investors have a preference for developing countries.
Hypothesis 7a: Countries with higher proven oil reserves will receive higher levels of Chinese
energy investments
Hypothesis 7b: Countries with higher proven natural gas reserves will receive higher levels of
Chinese energy investments
Hypothesis 8: Countries with a larger presence of non-Chinese International Oil Companies
(IOCs) will receive higher levels of Chinese energy investment
Hypothesis 9: The higher the global market price of oil, the higher the level of Chinese foreign
energy investment.
31
energy firms for access to energy resources. Finally, as China’s energy insecurity would be enhanced by a rise in global energy prices (which could constitute an adverse supply shock), Hypothesis 9 posits that China’s efforts to secure access to energy resources will be more urgent if the global price of oil15 is seen to be rising.16
Hypothesis 10: Countries with scores on the Polity IV index closer to China’s score will receive
higher levels of Chinese energy investment
Hypothesis 11: Countries that are engaged in arms trade17 with China will receive higher levels
of Chinese energy investment
These hypotheses both relate to the fourth component of the theoretical model: building political support as a motive for investment. A focus on countries with similar political systems to China as indicated by the Polity IV score, which scores countries’ political systems on a scale from fully democratic to fully autocratic, would indicate the use of energy investments to build political support for China in countries with compatible political systems, or perhaps to support allies who share China’s model of governance.18 A focus on countries with close diplomatic and security relations with China as indicated by arms trade would suggest a relationship between economic cooperation through energy investments and security cooperation through arms trade, whereby China uses its economic influence to advance its security influence.19
15 The price of oil alone, rather than the prices of oil and natural gas, was used because oil prices are more
standardized than natural gas prices (for reasons such as different prices for liquefied natural gas).
16 It is also plausible that a relationship between energy investments and the price of oil would indicate a
market-seeking motive, as the potential revenues to be generated from global energy markets would be higher if the price of oil is rising.
17 Including both the sale of arms to China and the purchase of arms from China.
18 The Polity IV score is also used by Mocker (2014) as a measure of institutional quality, where she hypothesized
that Chinese energy investment would follow more democratic states due to their higher institutional quality. I question this assumption that Chinese investment follows high-quality democratic institutions, and instead propose instead that Chinese investors will prefer institutions that are compatible with their own.
19 An analogous relationship between Chinese arms trade and foreign aid was investigated by Wang et al (2013)
32
5.2 Empirical Model
Using these hypotheses, I construct an empirical model to analyze two primary dependent variables: the binary variable of whether or not a country received energy investment, and the continuous variable of how much energy investment was received. I consider the effect of the hypotheses on each dependent variable separately, as following Qian (2011, pg. 15), I recognize that the determinants of the decision to invest are not necessarily the same as the determinants of how much to invest. My unit of observation is each country in a given year.20 I take Qian’s (2011) approach of beginning with a Tobit model before moving to a two-stage Heckman Selection model. I then proceed to use a 2SLS simultaneous equations model to analyze the relationship between the dependent variable of how much investment was received and the potentially endogenous explanatory variable of Chinese OFDI.
The Tobit model, which censors observations of the dependent variable at zero from below, is used to provide a preliminary analysis of the determinants of how much to invest. The two stages of the Heckman Selection model allow me to separately consider the decisions of whether or not to invest and how much to invest. By including a non-selection hazard as an explanatory variable in the second stage, it allows for the analysis of the decision of how much to invest while holding constant for the factors that affect the selection of which countries receive investment in the first place. My simultaneous equations model, for which I use a Two-Stage Least Squares (2SLS) approach, investigates the two-way relationship between foreign energy investment and OFDI by simultaneously estimating models where each dependent variable serves as an explanatory variable for the other model.
20 The decision to use the country rather than the firm as the unit of observation is because a large number of
33
5.2.1 Tobit Model with Random Effects
In order to provide an initial analysis of which countries receive energy investment, I first use a Tobit model with random effects, with the continuous variable of the amount of investment as the dependent variable. In applying the Tobit model, I censor the observed values of the dependent variable at zero from below, using the process specified by Tobin (1958). Given that most observations of the dependent variable are zero—cases where no investment was
received—this prevents the downward bias that may result from using Ordinary Least Squares or Generalized Least Squares. I specify the inclusion of random effects by target country in the model given the panel nature of the data.
Equation 1.1: Tobit Model with Random Effects
ln (𝐸𝐼𝑖𝑡) = 𝛽0+ 𝛽1𝑀𝑖(𝑡−1)+ 𝛽2𝐶𝑖(𝑡−1)+ 𝛽3𝑅𝑖(𝑡−1)+ 𝛽4𝑆𝑖(𝑡−1)+ 𝐵5𝐷𝑖(𝑡−1)+ 𝛽6𝑟𝑖
+ 𝛽7𝑇𝑡+ 𝑣𝑖+ 𝜀𝑖𝑡
Here, 𝐸𝐼 represents total Chinese energy investment received by a country in a given year, in millions of US Dollars. 𝑀 is a vector for market-seeking factors, and includes the natural logs of GDP, both oil and natural gas production, and Chinese OFDI. 𝐶 is the vector for efficiency/cost-reduction factors, and includes the country’s real GDP growth rate, China’s GDP growth rate, and the natural log of the country’s per-capita GDP. 𝑅 is the vector for resource access variables, including the natural logs of oil and natural gas reserves, the number of oil and gas “supermajors” with significant operations in that country in that year, and the global market price of Brent crude oil.2122 The supermajors detailed are Exxon-Mobil, Chevron, Conoco-Phillips, Royal Dutch Shell, BP, and Total. 𝑆 is the vector for political support, including both
21 China’s GDP growth rate and the Brent crude price vary only by year t, not by country i (see Appendix A). 22 The Brent crude price, based in the European market, was used rather than West Texas Intermediate (WTI) as it
34
the difference in the country’s Polity IV score from China’s score, and a binary variable for whether or not arms trade with China was engaged in in that year, including both arms sales to China and purchases from China. The expanded specification of this equation can be found in Appendix A.
𝐷 represents a dummy variable that takes a value of 1 if Chinese OFDI is observed and 0 if it is missing. Except for Chinese OFDI, other variables are available for a large number of countries (on average, 149 countries per year), with 2080 observations in the estimation
sample.23 Chinese OFDI, however, is missing in 56 percent of the estimation sample. Analyzing this data as reported would result in a highly constrained number of observations, and produce results possibly biased by the sample selection. I address this problem by using the dummy variable adjustment approach as described by Cohen et al. (2003). This approach entails creating a dummy variable to indicate available values in the OFDI variable, and replacing the missing values for OFDI with zeros, instead of dropping these observations entirely. As an alternative specification, I re-estimate equation (1.1) only for the sample of 1162 observations where Chinese OFDI was originally observed.
𝑟 expresses a categorical variable for geographic region. Each of the eight regions—East & Southeast Asia, Africa, Central Asia, Europe, Latin America, the Middle East, North America, and Oceania—was assigned a value between 1 and 8. As China’s own region, East & Southeast Asia was assigned the value of 1 to serve as the baseline region for the variable. 𝑇 is a vector for both the time trend and the time trend squared. Finally, 𝑣 represents the country random effects, and 𝜀 expresses the error term for the model.
35
The lagged values (t – 1) are used for all non-time and non-geography explanatory variables, as the investors will be making their decisions to invest in time t with t – 1 being the most recent period for which data on the various explanatory variables is available.
5.2.2 Heckman Selection Model
The Tobit model deals with the fact that only a minority of country-year dyads received Chinese energy investment by censoring the other values where no investment was observed from the estimation. However, I assume that the selection of which values are observed is non-random, as this represents the investors’ choice of which countries to grant investment to. Accordingly, the Tobit estimation results may be biased by failing to take into account the determinants of why the observed values of investment were selected in the first place. To account for this, I use the Heckman two-stage model. Heckman’s (1979) model allows for the analysis of a dependent variable where the selection of the dependent variable is not random. Given that my data is in panel data format, I will again follow Qian (2011) in using
Wooldridge’s (1995) process to tailor the Heckman model to panel data analysis, by incorporating random effects at both stages.
The first stage of the Heckman two-stage uses a Probit estimation to analyze the factors that determine the observation of the dependent variable. To tailor the model to my panel data, I include random effects in the estimation. In addition to reporting the determinants of the
selection of the dependent variable, this model also generates an inverse Mills ratio, which serves as the non-selection hazard variable used in the second stage of the model.
36
excluded from the second stage on the rationale that as a binary variable, its main impact would be on the first stage of decision making, where simply a binary decision of whether or not to invest is being made. This expectation was borne out by testing: when included in both models (with other variables excluded from the second stage) arms trade was highly significant in the first stage and not significant in the second stage. Accordingly, it is an appropriate variable to serve as an instrument for the first stage of the model.
Equation 2.1: First Stage of Heckman Selection Model
𝐼𝑖𝑡 = 𝛾0+ 𝛾1𝑀𝑖(𝑡−1)+ 𝛾2𝐶𝑖(𝑡−1)+ 𝛾3𝑅𝑖(𝑡−1)+ 𝛾4𝑆𝑖(𝑡−1)+ 𝛾5𝐴𝑖(𝑡−1)+ 𝛾6𝐷𝑖(𝑡−1)+ 𝛾7𝑟𝑖
+ 𝛾8𝑇𝑡+ 𝑣𝑖 + 𝜀𝑖𝑡
Where 𝐼𝑖𝑡 is a binary variable indicating whether or not investment was observed. The
explanatory variables used for this first stage model are the same as those used previously for the Tobit model. A represents the variable for arms trade, and is specified separately from the S
vector here because it is not included in the second stage of the Heckman model, in order to achieve identification of the first stage of the model.
The second stage of the Heckman model normally uses an Ordinary Least-Squares regression to analyze the effect of the explanatory variables on the dependent variable for those values for which the dependent variable is observed. Using the Wooldridge (1995)
customization process, I instead use a Generalized Least-Squares (GLS) estimation with random effects for panel data. In this case, it analyzes the effects of the explanatory variables on the amount of investment received for the country-year dyads for which investment was received.
Equation 2.2: Second Stage of Heckman Selection Model
ln (𝐸𝐼𝑖𝑡) = 𝛿0+ 𝛿1𝑀𝑖(𝑡−1)+ 𝛿2𝐶𝑖(𝑡−1)+ 𝛿3𝑅𝑖(𝑡−1)+ 𝛿4𝑆𝑖(𝑡−1)+ 𝛿5𝐷𝑖(𝑡−1)+ 𝛿6𝑟𝑖
37
Where 𝐸𝐼𝑖𝑡 is the value of total investment. The equation is estimated only for observations of
𝐸𝐼𝑖𝑡 greater than zero, and 𝑀𝑖𝑙𝑙𝑠𝑖𝑡 is the inverse Mills ratio (non-selection hazard).
5.2.3 Simultaneous Equations
One of the explanatory variables in the prior models, Chinese Outward FDI, has the dubious distinction of being a likely endogenous variable. It is not only a possible determinant of the dependent variable of Chinese foreign energy investment, but also a dependent variable in its own right which might be endogenous to energy investments, as the majority of energy investments in this study are a component of FDI. Overall Chinese FDI might follow energy investments as they provide access to new markets, just as energy investments might follow overall FDI for the same reason. Moreover, as discussed in the theoretical model, overall FDI includes all non-energy investments which compete with energy investments, and funds are presumably allocated to each asset class simultaneously. Accordingly, it is necessary to estimate simultaneous equations of the determinants of both Chinese energy investments and Chinese Outward FDI.
To do so, I use a two-stage least squares (2SLS) estimation. This process estimates two equations simultaneously, where the dependent variable in the first equation serves as an explanatory variable for the dependent variable in the second equation, which itself is an explanatory variable in the first equation. A 2SLS model also includes exogenous variables which serve as explanatory variables for both equations, and separate exogenous variables which each serve as explanatory variables for one of the two equations. These exogenous variables which are only explanatory variables for one of the two dependent variables serve as
38
𝑦1 = 𝛼𝑜+ 𝛼1𝑥1+ 𝛼2𝑦2+ 𝛼3𝑥2+ 𝜀; 𝑦2 = 𝛽𝑜+ 𝛽1𝑥1+ 𝛽2𝑦1+ 𝛽3𝑥3+ 𝑣
Where 𝑦1 and 𝑦2 are the two dependent variables, 𝑥1 is an exogenous variable for each equation, and 𝑥2 and 𝑥3 are exogenous variables for 𝑦1 and 𝑦2, respectively.24
In my estimations, the amount of Chinese energy investment and Outward FDI are the two dependent variables, which are each explanatory variables for each other. My equations for the simultaneous determination of these two categories of investment are as follows:
Equation 3.1: GLS Estimation of Total Energy Investment for Simultaneous Equations
ln(𝐸𝐼𝑖𝑡) = 𝛼0+ 𝛼1𝐺𝐷𝑃𝑖(𝑡−1)+ 𝛼2ln (𝑃𝐶𝑖(𝑡−1)) + 𝛼3𝐼𝑂𝐶𝑖(𝑡−1)+ 𝛼4𝑆𝑖(𝑡−1)+ 𝛼5ln (𝑂𝑅𝑖(𝑡−1))
+ 𝛼6ln(𝐹𝐷𝐼𝑖𝑡) + 𝛼7𝑇𝑡+ 𝜀𝑖𝑡
Equation 3.2: GLS Estimation of FDI for Simultaneous Equations
ln(𝐹𝐷𝐼𝑖𝑡) = 𝜃0 + 𝜃1𝐺𝐷𝑃𝑖(𝑡−1)+ 𝜃2ln (𝑃𝐶𝑖(𝑡−1)) + 𝜃3𝐼𝑂𝐶𝑖(𝑡−1)+ 𝜃4𝑆𝑖(𝑡−1)+ 𝜃5ln (𝐸𝑖(𝑡−1))
+ 𝜃6ln(𝐸𝐼𝑖𝑡) + 𝜃7𝑇𝑡+ 𝑣𝑖𝑡
𝐺𝐷𝑃 represents the vector of the natural log of real GDP and the GDP growth rate, while
𝑃𝐶 is per-capita GDP. 𝑆 is again the vector of political support variables, the Polity IV score difference with China and the presence of arms trade with China. 𝐼𝑂𝐶 is the variable for the number of oil supermajors present. 𝑂𝑅, meanwhile, represents oil reserves. It is used as the instrumental variable for total energy investment, as oil reserves are an energy resource that, based on the theoretical model, energy investment will seek access to, but not overall investment.
𝐸 is Chinese exports to the country, and is used as the instrumental variable for FDI as the theoretical literature proposes that FDI seeks to develop export markets, but my own theoretical
24 Presentation based on StataCorp (2011, pg. 2074). Note that this is only an example of a generic 2SLS model,
39
model has not proposed this as a motivation for specifically energy investment.25 The other explanatory variables are all exogenous variables to both of the dependent variables in the equations.
It should be noted here that the goal of the estimation in Equation 3.2 is not to provide a comprehensive model for the determination of FDI; that is beyond the scope of this thesis and already the subject of extensive prior research. Instead, it is simply to allow for an analysis of the determination of energy investment while holding constant for the determination of FDI. As these two categories of investment are endogenous to each other, it is only possible to examine the nature of their two-way relationship by running models for each category of investment simultaneously where each serves as an explanatory variable for the other.
6. Data Sources
6.1 Dependent Variables
My primary data sources on Chinese energy equity investments are the American Enterprise Institute (AEI) and the Heritage Foundation’s China Global Investment Tracker, and Thomson Reuters’ SDC Platinum database, following Mocker (2014). The AEI and Heritage Foundation database provides a comprehensive listing of all Chinese foreign direct investments in amounts of $100 million or greater since 2005, and can be sorted by sector and subsector to identify oil and gas investments. For each investment, it identifies the month and year, U.S. Dollar amount, investor, target/recipient, country, region, and percentage stake acquired if an equity share was acquired. In order to include deals of less than $100m and deals from 2001
25 The appropriateness of the instrumental variables was tested by separately regressing each dependent variable
40
through 2004, I have supplemented this database with Thomson Reuters’ SDC Platinum database on M&A deals, provided through the UNC Kenan-Flagler Business School. This database also provides detail on the month and year of the investment, the U.S. Dollar amount, the investor and the target, and the percentage stake acquired. For the sovereign wealth funds, which often
engage in portfolio investments that are not publicly reported in addition to M&A activity, I have supplemented the AEI and Heritage data with secondary sources, including Martin (2010) and Sun et al. (2014)’s studies of China’s sovereign wealth funds’ investments.
Loans, like the sovereign wealth fund investments, proved more problematic as they are not always publicly reported by the Chinese banks issuing them, and no comprehensive database on these loans is available. Instead, I have constructed my own listing of Chinese energy loans using the loans detailed in secondary sources. Downs’ (2011) detailed study on the China Development Bank and China Export-Import Bank’s large scale Energy-Backed Loans issues has proven particularly helpful.
6.2 Explanatory Variables
For energy data, namely the data on production and proved reserves of oil and natural gas, I use the International Energy Statistics database of the U.S. Energy Information
Administration (EIA). This database lists oil and natural gas production and proved reserves for all countries and regions for each year from 1980 to 2014. I also use the EIA’s website to provide the annual averages for the price of Brent crude oil. For the IOC variable on the
41
ConocoPhillips, BP, Royal Dutch Shell, and Total)26 for each of the given years, and listed all countries that those reports detail a significant production presence in.27 I then compiled this data to list the total number of supermajors with significant operations in each country in each year.
International trade-related data includes Chinese Exports and Chinese Outward Foreign Direct Investment. Trade data on Chinese Exports have come from the World Bank’s
international trade statistics in the World Integrated Trade Solutions database. The sources for Chinese OFDI are the United Nations Conference on Trade and Development (UNCTAD)’s annual statistics on bilateral FDI, detailing FDI flows from China to each country in U.S. Dollars, and the National Bureau of Statistics of China’s China Statistical Yearbook, used for 2013 for which the UNCTAD data was not available. These sources have all been used extensively by the existing literature on Chinese FDI. For the required general economic data, namely Gross Domestic Product, per-capital GDP, and real GDP growth, I use the World Bank’s annual statistics on current real GDP and per-capita GDP, in U.S. dollars.
For political/diplomatic factors, I proxy the similarity of each country’s political system to China’s, and whether or not they have a close diplomatic and security relationship. For political similarities, I use the Center for Systemic Peace’s Polity IV dataset, from the Center’s Integrated Network for Societal Conflict Research database. This dataset lists all independent states with a population of 500,000 or greater for each year since 1800. It assigns each state in
26 For U.S. firms (Exxon-Mobil, Chevron, and ConocoPhillips), this was the 10-K report; for European firms (BP,
Shell, and Total), this was the 20-F report.
27 The supermajors’ presence proved to be one of the most difficult elements of data collection, as their methods
42
each year a “polity” score based on the characteristics of its government and political system, ranging from fully autocratic with a score of -10 to fully democratic with a score of 10. My variable is the difference in each state’s polity score with China’s score in each year, in order to proxy for the similarity of each state’s political system to China’s.
To proxy for a strong security relationship with China, I created a binary variable of whether or not a state engaged in arms sales with China in a given year. This variable is coded 1 if the state either placed orders for arms with China or received shipments of arms from China in that year, or if China placed arms orders or received shipments from that state, and 0 otherwise. My data on arms sales is from the Stockholm International Peace Research Institute’s (SIPRI) Arms Transfers Database. This database enables the user to generate a register of all arms trade between given sets of recipients and providers for a defined time period. The register lists each arms deal individually, defining the recipient and the provider, the name of the weapons system, and the years in which orders were placed and shipments were made. I generated registers of all arms deals with China as a recipient or as a provider for all years from 2000 to 2014.
43 7. Summary Statistics
7.1 Dependent Variables
The summary statistics provided in Table 2.1 cover the main dependent variables of Chinese foreign energy investment by country from the period 2001 to 2014. The two listings for the main dependent variables are invest, which is a binary variable of whether or not investment was received, and tot_invest, which is the amount of investment in that year in millions of U.S. Dollars. They also cover data for the subsidiary dependent variables, energy investments divided by type of investment (loans and equity) and by type of investor (national oil company v. policy bank v. sovereign wealth fund). Only the observations included within the estimation sample of the main Tobit and Heckman models are detailed. Separate observations are listed for each country for each year:
Table 2.1: Summary Statistics for Dependent Variables
It should be noted that each unit of the variable refers to the total amount of energy investment in a country in a given year, not the value of a single investment/deal. For example, the largest value for tot_invest of $25,300 million is the largest amount of investment granted to any country in a single year, in this case Russia in 2009, through multiple individual investments.
(1) (2) (3) (4) (5)
VARIABLES LABELS N mean sd max min
invest =1 if energy investment made 2,080 0.0726 0.260 1 0
loans =1 if loans made 2,080 0.00962 0.0976 1 0
tot_loans Loans in millions USD 2,080 49.74 808.2 25,000 0
equity =1 if equity investment made 2,080 0.0678 0.251 1 0
tot_equity Equity investment in millions USD 2,080 117.3 742.0 20,790 0
policy_bank =1 if policy bank investment made 2,080 0.0101 0.1000 1 0
tot_pol_bank Policy bank investment in millions USD 2,080 50.32 809.0 25,000 0
noc =1 if national oil company investment made 2,080 0.0490 0.216 1 0
tot_noc National oil company investment in millions USD 2,080 93.29 686.8 20,790 0 sov_wealth =1 if sovereign wealth fund investment made 2,080 0.00577 0.0758 1 0 tot_sov_wealth Sovereign wealth fund investments in millions USD 2,080 8.846 137.1 3,240 0
44
Insight into the total values of the various categories of Chinese energy investment, by type of investment and by type of investor, is provided in the figures below:
Figure 3.1: Chinese Foreign Energy Investment by Type of Investment
Figure 3.2: Chinese Foreign Energy Investment by Type of Investor
45
investment. However, investment thereafter leveled off, and in fact since 2012 has been in decline.
Figure 3.3: China’s Foreign Energy Investment by Year
46
China’s energy investment has been widely distributed geographically, but by far the largest shares have gone to Latin America and Central Asia (including Russia):
Figure 3.5: Chinese Energy Investment by Geographic Region
47
Figure 3.6: China’s Largest Foreign Energy Investment Targets
7.2 Explanatory Variables
Summary statistics for the explanatory variables are detailed below. For ease of
description and interpretation, they are listed in their raw values, even though it is the natural log of many that is actually used in the estimations. Because both lagged and current values of the explanatory variables are used in certain cases,28 observations are listed from the years 2000 to 2014, again limiting observations to those included in the estimation sample. The summary statistics for OFDI are shown with the orginal number of missing values for the variable, before those missing values were replaced with zeros as per the dummy variable adjustment process.
48
Table 2.2: Summary Statistics for Explanatory Variables
8. Results
8.1 Tobit Model with Random Effects Results
First, using a Tobit model with random effects, I estimate the effect of the explanatory variables on the determination of the value of Chinese energy investment granted to each country in each year. A separate estimation (Column 1) was performed without the inclusion of the dummy variable used to control for missing values of Chinese OFDI, using only the originally reported observations of the explanatory variables. The main model with the inclusion of the dummy variable is reported in Column 2.
(1) (2) (3) (4) (5)
VARIABLES LABELS N mean sd max min
per_cap Per-capita Gross Domestic Product in US Dollars 2,070 11,051 17,107 113,732 106 gdp Gross Domestic Product in US Dollars 2,070 3.349e+11 1.303e+12 1.742e+13 2.201e+08
gdp_growth Real GDP growth rate in % 2,080 4.134 5.369 104.5 -62.08
fdi Chinese Outward Foreign Direct Investment in millions of US Dollars 1,215 108.9 399.5 4,808 -814.9
oil_res Oil reserves in billions of barrels 2,078 8.330 33.01 297.7 0
gas_res Gas reserves in trillions of cubic feet 2,075 40.69 176.5 1,700 0 oil_prod Oil production in thousands of barrels per day 2,080 523.2 1,577 13,973 -0.840 gas_prod Gas production in billions of cubic feet per year 1,967 702.1 2,610 25,728 0
polity Polity Score Difference with China 2,076 10.91 6.251 17 -3
ioc Number of oil supermajors present 2,080 0.889 1.593 6 0
arms =1 if arms deals made with China 2,080 0.152 0.359 1 0
brent Annual average Brent crude oil price in US Dollars 2,080 70.13 31.28 111.6 24.46 china_growth China's Real GDP growth rate in % 2,080 9.819 1.873 14.19 7.350
49
Table 3.1: Tobit Model with Random Effects Results
(1) (2)
limited full
VARIABLES LABELS Log of Investment (USD MM) Log of Investment (USD MM)
2.region Africa 1.576 0.343
(1.944) (1.885)
3.region Central Asia 7.070*** 7.655***
(2.417) (2.309)
4.region Europe 0.637 -0.700
(2.800) (2.540)
5.region Latin America 5.186** 3.893*
(2.405) (2.121)
6.region Middle East 2.279 1.077
(2.706) (2.468)
7.region North America 5.520 4.873
(3.427) (3.394)
8.region Oceania 10.655*** 6.874**
(3.211) (3.109)
l_lngdp Natural Log of Real GDP (t-1) 2.446*** 1.831***
(0.723) (0.587)
l_lnoil_prod Natural Log of Oil Production (t-1) 0.140 0.678
(0.452) (0.415)
l_lngas_prod Natural Log of Gas Production (t-1) -0.498 -0.384
(0.444) (0.411)
l_lnfdi Natural Log of Chinese Outward FDI (t-1) 0.147 0.223
(0.402) (0.340)
dl_lnfdi =1 if Log of lagged FDI is observed 2.233
(1.583)
l_growth GDP Growth (t-1) 0.226* 0.109
(0.127) (0.076)
l_china_growth China's GDP Growth (t-1) -0.445 -0.537
(0.438) (0.388)
l_lnper_cap Natural Log of Per-Capita GDP (t-1) -2.306*** -2.051***
(0.715) (0.629)
l_lnoil_res Natural Log of Oil Reserves (t-1) 2.275*** 1.298*
(0.754) (0.687)
l_lngas_res Natural Log of Gas Reserves (t-1) -0.952 -0.460
(0.766) (0.717)
l_ioc Number of international oil companies present (t-1) 1.755*** 1.581***
(0.415) (0.382)
l_brent Annual average Brent crude oil price in US Dollars (t-1) 0.038 0.065*
(0.044) (0.038)
l_polity Polity Score Difference with China (t-1) -0.198 -0.137
(0.132) (0.114)
l_arms =1 if arms deal made with China (t-1) 3.371*** 3.926***
(1.295) (1.186)
trend Time Trend 2.974* 2.951***
(1.736) (1.051)
trend2 Time Trend Squared -0.132 -0.148***
(0.086) (0.056)
Constant Constant -73.197*** -61.210***
(17.023) (13.325)
Observations 1,162 2,080
Number of country 124 155