Association between Patient-‐Reported and
Performance-‐Based Measurements of Physical
Function in an Arthritis Sample
Spring 2014 Undergraduate Honors Thesis
Sravya Durbha, Department of Health Policy and Management
Approved by:
Primary Advisor: Bryce B. Reeve, PhD Associate Professor
Department of Health Policy and Management
Gillings School of Global Public Health
Secondary Advisor: Karl Umble, MPH, PhD Assistant Professor
Department of Health Policy and Management
Table of Contents
ABSTRACT ... 3
ACKNOWLEDGEMENTS ... 4
INTRODUCTION ... 5
REVIEW OF ACADEMIC LITERATURE ... 7
METHODS Participants/Sample ... 12
Study Design ... 12
Outcomes Measures ... 14
Covariates ... 17
Statistical Analysis ... 18
Limitations ... 19
RESULTS Demographic Characteristics ... 23
Aim 1 Results ... 24
Aim 2 Results ... 25
Aim 3 Results ... 27
DISCUSSION ... 28
IMPLICATIONS ... 31
CONCLUSION ... 33
REFERENCES ... 34
ABSTRACT
Patient-reported data, specifically patient-reported outcomes (PRO) measurement, has
grown in relevance to patient-centeredness in healthcare delivery as well as in clinical
outcomes research. Nonetheless, the uptake of PRO measurement tools, although
many have been validated and approved for use in research settings, has been slow on
the part of clinical outcomes researchers due to their preference for more objective,
performance-based outcomes measurement. Consequently, there is a need for
confirming the value of PROs in patient-centered research and assessing the role
dynamic of PROs versus performance-based tests in outcomes research. In an effort to
fill investigators’ knowledge gap in this area, the following secondary data analysis,
conducted upon baseline and follow-up data from the 2011 Walk With Ease program (a
community walking program for arthritis patients), evaluated the validity and value of
PRO measures as compared to performance-based measures of physical functioning.
Primary results found that patient-reported and performance-based measures were
poorly correlated with one another, indicating that they measure physical function
differently from one another. Furthermore, both measures detected significant changes
in physical functioning over time, indicating that they may be equivalently effective in
assessing an intervention centered on improving physical functioning. Finally, the
patient-reported measures were more strongly inversely correlated with other key
arthritis symptoms than performance-based measures, meaning they may have been
more effective in measuring physical function in the context of arthritis. There findings
will ideally provide an impetus for researchers to recognize the validity and value-added
ACKNOWLEDGEMENTS
This researched analyzed data from the 2011 “Evaluation of Group and Self-directed
Formats of the Arthritis Foundation's Walk With Ease Program” study, a coordinated
effort among the Arthritis Foundation, the Centers for Disease Control and Prevention
(CDC), the UNC Institute on Aging, and the UNC Thurston Arthritis Research Center.
The study was funded through a cooperative partnership between the CDC and the
Association of American Medical Colleges. The study was published in 2011 in the
American College of Rheumatology journal.
I would like to thank Dr. Leigh Callahan of the UNC Thurston Arthritis Research
Center, primary author of the study manuscript, for approving my endeavor to conduct
research on her data results. I would also like to thank Dr. Rebecca Cleveland of the
UNC Thurston Arthritis Research Center for allowing me access to the data necessary
to conduct my secondary data analysis and packaging the data to fit my research needs
and capabilities.
Furthermore, I would liked to thank Beth Schaffer and Megan Roberts, doctoral
students in the Health Policy and Management department of Gillings School of Global
Public Health, were instrumental in helping me develop my research proposal and
statistical analysis. Last, but not least, I would like to acknowledge and thank my
primary and secondary advisors, Dr. Bryce Reeve, Dr. Karl Umble, for their
unconditional guidance, support and belief in my potential to follow my senior honors
INTRODUCTION
The mid-1970s onwards saw an emergence of the use of patient-reported data to inform
decision-making in a number of settings, including healthcare delivery, clinical research,
and health policy. Patient-reported outcomes (PROs), or directly communicated
information from patients about health conditions, grew out of the burgeoning movement
towards incorporating a patient-centered focus into healthcare and clinical research. A
growing evidence base indicates that patients who are more actively engaged in their
healthcare choose higher-value healthcare services and experience higher-quality
outcomes—improving the quality of healthcare overall.1,2 Accompanying this growth in
evidence is the industry-wide recognition that patients are the ultimate recipients of care
and thus, the most influential decision-makers regarding their care. Therefore, patient
reports emerged as a valuable mechanism to measure, interpret, and enhance the
quality of care. PROs center mostly on the area of global or holistic health-related
quality of life (HRQOL), but can also be specific to certain disease areas or symptoms.3
PROs play an important role in assessing the physical function of individuals with
arthritis. Functional disability, or the relative inability to perform activities of daily living
(ADL) and instrumental activities of daily living (IADL), is one of the most damaging and
pervasive effects of arthritis. However, individual abilities to perform ADLs and IADLs
are influenced by a multitude of overlapping physiological and environmental factors,
making it difficult to measure how physically functional patients are in reality. For this
reason, researchers have found that patient self-reports are useful in measuring
PRO measurement instruments have historically posed barriers on performance
measurement because of the methodological difficulty in administering the instruments
and ensuring that they meet appropriate psychometric standards in terms of reliability
and validity.5 Moreover, researchers continue to speculate that PROs lack validity
because of the subjective nature of patient self-reports and imprecision of existing PRO
measurement tools.6,7 Healthcare providers have also raised questions as to whether a
patient self-report is as valid as the current “gold standard” method--
performance-based (“objective”) tests, such as a “sit test” to measure lower extremity mobility. Thus,
in recent years, PRO research has aimed to develop statistically and clinically superior
measurement tools that may act as a new gold standard in assessing patient
experiences. An important part of validating these new tools is to compare them to the
REVIEW OF ACADEMIC LITERATURE
Measuring HRQOL and patient satisfaction with care has grown to become a key
consideration in at least two areas: quality of care improvement and clinical research.
Significant healthcare quality improvement efforts in the United States originated
subsequent to Avedis Donabedian’s pivotal 1966 publication “Evaluating the Quality of
Medical Care”,which introduced the ‘structure-process-outcomes’ model for measuring
the quality of care.8 However, it was not until the Institute of Medicine (IOM) released
the “Crossing the Quality Chasm” report in 2001 that the systemic importance of the
quality of healthcare shot to the forefront of the national healthcare agenda and
encouraged government and industry investment in quality improvement initiatives.9
In spite of the IOM report’s emphasis on “patient-centeredness” as one of its key
“aims for improvement” of quality in the publication, the health care delivery setting
continues to be biased towards the usage of objective measures of quality, rather than
subjective, patient-centered measures, to determine gaps in care. The Patient
Protection and Affordable Care Act of 2010 mandated the creation of a National Quality
Strategy to reemphasize the aims of health care quality improvement and to reestablish
six key priority areas in moving towards a high-value health system. One of the key
components of this six-pronged approach is “person- and family-centered care”, which
acknowledges the importance of recognizing patients as the ultimate decision-makers in
their care.10
The movement towards patient-centeredness and engagement has also found
promise over the past two decades within the rapidly growing area of HRQOL research.
scientists conducting cancer trials continue to acknowledge “survival” and “disease-free
survival” as the main end points of cancer therapy, and frequently raise questions about
the value of PROs in cancer drug research.14 However, the movement towards
patient-centered research has emphasized the need to look at patients as a whole. This
emphasis requires the need to observe how a disease and its treatment may impact the
lives of individuals with that disease and their caregivers. HRQOL examines how
therapy affects a person’s life physically, mentally, and socially. Specifically, it covers
five categories that include duration of life, impairments, functional status, health
perceptions, and opportunities.15 Additionally, measurement of HRQOL may be
particularly useful in clinical trials, where improvements in medical care and technology
have led to advanced laboratory or clinical tests whose results may not be universally
applicable to patients in a variety of circumstances. Many trials have also found that two
different treatments may have a similar impact on survival or another clinical end point,
but display adverse effects (for example, fatigue or nausea) that affect activities of daily
living or other aspects of patient quality of life16. Thus, many clinical trials now include
HRQOL measures as secondary endpoints and some trials use symptom response as
the primary endpoint.17
Since domains of HRQOL and satisfaction with care are subjective in nature,
scholars recognize that patient reports, as a more organized method of communication,
are the gold standard for self-reporting individual experiences and perspectives.
Patient-Reported Outcomes (PROs) are “any report of the status of a patient’s (or person’s)
health condition, health behavior, or experience with healthcare that comes directly from
else”.18 PRO measures are the instruments or questionnaires used to assess PROs in a
systematic, reliable, and valid way. PRO measures have been an essential component
of the assessment of patients with arthritis, specifically rheumatoid arthritis (RA), for
almost two decades. A long-term cure for RA does not currently exist; thus, treatment of
RA must focus profoundly on relieving pain and other disabling effects and improving
patients’ ability to perform activities of daily living20. A seminal 1996 publication in the
British Journal of Rheumatology described the need for a measure to identify and
quantify the ‘disability impact’ of RA, which emphasized the highly subjective nature of
arthritis symptoms and outcomes. Little research has been done, however, to observe
whether these types of measures correspond with clinically observed
performance-based test results or clinician-reported measures.20,21 Although considerable research
has been done in the realm of PRO measures within the past few decades, greater
room for exploration still exists within best practices for developing and administering
PRO measures in clinical research and healthcare delivery settings.13
In subsequent years, new PRO measures began to emerge such as the Medical
Outcome Study Short Form-36 (SF-36) and the Health Assessment Questionnaire
(HAQ). However, many of these questionnaires were either broad and imprecise, or
precise but limited to a narrow range of measurement.22,23 These systems became
widespread to the extent that PROs were being used more frequently in quality
improvement initiatives and clinical research, but there remained room for improvement
regarding the validity of the PRO measures, as they had the potential to favor
practicality (due to the concise nature of their short forms and their relative ease of
the National Institutes of Health’s Roadmap for Medical Research initiative, the
PROMIS (Patient-Reported Outcomes Measurement Information System) HAQ
(henceforth referred to as PROMIS), deriving from the original HAQ, was introduced in
2004 as a superior tool that could be used “across a wide variety of chronic diseases
and conditions and in the general population”.24 PROMIS incorporates computerized
adaptive testing (CAT) and short-form patient questionnaires in the domains of physical
health, mental health and social health. PROMIS is based on item response theory
(IRT), which allows the PROMIS CAT to individually tailor assessments to patients
according to previous responses. This allows for a dynamic outcomes measurement
experience and results in precise and briefer measurement than traditional static forms
used by existing PRO measures.23
PROMIS is still undergoing psychometric validation assessments. However, from
the clinical trial and quality of care perspectives, the rapid integration of PROMIS into
clinical outcomes research presents the possibility of savings in research costs. The
streamlined survey framework and CAT format of PROMIS presents the possibility of
enhanced efficiency of clinical outcomes research. Researchers can potentially cut
costs significantly in administering the questionnaire to patients, as it only asks the
questions that are most relevant to patients and omits those questions that are
imprecise, redundant, or irrelevant.24 Furthermore, more precise PROMIS measures
allow for smaller sample sizes in trials (fewer enrolled subjects) while retaining the same
amount of statistical power of the trial; when the PRO is the primary endpoint.25
PROMIS publications over the past 8 years have focused on demonstrating the
clinical characteristics. The "Walk With Ease" (WWE) Program, a 6 week-long
community-based walking program for groups of adults with arthritis, was established
about ten years ago by the Arthritis Foundation. It was designed to incorporate regular,
medium-intensity physical activity into arthritis treatment, as this type of activity has
been shown to relieve pain, fatigue, and joint stiffness among arthritis patients.22 The
program was modified in 2006 to be amenable to a self-directed format as well as the
original group format. A 2011 study conducted by Callahan, et al. evaluated the two
program formats. The study enrolled a total of 426 WWE study participants and
assessed physical function (performance-based and self-reported) as well as other
arthritis symptoms (pain, fatigue) at baseline and after 6 weeks. Performance-based
measurements were taken by administering clinical observational tests, such as timed
chair stands to assess lower extremity strength and walking speed tests to assess
mobility. Additionally, the researchers measured patient-reported physical function with
PRO measures including PROMIS and HAQ.28
This study followed up on the results of the aforementioned study and used a
secondary data analysis to assess the association between patient-reported and
performance-based measures of physical function. It specifically assessed the
relationship between patient-reported measures (i.e.,PROMIS and HAQ) and
performance-based measures (e.g. timed chair sits, 6-minute walk tests) of physical
functioning. The study was broken down into the following research aims:
AIM 1. Evaluate the association between performance-based (PB) measures and PRO
AIM 2. Evaluate differences between the PB measures and the PRO measures in
measuring change in PF between the instructor-led arm of the trial and the
self-directed arm of the trial.
AIM 3. Evaluate the differences between the PB measures and the PRO measures of
PF as they relate to other key patient-centered outcomes including pain, fatigue, and
stiffness.
METHODS
Participants/Sample
This study was a secondary data analysis on the results of the Arthritis Foundation’s
Walk With Ease (WWE) study. The WWE study recruited participants who self-reported
joint pain, stiffness, or any type of physician-diagnosed arthritis. The participants were
also required to be at least 18 years old, able to speak English, cognitively intact, and
without a serious medical condition in order to be eligible to participate in the study.
After recruitment efforts, 462 participants were enrolled into the study. Of these
participants, 415 participants completed PROMIS Physical Functioning measures via
Computerized Adaptive Testing (CAT).
Study Design
The WWE study aimed to evaluate the effectiveness of revisions to the WWE program,
namely the incorporation of a self-directed option in addition to an instructor-led group
option. Subsequent to being enrolled in the study, the participants were able to self
format or the self-directed format--for the duration of the 6 week WWE program. The
Instructor-led group participants were directed through the 6 week program by an
instructor and met three times a week for one hour, while the self-directed participants
did not have an instructor and used the WWE workbook to guide themselves through
the program. The group instructors were WWE leaders who were recruited from fitness
centers and senior centers, and trained using the Arthritis Foundation WWE Leader
Training Guide.
The participants completed patient-reports and performance-based tests of
physical function at baseline and at completion of the six-week walking program. Group
and self-directed participants completed baseline assessments at various community
locations one week before the group classes began. Participants completed an
electronic or a paper-based self-report questionnaire, as well as a set of
performance-based tests. Baseline assessments took place from June through September 2008. The
participants completed follow up assessments at each site at six weeks after
commencing the program. Assessments were conducted from August to November
2008. The assessments consisted of performance-based tests of physical function,
patient-reported questionnaires, and a written satisfaction survey regarding their
Outcomes Measures
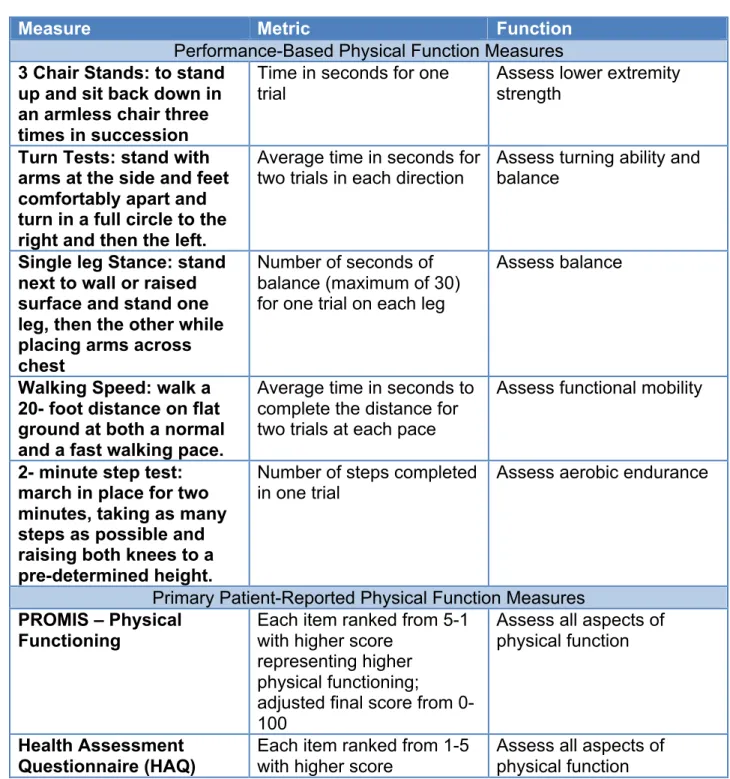
Table 1 below summarizes the outcomes measures used in this study and the metrics
according to which they were measured.
Table 1. Outcomes measures classified by type of measurement.
Measure Metric Function
Performance-Based Physical Function Measures
3 Chair Stands: to stand up and sit back down in an armless chair three times in succession
Time in seconds for one trial
Assess lower extremity strength
Turn Tests: stand with arms at the side and feet comfortably apart and turn in a full circle to the right and then the left.
Average time in seconds for
two trials in each direction Assess turning ability and balance
Single leg Stance: stand next to wall or raised surface and stand one leg, then the other while placing arms across chest
Number of seconds of balance (maximum of 30) for one trial on each leg
Assess balance
Walking Speed: walk a 20- foot distance on flat ground at both a normal and a fast walking pace.
Average time in seconds to complete the distance for two trials at each pace
Assess functional mobility
2- minute step test: march in place for two minutes, taking as many steps as possible and raising both knees to a pre-determined height.
Number of steps completed
in one trial Assess aerobic endurance
Primary Patient-Reported Physical Function Measures
PROMIS – Physical Functioning
Each item ranked from 5-1 with higher score
representing higher physical functioning; adjusted final score from 0-100
Assess all aspects of physical function
Health Assessment Questionnaire (HAQ)
Each item ranked from 1-5 with higher score
representing lesser physical functioning; adjusted final score from 0-60
Secondary Patient Self-Reported Measures
Visual Analog Scale (VAS—
Pain/Stiffness/Fatigue
Mm from beginning of 100 mm line
Assess arthritis symptoms
Primary Outcome: The primary outcomes measure for the participants in this study was physical function, which was measured by way of patient-reported and
performance-based measures.
Performance-Based Tests: Eight physical performance-based tests were
conducted to observe the physical functioning of each participant. The tests were
completed on the same day as the patient-reported measures.
PROMIS - Physical Function: The electronic self-reported questionnaires were
administered using the National Institutes of Health PROMIS (Patient-Reported
Outcomes Measurement Information System) Computerized Adaptive Testing
(CAT) instrument to measure Physical Function. Data from the instrument were
captured in the PROMIS Assessment Center, a secure online research
management server. The PROMIS electronic questionnaire uses Item Response
Theory (IRT) to measure aspects of Health-Related Quality of Life (HRQOL)—in
this case, Physical Function. Items are selected for each participant based on the
participant's responses to previously administered items. The IRT-based test
uses an algorithm to “estimate a person's score and the score's reliability and
then chooses the best next item”.24 All the items/questions ask to report on
dressing yourself, washing back), middle trunk (sitting on bed), and lower body
(walking, running).
On average, participants completed approximately 5 questions in
PROMIS, where each question was tailored to their specific physical functioning
ability. They rated the difficulty with which they are able to complete each
physical activity described in the items using two 5-option response scales.
Based on the type of question posed, the response scales are ranked either from
“without any difficulty” to “unable to do”, or “not at all” to “cannot do”. The item
responses are scored 1-5 such that a higher score represents higher physical
functioning. Item scores are adjusted for assistance by people or devices,
averaged, and multiplied by 25 to give the total score on a scale of 0-100.
HAQ: The disability scale of the Stanford Health Assessment Questionnaire
(HAQ-DI) assesses self-report function. The HAQ consists of 20 questions. It
differs from the PROMIS questionnaire in terms of not being adaptive and having
a 4-option response scale for each of the items as opposed to 5 options. Though
the HAQ-DI response scale still ranges from “without any difficulty” to “unable to
do”, The PROMIS scale incorporates the option of choosing “with a little difficulty”
in one of its response scales. Furthermore, the HAQ response scale options are
ranked from 0-3 by increasing difficulty, while the PROMIS response scale
options are ranked 5-1 by decreasing difficulty. Therefore, an increase in the
HAQ score would represent a greater degree of disability in physical functioning,
disability in physical functioning. The final HAQ scores, ranging from 0-60, are
obtained by adding up the scores from individual items.
Secondary Outcome: the main secondary outcome measures were arthritis symptoms, namely pain, stiffness, and fatigue.
Visual Analog Scale (VAS): The self-report measure used to measure arthritis
symptoms was the VAS. For pain, participants completed the measure by
marking their pain experience over the last 7 days on a 100 mm line that ranged
from “no pain” to “pain as bad as it could be”. Stiffness and fatigue were
measured similarly. Higher VAS scores indicated a greater degree of fatigue,
pain, and stiffness.
Covariates
Information regarding gender, age, race, education, and BMI were self-reported.
Gender was reported as male or female. Actual age was measured as a continuous
variable, and standard deviation and range were also reported. Race was also stratified
into three levels: Caucasian, African-American, or other. Education was dichotomized
as greater than high school or less than high school. BMI was calculated by
self-reported height and weight and self-reported in kg/m2, and was stratified into two levels: less
Statistical Analysis
All analyses will be conducted using STATA 13.
AIM 1. Evaluate the association between performance-based (PB) measures and PRO measures of physical function.
Aim 1 attempts to answer the question of whether patient-reported outcomes
(PRO) measures, HAQ and PROMIS, and performance-based (PB) measures
are measuring the same aspects of a specific endpoint-- in this case, physical
functioning. The hypothesis was that both methods of measurement are
assessing different aspects of physical function respectively, predicting a fair to
moderate degree of correlation between the two types of measures. In order to
test this hypothesis, the study calculated Spearman’s rank correlation coefficients
between the participants’ scores of each of the PRO measures and each of the
PB measures at baseline and at six week follow-up (subsequent to the WWE
intervention). The Spearman’s correlation method will be used rather than
Pearson correlations as the physical function scores cannot be assumed to be
continuous or normally distributed..The correlation coefficients will be reported
and the strength of the correlations will be classified according to Table 2 below.
Table 2. Qualitative classification of correlation strength
R-Value Strength of Spearman’s Correlation
< 0.3 Poor
0.3 ≤ X < 0.5 Fair
0.5 ≤ X <0.8 Moderate
AIM 2. Evaluate differences between the performance-based measures and the PRO measures in measuring change in physical functioning between the Instructor-led (Group) arm of the trial and the Self-directed (independent) arm of the trial.
Aim 2 attempts to answer the question of whether or not the PRO measures and
the PB measures measure the same aspects of physical function within the context of
evaluating the effectiveness of the two interventions over the two time points. In
alignment with the hypothesis of Aim 1, which predicted that the PRO and PB measures
each measure different aspects of physical function, the Aim 2 hypothesis consequently
predicts that there will be different findings for the effectiveness of the interventions
when using either the PRO or PB measures of physical functioning.
In order to answer this question, baseline and follow-up WWE program scores
were analyzed in two different ways-- within each study arm and for the study overall:
1. Significance of Score Differences within each Study Arm: two-sample t-tests
were conducted between baseline and follow-up scores for all physical function
measures. Two separate sets of t-test were conducted-- one set consisting of
tests between baseline and follow-up scores in Arm 1 of the study, and another
for the same scores in Arm 2. These tests assessed the significance of the
differences in scores between baseline and follow-up within each arm of the
study to compare the number of significant differences over time between each
of the study arms and between each type of physical function measure.
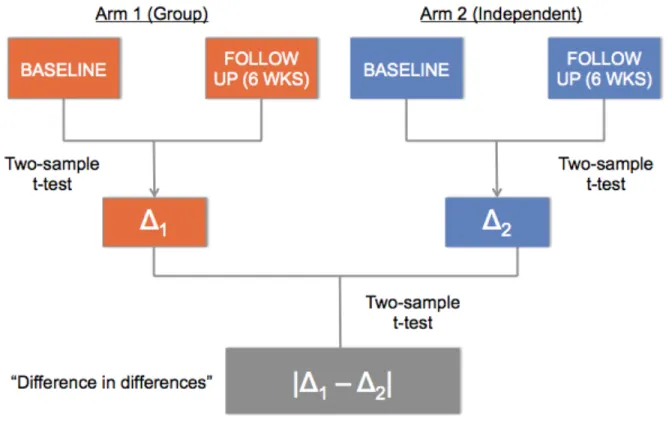
2. Significance of Differences in Score Differences: An additional set of two-sample
t-tests was conducted for the difference in scores for physical function measures
observed whether the score differences themselves were significantly different
for each of the physical function measures between each intervention arm of the
study.
Figure 1. Statistical Analysis Framework for Aim 2
AIM 3. Evaluate the differences between the PB measures and the PRO measures of PF as they relate to other key patient-centered outcomes including pain, fatigue, and stiffness.
Aim 3 delves into the convergence of PRO and PB measures of physical function
with other measures of key arthritis outcomes. In particular, past studies have found that
pain, fatigue, and stiffness are highly negatively correlated with physical function in
Furthermore, these outcomes are extremely subjective and are difficult to measure in a
standardized, objective manner. Consequently, the hypothesis for this aim predicted
that the PRO measures would have higher magnitudes of correlations (i.e. more
negative correlations) with pain, fatigue and stiffness as compared to the PB measures
due to the incorporation of subjective patient self-reports in PROs. Spearman’s
correlation coefficients were calculated at baseline and follow-up among all the scores
from the physical function measures and the scores from Visual Analog Scale (VAS),
the PRO measure of pain, fatigue, and stiffness.
The correlation coefficients will be calculated with reference to:
1. Comparing the PB measure of PF with pain, fatigue, and stiffness
2. Comparing PRO measures of PF with pain, fatigue and stiffness
The strength of the correlation coefficients will be classified according to Table 2 above.
Limitations
The Walk With Ease study is unique in that it incorporated participant preference for
instructor-directed versus self-directed walking programs, and allowed for participants to
self-select the Group or Independent groups (Arm 1 or Arm 2). However, this format, in
comparison with traditional randomized controlled trials, poses a rather formidable
limitation for statistical analysis, particularly in reference to Aim 2 of this study. The
authors of the study allowing for participants to self-select which arm of the study they
would like to participate in has the potential to affect outcomes from baseline to
follow-up, as an individual who willingly chose the self-directed arm may work harder to
group. Consequently, this will affect the way the physical function measures assess this
change in outcomes.
Additionally, this study inherently assumes that the performance-based (PB)
tests are the “gold standard” in the measurement of physical function. However, it may
be possible that other types of performance-based tests may be more appropriate to
assess physical function among arthritis patients in particular. Furthermore, the results
of this study may yield some insight into the future use of PRO versus PB tests for
arthritis patients of a certain age in rural and urban areas of North Carolina, but may not
be widely generalizable across medical conditions (such as diabetes or cancer) or
geographic locations outside of the state of North Carolina.
Lastly, the self-report (PRO) measures examined in this study are unlike the PB
measures in that they consolidate all three parts of the human body into one measure.
That is, the questions in the PROMIS questionnaire, for example, are not specific to
physical function in the upper, middle, or lower trunks of the body. In contrast, the PB
measures assess different types of physical function in different areas of the body; for
example, the “Timed Chair Stand” tests assesses only lower extremity strength (Table
1). Consequently, there may exist discrepancies related to the fact that, if the PRO
questionnaires were broken up to be specific to the three aforementioned anatomical
areas of the body, participants may achieve better or worse scores or performance than
compared to individual performance based measures (that correspond to three
RESULTS
Demographic Characteristics
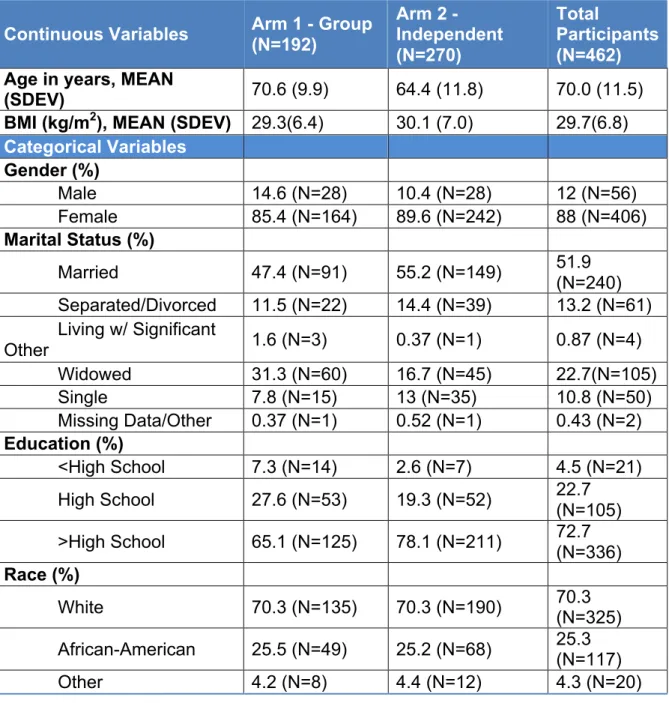
The baseline demographic characteristics for the participants enrolled in the Walk With
Ease (WWE) Program are summarized in Table 1 (Appendix A). A total of 462
participants were enrolled into the study at baseline. The majority of participants
(N=270, 58.4%) selected Arm 2 of the study (the Independent, or self-directed arm),
while the remaining participants (N=192, 41.6%) selected Arm 1 of the study (the
Group, or instructor-led arm). Participant demographic data showed that the average
age of an individual enrolled in the study was 70 years, and the average BMI was 29.7.
Most participants were female overall and within both arms of the study: Arm 1 (N=164,
85.4%) and Arm 2 (N=242, 89.6%) The majority of participants were married (N=240,
51.9%), had beyond a high school education (N=336, 72.7%), and were White (N=325,
70.3%).
Of note in this data is that Arm 1 participants were on average 6 years older than
Arm 2 participants, perhaps indicating that older participants more often wished to be in
a group environment versus an independent environment. Additionally widowed
participants may have been more likely to choose the Group arm of the study for the
same reasons, as evidenced by the fact that 31.3% participants who selected Arm 1 of
Aim 1 Results
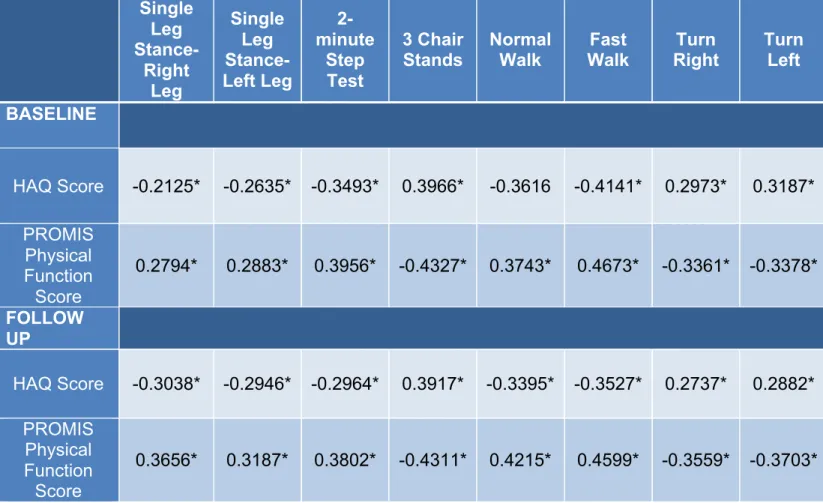
Aim 1 analysis results are summarized in Table 2 (Appendix B).
In accordance with the knowledge that a higher HAQ score represents a lower degree
of physical functioning, most of the correlations between HAQ scores and PB measure
scores exhibited negative associations. Furthermore, the correlations between PROMIS
scores and PB measure scores were aligned with the fact that a higher PROMIS score
represents higher degree of physical functioning, The exceptions to this pattern were
the baseline and follow-up score correlations between the PB tests ‘3-Chair Stands’,
‘Turn Right’, and ‘Turn Left’, all three of which exhibited positive correlations with HAQ
and negative correlations with PROMIS. An explanation for this occurrence is likely
related to the fact that all three of these tests use the metric of time to assess physical
function or mobility. For example, ‘Turn Right’ measures the amount of time in seconds
that it takes the participants to turn 360° to the right. Participants who required less time
to complete the assigned task for each PB test, whether at baseline or at follow-up,
likely had a higher degree of physical functioning than their counterparts who took a
longer time and consequently have lower scores for each test. Because HAQ scores
also exhibit an inverse relationship with physical functioning, the correlations between
the three aforementioned PB test scores and HAQ scores have a net positive
association.
The magnitudes of correlations, reported in Table 2, ranged from 0.2125 to
0.4673 at baseline and 0.2737 to 0.4599 at follow-up. The overall range of correlations
can thus be qualitatively classified as “Poor” to “Fair, as the values fall below 0.3 and
PROMIS were -0.7198 and -0.7364 at baseline and follow-up respectively, indicating a
“Moderate” to “Strong” correlation. This result is not unexpected given the knowledge
that HAQ and PROMIS are both considered the “gold standard” in PRO measure
scales; as such, one would anticipate a high degree of association between the two
tests in their ability to measure physical function. The absolute value of the average
correlation between HAQ and the PB tests was 0.3267 at baseline and 0.3176 at
follow-up. The average correlations between PROMIS and the PB tests were slightly higher,
with absolute values of 0.3639 at baseline and 0.3879 at follow-up. Both the correlations
of the highest magnitude (-0.4327 at baseline and -0.4311 at follow-up) were between
the average PROMIS score and the average ‘3 Chair Stands’ score.
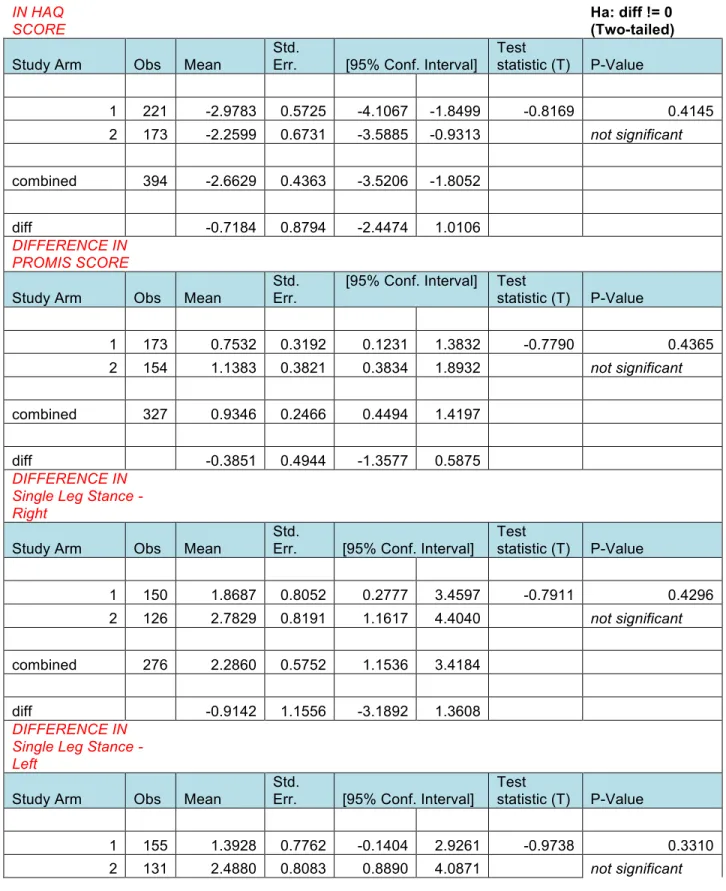
Aim 2 Results
The results of the first t-test analysis for Aim 2 are summarized in Table 3 and 4
(Appendix C), and the results of the second analysis are summarized in Table 5
(Appendix D).
Tables 3 and 4 report the two-tailed and one-tailed significance for each physical
function measure within each study arm. The first two t-test analyses found 8 significant
differences in Arm 1 and 9 significant differences in Arm 2 when interpreted in terms of
two-tailed significance, indicating that the measures may have been slightly more
effective at measuring physical function in Arm 2, or the in the independent setting.
However, when the alternative hypothesis was defined as the Ha: diff > 0 (the difference
in scores is greater than zero), meaning that the follow-up score for each measure was
Arm 1 and Arm 2. The measures for which the alternative hypothesis was defined as
such were ‘PROMIS score’ (PRO), ‘Single Leg Stance - Right’, ‘Single Leg Stance -
Left’, and ‘Two-Minute Step Test’, as these measures are defined by metrics that one
would expect to increase as physical function increases as a result of the WWE
program. For example, ‘Two-Minute Step Test’ assesses the number of steps that a
participant can take in 2 minutes of marching in place. The remaining measures’ score
differences were tested for significance based on the one-tailed alternative hypothesis
Ha: diff < 0 (meaning that the follow-up score is significantly less than the baseline
score) because they are defined by metrics that are expected to decrease with greater
physical function, such as the ‘Normal Walk’ test which measures the number of time in
seconds that a participants takes to walk a 20-foot distance at a normal walking pace.
For these tests, 6 significant differences were found for each study arm.
Furthermore, the results found that, in Arm 1, both of the PRO measure scores
exhibited significant differences over time and the majority (6 out of 8) of total PB
measures had significant differences in scores when observing two-tailed significance.
Similarly, Arm 2 results saw 2 significant score differences in both of the PRO measures
again, and 7 significant differences out of the 8 total PB measure score differences.
The analysis found further that the difference in scores for the ‘Two Minute Step
Test’ was significant neither at the two-tailed nor at the one-tailed level, raising the
question of whether the test was effective in measuring its respective aspect of physical
functioning (in this case, aerobic endurance) in either intervention arm of the study.
The first set of t-tests found that 100% of the PRO measures exhibited significant
significant differences for Arm 1 and Arm 2 respectively. However, the results of the
second set of two-tailed t-tests found there were no significant differences in score
differences among any of the measures, whether PRO or PB.
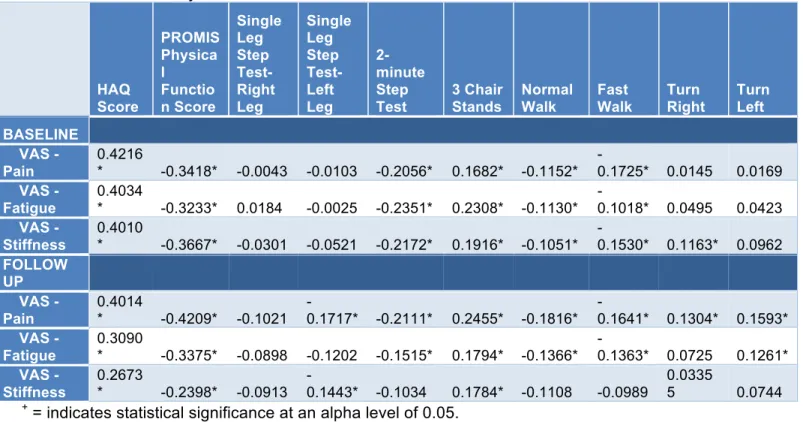
Aim 3 Results
Aim 3 analysis results are summarized in Table 6 (Appendix E).
The signs of the Spearman’s correlations displayed in Table 6 exhibit a pattern
consistent with the earlier remarks about the relationships among the different physical
function measures and key arthritis outcomes measures—for example, PROMIS is
negatively correlated with pain, fatigue, and stiffness because as these arthritis
outcomes increase in magnitude, the PROMIS physical function score would
presumably decrease in magnitude, exhibiting an inverse relationship. The average
correlation between HAQ and VAS (reported as absolute value) was 0.4087 at baseline
and 0.3259 at follow-up, while the average baseline and follow-up correlations between
PROMIS and VAS were 0.3439 and 0.3327 respectively. These values fall into the
classification of “moderate” correlation. 100% of the correlations between each of the
VAS measures and the PRO measures of physical function were statistically significant
at a significance level of 0.05. The average correlations between VAS and the PB
measures were significantly lower than the aforementioned correlations with the PRO
measures: 0.0239 at baseline and 0.0339 at follow-up—these correlations can be
classified as “poor”. Furthermore, only 27 of the 48 correlations (56.3%) between the
The results showed that VAS– Stiffness scores had the lowest of correlations
with both HAQ and PROMIS at baseline and at follow-up compared to the other VAS
measures of key arthritis outcomes. Correspondingly, the VAS-- Pain scores had the
highest correlations with HAQ and PROMIS of the three key arthritis outcomes
measures. The only exception to this pattern occurred in the baseline correlations
between VAS and PROMIS, wherein the highest correlation (-0.3667) was actually
between VAS—Stiffness and PROMIS while the lowest correlation (-0.3233) was
between VAS—Fatigue and PROMIS.
DISCUSSION
In exploring the convergence between PRO and PB measurement tools, the study aims
answered three broader questions that have greater implications on the future use of
PRO measures:
• Do patient-reported measures and performance-based measures of physical
function measure the same or different aspects of physical functioning?
The Spearman’s correlations calculated for Aim 1 of this study were “poor” to “fair”,
supporting the original hypothesis that predicted a “fair” to “moderate” degree of
correlation between the PRO measures, PROMIS and HAQ, and the PB measures of
physical functioning. Thus, it can be reasonably stated that, although both types of
measures are intended to measure the physical function of an individual, perhaps each
measure assesses different facets of physical function. This is consistent with the
information from my Limitations section that mentions that, when isolated, each
particular skill or part of the body. For example, the ‘3 Chair Stands’ test, which times
the number of seconds it takes participants sit up and back down in an armless chair,
assesses lower extremity strength in particular. This paints a fragmented picture of
overall physical function, while the PRO measures, administered in their comprehensive
survey form, consolidate all parts of the body and skills that contribute to physical
function and consequently provide a more holistic view of an individual’s physical
functioning ability. This disconnect in the way each type of measurement scale
measures physical function likely contributes to the low degree of correlation between
the two types of measures.
However, the data collection stage of the study also presents ample opportunity
for error on the part of participants and researchers that may have also contributed to
lower correlations. For example, the PRO measure scores are ultimately
patient-reported data, meaning that the possibility of misunderstanding the questions asked in
the survey or biases when reporting answers to questions is high, especially among an
older population. Moreover, there is always a certain degree of subjectivity involved in
“objective” performance-based measures, meaning that the researchers measuring the
outcomes of the PB tests could have possibly misjudged the number of seconds or the
number of steps that a participant took to complete a certain task within each test.
• Do patient-reported measures and performance-based measures respond
equivalently when evaluating the effectiveness of an intervention or treatment?
Aim 2 results found that, in agreement with the original hypothesis, PRO measures
baseline and follow-up for both intervention arms of the WWE program. These results
suggest that, perhaps, PRO measures may be marginally more useful than PB
measures in assessing physical function and evaluating an intervention that attempts to
improve the overall physical functioning of its participants. Further analysis found that
none of the “differences in differences” of scores, among all the physical function
measures, were significant over time for either intervention arm. This provides insight
into the WWE study itself—the physical function measures were effective in measuring
significant differences within each of the intervention arms respectively, but not when
comparing one study arm to the other. Thus, perhaps Arm 1 and Arm 2, or the group
and the independent formats of the study, were both equally effective in improving
physical function of participants over time.
• To what extent do PRO and PB measures associate with other patient-centered
outcomes (fatigue, pain, stiffness) that have been shown to be associated with
physical functioning?
The results of the Spearman’s correlation calculations in Aim 3 showed that key arthritis
outcomes—pain, fatigue, and stiffness—had a stronger negative correlation on average
with PRO measures as opposed to PB measures. Additionally, these correlations for the
PRO measures could be classified as “moderate”. However, interpreting the results of
Aim 3 involves the important assumption that the VAS scale is reliable for measuring
pain, fatigue, and stiffness. In other words, the comparatively stronger correlations
between the PRO measures and VAS versus the PB measures and VAS are dependent
baseline and at follow-up. Furthermore, although this study questions and explores the
validity and reliability of the measures of physical function, this particular research aim
assumes also that both types of measures are valid as well.
However, similar to the concerns in Aim 1, there are multiple sources of error
present in measuring these arthritis outcomes through self-reports. One could even
argue these outcomes are even more subjective than physical function. This raises the
possibility of participants failing to remember or accurately describe the pain they were
experiencing, for example, or incorrectly marking their pain intensity on the 100-mm line
provided on the VAS response form.
IMPLICATIONS
This study promotes the importance of ascertaining the degree of similarity and
overlap between an “objective” method of outcomes measurement (performance-based
measures) and subjective (but still standardized) patient reports. The findings of this
study suggest that:
1. Patient-reported and performance-based measures may be measuring physical
function differently from one another, but
2. Both measures may be equally as effective in assessing an intervention centered
on improving physical functioning, as both measures detect significant changes
in physical functioning over time. Furthermore,
3. Patient-reported measures may be more effective in measuring physical function
This information is important for researchers who are faced with the dilemma of
wanting to choose a standardized outcome measure for evaluating the effectiveness of
an intervention. The advantages of using only PRO measures to assess outcomes are
manifold, and include the fact that they allow patients or participants, whom many feel
know better than anyone else about their own symptoms or outcomes, to report a
personalized perspective on a particular intervention or treatment. However, proponents
of using objective, performance-based measures as the sole metric for measuring
outcomes emphasize the element of standardization, which is important for maintaining
consistency when measuring highly subjective outcomes (such as arthritis outcomes).
For these reasons, perhaps researchers would benefit from incorporating both PRO and
PB measures into interventions. This suggestion brings up new concerns, however; for
example, if both measures produce different results, which measures should be viewed
as the “primary” source that could be used to determine effectiveness of an
intervention? Furthermore, there is a high likelihood that utilizing both measures in a
given study could lead to a high administrative burden when needing to administer PRO
surveys as well as PB tests, including greater expenditures of time and money. On a
case-by-case basis, however, perhaps researchers can mitigate the barriers to using
both types of outcomes measures and ensure that they incorporate standardized,
performance-based metrics into their study to objectively measure outcomes but also
CONCLUSION
The application of PRO measures to the Arthritis Foundation’s Walk With Ease (WWE)
program in order to evaluate outcomes of the is just one example of the many diverse
ways that patient self-reports can be used in incorporating the patient experience into
clinical research as well as healthcare delivery. Patient-reported outcomes research has
the potential to become the new frontier in comparative effectiveness research. This
study examines the importance of using statistically sound measure scales to evaluate
patient reported outcomes measures and hopefully provides support for their validity as
a measurement tool in order to proliferate their use in clinical research and healthcare
delivery. Ideally, in continuing to conduct this type of research, it will be possible to
celebrate PROs as a “gold standard” of HRQOL research and to fully incorporate
REFERENCES
1. Remmers C, Hibbard J, Mosen DM, et al., Is Patient Activation Associated with
Future Health Outcomes and Healthcare Utilization among Patients with Diabetes? J
Ambul Care Manage, 2009;32(4):320-7.
2. Weinstein JN, Clay K, Morgan TS, Informed Patient Choice: Patient-Centered
Valuing of Surgical Risks and Benefits, Health Affairs, 2007;26(30):726-730.
3. National Quality Forum. Patient Reported Outcomes (PROs) in Performance
Measurement, Available at:
http://www.qualityforum.org/WorkArea/linkit.aspx?LinkIdentifier=id&ItemID=72537.
Accessed October 8, 2013.
4. Guillemin F, Briançon S, Pourel J. Validity and discriminant ability of the HAQ
Functional Index in early rheumatoid arthritis. Disabil Rehabil. 1992;14(2):71-77.
5. U.S. Food and Drug Administration, Guidance for Industry, Patient-Reported
Outcome Measures: Use in Medical Product Development to Support Labeling
Claims, Fed Regist. 2009;74(35):65132-133. Available at
http://www.fda.gov/downloads/Drugs/GuidanceComplianceRegulatoryInformation/G
uidances/UCM193282.pdf.
6. Bick D, Slater CH. Quality of Life Research: An International Journal of Quality of
Life Aspects of Treatment, Care and Rehabilitation. JAMA. 1994;271(17):1377-.
7. Bowling, A. (2001). Measuring disease: A review of disease-specific quality of life
measurement scales (2nd ed.). Buckingham, UK: Open University Press.
8. Donabedian A. Evaluating the quality of medical care. 1966. Milbank Q.
9. Chassin MR, O’Kane ME. History of the quality improvement movement. 2011.
March of Dimes.
10. Hostetter M, Klein S. Using Patient-Reported Outcomes to Improve Health Care
Quality, Available at:
http://www.commonwealthfund.org/Newsletters/Quality-Matters/2011/December-January-2012/In-Focus.aspx. Accessed October 2, 2013.
11. Lipscomb J, Reeve BB, Clauser SB, et al. Patient-reported outcomes assessment in
cancer trials: taking stock, moving forward. J Clin Oncol. 2007;25(32):5133-40.
12. Patrick DL, Bergner M. Measurement of health status in the 1990s. Annu Rev Public
Health. 1990;11:165-83.
13. Ader DN. Developing the Patient-Reported Outcomes Measurement Information
System (PROMIS). Medical Care. 2007;45(Suppl 1):S1-S2.
14. Efficace F, Novik A, Vignetti M, Mandelli F, Cleeland CS. Health-related quality of life
and symptom assessment in clinical research of patients with hematologic
malignancies: where are we now and where do we go from here?. Haematologica.
2007;92(12):1596-8.
15. Turner RR, Quittner AL, Parasuraman BM, Kallich JD, Cleeland CS.
Patient-reported outcomes: instrument development and selection issues. Value Health.
2007;10 Suppl 2:S86-93.
16. Carr A. Margaret Holroyd Prize Essay. A patient-centered approach to evaluation
and treatment in rheumatoid arthritis: the development of a clinical tool to measure
patient-perceived handicap. Rheumatology. 35(10):921-932.
17. Her M, Kavanaugh A. Patient-reported outcomes in rheumatoid arthritis. Curr Opin
18. Hung M, Nickisch F, Beals TC, Greene T, Clegg DO, Saltzman CL. J. Leonard
Goldner Award 2012: New Paradigm for Patient-Reported Outcomes Assessment in
Foot & Ankle Research: Computerized Adaptive Testing. Foot Ankle Int.
2012;33(08):621-626.
19. Rose M, Bjorner JB, Becker J, Fries JF, Ware JE. Evaluation of a preliminary
physical function item bank supported the expected advantages of the
Patient-Reported Outcomes Measurement Information System (PROMIS). J Clin Epidemiol.
2008;61(1):17-33.
20. Fries JF. The promise of the future, updated: better outcome tools, greater
relevance, more efficient study, lower research costs. Future Rheumatology.
2006;1(4):415-421.
21. Kraemer HC. To increase power in randomized clinical trials without increasing
sample size. Psychopharmacol. 1991;27(3): 217–224.
22. NIH PROMIS. PROMIS Overview, Available at:
http://www.nihpromis.org/about/overview. Accessed October 8, 2013
23. Callahan LF. Physical Activity Programs for chronic arthritis. Curr Opin Rheumatol
2009; 21(2): 177-82
24. Callahan LF, Shreffler JH, Altpeter M, et al. Evaluation of group and self-directed
formats of the Arthritis Foundation's Walk With Ease Program. Arthritis Care Res
(Hoboken). 2011;63(8):1098-107.
25. Linden WJ, Hambleton RK. Handbook of Modern Item Response Theory. Springer;
26. Sundén A, Ekdahl C, Magnusson SP, Johnsson B, Gyllensten AL. Physical function
and self-efficacy – Important aspects of health-related quality of life in individuals
with hip osteoarthritis. European Journal of Physiotherapy. 2013;15(3):151-159.
27. Alschuler KN, Jensen MP, Goetz MC, Smith AE, Verrall AM, Molton IR. Effects of
pain and fatigue on physical functioning and depression in persons with muscular
APPENDIX A
Table 1. Baseline Demographic Characteristics of Arm 1 and Arm 2 Participants of WWE Program
Continuous Variables Arm 1 - Group (N=192)
Arm 2 - Independent (N=270)
Total
Participants (N=462)
Age in years, MEAN
(SDEV) 70.6 (9.9) 64.4 (11.8) 70.0 (11.5)
BMI (kg/m2), MEAN (SDEV) 29.3(6.4) 30.1 (7.0) 29.7(6.8)
Categorical Variables
Gender (%)
Male 14.6 (N=28) 10.4 (N=28) 12 (N=56)
Female 85.4 (N=164) 89.6 (N=242) 88 (N=406)
Marital Status (%)
Married 47.4 (N=91) 55.2 (N=149) 51.9
(N=240) Separated/Divorced 11.5 (N=22) 14.4 (N=39) 13.2 (N=61) Living w/ Significant
Other 1.6 (N=3) 0.37 (N=1) 0.87 (N=4)
Widowed 31.3 (N=60) 16.7 (N=45) 22.7(N=105)
Single 7.8 (N=15) 13 (N=35) 10.8 (N=50)
Missing Data/Other 0.37 (N=1) 0.52 (N=1) 0.43 (N=2)
Education (%)
<High School 7.3 (N=14) 2.6 (N=7) 4.5 (N=21)
High School 27.6 (N=53) 19.3 (N=52) 22.7 (N=105)
>High School 65.1 (N=125) 78.1 (N=211) 72.7 (N=336)
Race (%)
White 70.3 (N=135) 70.3 (N=190) 70.3 (N=325)
African-American 25.5 (N=49) 25.2 (N=68) 25.3 (N=117)
APPENDIX B
Table 2. Baseline and Follow-up Spearman’s Correlations Between PRO and PB Physical Function Measures+
Single Leg Stance-
Right Leg
Single Leg Stance- Left Leg
2-minute
Step Test
3 Chair
Stands Normal Walk Walk Fast Right Turn Turn Left
BASELINE
HAQ Score -0.2125* -0.2635* -0.3493* 0.3966* -0.3616 -0.4141* 0.2973* 0.3187*
PROMIS Physical Function Score
0.2794* 0.2883* 0.3956* -0.4327* 0.3743* 0.4673* -0.3361* -0.3378*
FOLLOW UP
HAQ Score -0.3038* -0.2946* -0.2964* 0.3917* -0.3395* -0.3527* 0.2737* 0.2882*
PROMIS Physical Function Score
0.3656* 0.3187* 0.3802* -0.4311* 0.4215* 0.4599* -0.3559* -0.3703*
APPENDIX C
Table 3. Significance of Score Differences for each Physical Function Measure in Arm 1 (Group)
PROMIS SCORE
Ha: diff != 0 (Two-‐ tailed)
Ha: diff > 0 (One-‐tailed)
Measure Obs Mean Std. Err. Std. Dev. [95% Conf. Interval]
Test statistic
(T) P-‐Value P-‐Value
PROMIS –
Follow Up 173 44.55491 0.4696376 6.177118 43.62792 45.48191 2.3597 0.0194 0.0097 PROMIS -‐
Baseline 173 43.80173 0.4899929 6.444851 42.83456 44.76891 significant significant
diff 173 0.7531793 0.3191891 4.198277 0.1231473 1.383211
Single Leg Stance -‐ Right
Measure Obs Mean Std. Err. Std. Dev. [95% Conf. Interval]
Test statistic
(T) P-‐Value P-‐Value
Single Leg Step Test- Right Leg–
Follow Up 150 14.02373 0.9308619 11.40068 12.18434 15.86313 2.3209 0.0216 0.0108
Single Leg Step Test- Right Leg—
Baseline 150 12.15507 0.8912397 10.91541 10.39397 13.91617 significant significant
diff 150 1.868667 0.805154 9.861083 0.2776717 3.459662
Single Leg Stance -‐ Left
Measure Obs Mean Std. Err. Std. Dev.
[95%
Conf. Interval]
Test statistic
(T) P-‐Value P-‐Value
Single Leg Step Test- Left Leg— Follow
Single Leg Step Test-‐ Left Leg—
Baseline 155 12.19723 0.9034004 11.24724 10.41257 13.98188 significant
diff 155 1.392839 0.7761517 9.66301 0.1404397 -‐ 2.926117
Two Minute Step Test
Measure Obs Mean Std. Err. Std. Dev. [95% Conf. Interval]
Test statistic
(T) P-‐Value P-‐Value
2-‐Minute Step Test—
Follow Up 148 73.40541 2.198167 26.74186 69.06131 77.7495 -‐0.8744 0.3833 0.8083 2-‐Minute
Step Test—
Baseline 148 74.96622 1.949147 23.7124 71.11425 78.81819
diff 148 -‐1.560811 1.785012 21.71561 -‐5.088411 1.96679
HAQ SCORE
Ha: diff != 0
(two-‐tailed) Ha: diff < 0 (one-‐tailed)
Measure Obs Mean Std. Err. Std. Dev. Conf. [95% Interval] Test statistic
(T) P-‐Value P-‐Value
HAQ Score—
Follow Up 221 10.69702 0.7940376 11.80422 9.132131 12.26192 -‐5.2019 0.0000 0.0000 HAQ
Score—
Baseline 221 13.67535 0.862763 12.82589 11.97501 15.37568 significant significant
diff 221 -‐2.978322 0.5725473 8.511528 -‐4.106701 -‐1.849942
Chair Stand 3
Measure Obs Mean Std. Err. Std. Dev. [95% Conf. Interval]
Test statistic
(T) P-‐Value P-‐Value
3 Chair Stands—
Follow Up 156 8.317949 0.1840877 2.299255 7.954304 8.681593 -‐5.2316 0.0000 0.0000 3 Chair
Baseline
diff 156 -‐1.269872 0.2427307 3.031706 -‐1.749359
-‐
0.7903847
Normal Walk
Measure Obs Mean Std. Err. Std. Dev.
[95%
Conf. Interval]
Test statistic
(T) P-‐Value P-‐Value
Normal Walk—
Follow Up 163 1.170725 0.0181453 0.2316637 1.134893 1.206557 3.9131 0.0001 0.0001 Normal
Walk—
Baseline 163 1.123007 0.0171308 0.2187112 1.089179 1.156835 significant significant
diff 163 0.0477181 0.0121943 0.1556867 0.0236378 0.0717984
Fast Walk
Measure Obs Mean Std. Err. Std. Dev.
[95%
Conf. Interval]
Test statistic
(T) P-‐Value P-‐Value
Fast Walk—
Follow Up 162 1.575313 0.0263947 0.33595 1.523189 1.627438 2.3126 0.0220 0.1101 Fast
Walk—
Baseline 162 1.537001 0.0246118 0.3132577 1.488397 1.585604 significant significant
diff 162 0.0383129 0.016567 0.210863 0.0055963 0.0710295
Turn Left
Measure Obs Mean Std. Err. Std. Dev.
[95%
Conf. Interval]
Test statistic
(T) P-‐Value P-‐Value
Turn Left—
Follow Up 163 2.800276 0.0725317 0.9260228 2.657047 2.943506 -‐4.4063 0.0000 0.0000 Turn
Left—
Baseline 163 3.137638 0.1143963 1.460514 2.911738 3.363538 significant significant
diff 163 -‐0.337362 0.076563 0.9774911 0.4885522 -‐ 0.1861718 -‐
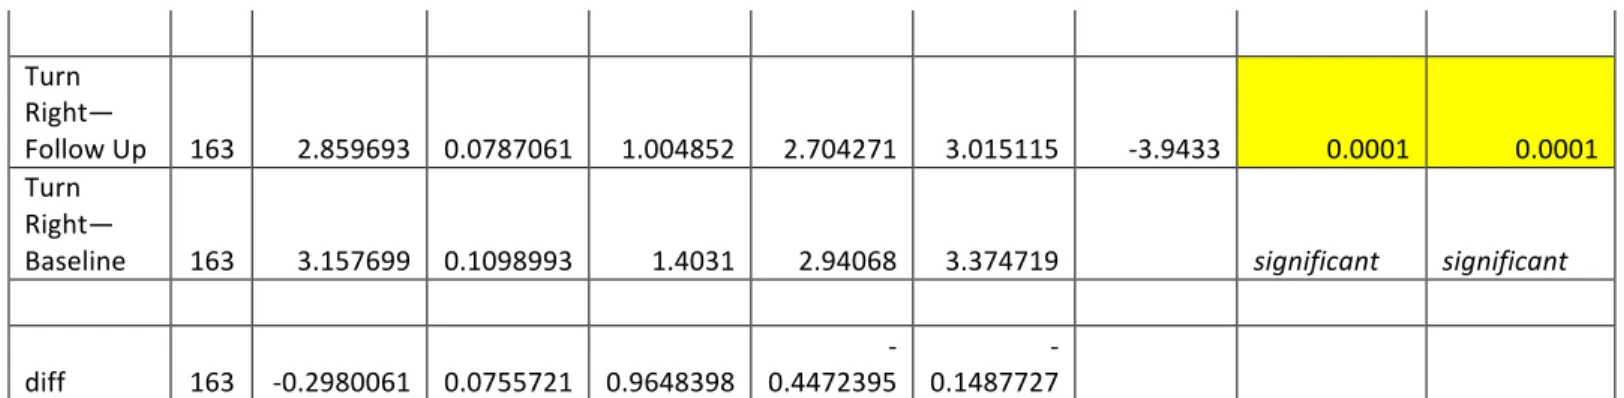
Turn Right
Measure Obs Mean Std. Err. Std. Dev. [95% Conf. Interval]
Test statistic
Turn
Right—
Follow Up 163 2.859693 0.0787061 1.004852 2.704271 3.015115 -‐3.9433 0.0001 0.0001 Turn
Right—
Baseline 163 3.157699 0.1098993 1.4031 2.94068 3.374719 significant significant
diff 163 -‐0.2980061 0.0755721 0.9648398 0.4472395 -‐ 0.1487727 -‐
Table 4. Significance of Score Differences for each Physical Function Measure in Arm 2 (Independent)
PROMIS SCORE
Ha: diff != 0
(two-‐tailed) Ha: diff > 0 (one-‐tailed)
Measure Obs Mean Std. Err. Std. Dev. [95% Conf. Interval]
Test statistic
(T) P-‐Value P-‐Value
PROMIS –
Follow Up 154 43.70974 0.5569432 6.911483 42.60945 44.81003 2.9790 0.0034 0.0017 PROMIS -‐
Baseline 154 42.57143 0.5177404 6.424989 41.54859 43.59427 significant significant
diff 154 1.138312 0.3821168 4.741945 0.3834056 1.893218
Single Leg Stance -‐ Right
Measure Obs Mean Std. Err. Std. Dev. [95% Conf. Interval]
Test statistic
(T) P-‐Value P-‐Value
Single Leg Step Test- Right Leg–
Follow Up 126 11.36151 0.9970573 11.19194 9.388208 13.33481 3.3974 0.0009 0.0005
Single Leg Step Test- Right Leg—
Baseline 126 8.578651 0.8069739 9.058259 6.981549 10.17575 significant significant
diff 126 2.782857 0.8191169 9.194564 1.161723 4.403991
Single Leg Stance