A method for estimating treatment effects in clinical data associated with personalized medicine: a replication study
by
Zimeng Xie
Senior Honors Thesis Department of Biostatistics
University of North Carolina at Chapel Hill
April 6, 2016
Approved by:
Dr. Michael Hudgens, Thesis Advisor
Dr. Jane Monaco, Reader
Introduction
Personalized medicine is a medical model that separates patients into different groups - with med-ical decisions, practices, interventions and/or products being tailored to the individual patient based on their predicted response or risk of disease (1). Owing to advances in the field of genetics and genomics, the medical community is able to gain understanding of various diseases on a molecular level. As a result, the approach of personalized medicine, an innovative approach that takes into account differences in people’s genes, environments and lifestyles, is of great interest to doctors and policymakers alike (2). Numerous governmental agencies, such as National Institutes of Health (NIH) and U.S. Food and Drug Administration (FDA), are actively engaged in research and regulatory activities associated with person-alized medicine: The Human Genome Project and thousands of follow-on studies are helping scientists to develop gene-targeted treatments (2, 3); President Obama launched the Precision Medicine Initiative in January 2015, which also seeks to identify genetically-based drivers of disease in order to develop new, more effective treatments (2). However, the concept of personalized medicine is not limited to genetics and has broadened to encompass various personalization measures, such as differential dosing (4).
Usually, there are large numbers of covariates in datasets associated with personalized medicine. To develop strategies for performing analysis on these datasets, it is critical to identify the interactions between treatment and baseline covariates in randomized clinical trials. One commonly used approach is subgroup analysis, where treatment and control arms are compared in different predefined subgroups, such as male and female subjects. More rigorously, the treatment-covariates interactions can be analyzed in a multivariate regression analysis where the product of the treatment variable and a set of baseline covariates are included in the regression model, as demonstrated by Tianet al. (5).
2
the treatment variable as±1 and fitting the products of the treatment variable and baseline covariates (which essentially are treatment/covariate interaction terms) in a LASSO regression model, a score could be constructed to select a subgroup of patients who may benefit from a specific treatment. Subsequently, the method is applied to the collection of random variables to determine treatment scores for all subjects. Finally, Spearman’s correlation coefficients between treatment scores and treatment effect are calculated to evaluate the performance of the score. A high Spearman’s correlation coefficient suggests that the calculated score is a good predictor of “true” treatment effect, and vice versa.
Methods
In this section, we defineT =±1 as the binary treatment indicator. Y(1) and Y(−1)are defined
as the potential outcome for patients who received treatment T = 1 and −1 respectively. We only observe Y = Y(T), T and Z, a q-dimensional baseline covariate vector. We assume that treatment is
randomly assigned to a patient, which means thatT andZare independent. Furthermore, we letWbe a p-dimensional function of baseline covariatesZ. W(Zi) is denoted as Wi in the rest of this article.
For simplicity, we also assume that P(T = 1) = P(T = −1) = 1/2. Finally, we assume that Y is a continuous response. We examined two different methods in the article authored by Tianet al.: the full regression method and the modified covariate method.
Full Regression Method
When Y is a continuous response, a simple multivariate linear regression model could be con-structed as follows to include interactions between the treatment and the covariates:
Y =β00W(Z) +γ00W(Z)·T /2 + (1)
whereβ00 andγ00 are transposed vectors of coefficients in the linear model andis the mean zero random error. According to Tianet al., the interaction termγ00W(Z)·T models the differential treatment effect
across the population and the linear combination ofγ00W(Z) can be used for identifying potential sub-group(s) of patients who may benefit from the treatment. Since the vectorW(Z) contains an intercept, the main effect for treatment is always included in the model. Specifically, under model (1), we have
∆(z) =E(Y(1)−Y(−1)|Z=z) =γ00W(Z) (2)
With observed data,γ0 can be estimated via the ordinary least squares method.
Modified Covariate Method
Alternatively, we consider the following model with only interaction terms:
Y =γ00W(Z)·T /2 + (3)
whereis random error. That is, we perform a regular linear regression using the product of each component ofWi and one-half the treatment indicator (T = ±1), without including an intercept. The
detailed steps for carrying out this operation is as follows:
1. Transform the covariate
Zi→Wi=W(Zi)→W∗i =Wi·Ti/2 (4)
2. Fit linear regression
Y ∼γ00W∗ (5)
based on modified observations without intercept
(W∗i, Yi) ={(Wi·Ti)/2, Yi}, i= 1,2,· · ·, N. (6)
3. ˆγ0W(z) could be used to stratify patients for individualized treatment selection.
(Refer to Tianet al., Journal of American Statistical Association, December 2014, Volume 109, for more detailed information)
Simulation Studies
In this section, the author performed independent numerical studies with similar data settings to validate the performance of both methods as demonstrated by Tianet al. with continuous responses. For each set of simulation, we generated a training dataset and a validation dataset with sample sizes of N1 = 100 and N2= 300, respectively. For both datasets, we generated independent Gaussian samples
4
Y =
β0+
p
X
j=1
βjZj
2
+ γ0+
p
X
j=1
γjZj+ 0.8Z1Z2
T+σ0·, (7)
where the covariates (Z1, Z2,· · · , Zp) follow a mean zero multivariate normal distribution with a
com-pound symmetric variance-covariance matrix, (1−ρ)Ip+ρ101, and∼N(0,1). We let (γ0, γ1, γ2, γ3, γ4, γ5,
· · ·, γp) = (0.4,0.8,−0.8,0.8,−0.8,0,· · · ,0), σ0=
√
2, N1= 100, and p= 50 and 1000 representing low
and high-dimensional cases, respectively. The treatment was generated as 1 or−1 with equal probability (essentially a transformed Bernoulli random variable). We consider 4 different data settings:
1. β0= (
√
6)−1, β
1=β2= 0, β3=β4=· · ·=β10= (2
√
6)−1, andβ
11=· · ·=βp= 0. ρ= 0.
2. β0= (
√
6)−1, β
1=β2= 0, β3=β4=· · ·=β10= (2
√
6)−1, andβ
11=· · ·=βp= 0. ρ= 1/3.
3. β0= (
√
3)−1, β1=β2= 0, β3=β4=· · ·=β10= (2
√
3)−1, andβ11=· · ·=βp= 0. ρ= 0.
4. β0= (
√
3)−1, β
1=β2= 0, β3=β4=· · ·=β10= (2
√
3)−1, andβ
11=· · ·=βp= 0. ρ= 1/3.
According to Tianet al., settings 1 and 2 represent cases with relatively small main effects, where the variations in responses contributable to the main effect, interaction, and random error were about 37.5%, 37.5%, and 25%, respectively, when the covariates were correlated. Settings 3 and 4 represent cases with relatively large main effects, where the variations in responses contributable to the main effect, interac-tion, and random error were about 75%, 15%, and 10%, respectively, when the covariates were correlated.
For each of the simulated dataset, we applied both the full regression method and the modified covariate method:
• Full regression: we fitted the model specified in formula (1), with complete main effects and
covariate-treatment interaction terms. LASSO was used to select the variables.
• Modified covariate: we fitted the model specified in formula (3), with the modified covariate
W∗= (1,Z)0·T /2. LASSO was also used to select the variables.
∆(z) =E(Y(1)−Y(−1)|Z=z) = 1.6×(0.5 +Z
1−Z2+Z3−Z4+Z1Z2)
in the validation set of size N2 = 300 generated above. Based on 500 sets of simulations for the
low-dimensional case and 200 sets of simulations for the high-low-dimensional case, we plotted the boxplots of the rank correlation coefficients between the estimated scoresˆγ0W(Z) and∆(Z) under all 4 data settings, and compared the boxplots to the boxplots in the Tianet al. article to complete the validation process of their methods.
Results
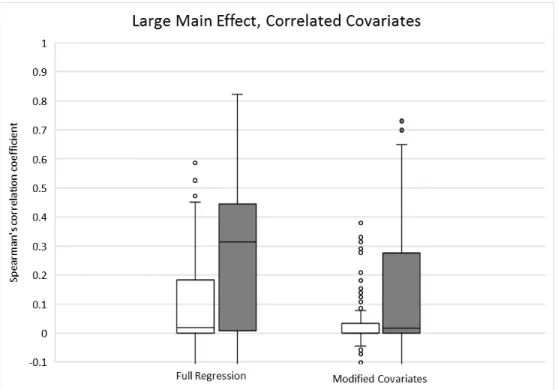
The boxplots of Spearman’s rank correlation coefficients for both methods are as follows. Figures 1, 2, 3 and 4 represents data settings 1, 2, 3 and 4, respectively. Empty boxplots indicate high-dimensional (p= 1000) covariates, whereas filled boxplots indicate low-dimensional (p= 50) covariates.
6
Figure 2: Moderate main effect, correlated covariates. Empty and filled boxplots indicate high- and low-dimensional cases respectively.
Figure 4: Big main effect, correlated covariates. Empty and filled boxplots indicate high- and low-dimensional cases respectively.
Discussion
In the results section, the author examined both methods in Tianet al.’s article, the full regression method and modified covariates method, for estimating treatment effect based on a number of baseline covariates by replicating the numerical studies that they have performed.
For the full regression method, treatments are coded asT =±1 and all baseline covariates and covariate/treatment interaction terms are included in a regular linear model. The article by Tianet al. demonstrated that this method is inferior to the modified covariates method by showing that Spearman’s correlation coefficients between estimated scores and “true” treatment effect under this method are lower than that of modified covariates method. However, using independently generated data, the author was not able to replicate Tianet al.’s results for the full regression method despite careful imitation of their data settings; in fact, the opposite result was achieved (see Figures 1-4). It is clear that additional investigation will be required to fully understand the reason of this contradiction.
8
generated data, the author was able to generate boxplots that are highly similar to those produced by Tianet al for the modified covariates method. Thus, this method is likely to be valid, and it provides a casual but theoretically sound tool to assign different treatments in clinical trials with a personalized medicine approach. However, the superiority of this method could not be replicated.
References
1. Stratified, personalised or P4 medicine: a new direction for placing the patient at the centre of healthcare and health education (Technical report). Academy of Medical Sciences. May 2015. Retrieved 1 Apr 2016.
2. FACT SHEET: President Obama’s Precision Medicine Initiative. The White House. Jan 2015. Retrieved 1 Apr 2016.
3. All About The Human Genome Project (HGP). National Human Genome Research Institute. Oct 2015. Retrieved 1 Apr 2016.
4. French, Benjamin et al. ”Statistical Design of Personalized Medicine Interventions: The Clari-fication of Optimal Anticoagulation through Genetics (COAG) Trial.” Trials 11 (2010): 108. PMC. Web. Retrieved 1 Apr 2016.