Megan M Barker. The Digital Divide at Home: How Computer and Internet Access Impacts 21st Century Learning. A Master’s Paper for the M.S. in L.S degree. April, 2010. 55 pages. Advisor: Sandra Hughes-Hassell.
This study examines how access to computers and the internet at home affects student learning. Teenage students in grades seven through 12 were surveyed about their computer and internet access at home, how they use the technology for school and recreation, and how they think at-home access impacts their academic performance. The students attended after-school programs at four Boys and Girls Clubs in central North Carolina. This study indicates that computer ownership positively affects students’ academic performances. Unfortunately, the digital divide still exists, and minority and low-income students have less access to computers and the internet at home. The study also shows that students spend more time using technology at home for social networking and entertainment than for educational reasons. However, students use a variety of
technologies to access the internet at home, which may explain why they spend more time using technology for recreational purposes.
Headings:
Digital Divide
Use Studies/Computers Use Studies/Internet Young Adults/Minorities
THE DIGITAL DIVIDE AT HOME: HOW COMPUTER AND INTERNET ACCESS IMPACTS 21ST CENTURY LEARNING
by
Megan M Barker
A Master’s paper submitted to the faculty of the School of Information and Library Science of the University of North Carolina at Chapel Hill
in partial fulfillment of the requirements for the degree of Master of Science in
Library Science.
Chapel Hill, North Carolina April 2010
Approved by
Table of Contents
Introduction . . . . . . . Purpose . . . Literature Review . . . The Current Study . . . . . . Findings and Discussion
Age . . . Race . . . Socioeconomic Status . . . Computer Access at Home . . . Internet Access at Home . . . Educational Outcomes . . . Conclusion . . . Study Limitations . . . Bibliography . . . Appendix A . . .
2 4 5 17
Introduction
In 2007, the American Association of School Librarians (AASL) released
Standards for the 21st Century Learner, a document detailing the skill sets all American students should have in order to perform well in school, work, and life. The document focuses on four major 21st Century skills: inquiry, thinking critically, and gaining new knowledge; drawing conclusions, making informed decisions, transferring new
knowledge, and creating new knowledge; sharing knowledge and becoming ethical and productive members of society; and pursuing personal and aesthetic growth (AASL 2007). The Partnership for 21st Century Skills expands upon AASL’s standards, explaining that students need to think critically and make judgments; solve complex, multi-disciplinary, open-ended problems; employ creative and entrepreneurial thinking; communicate and collaborate with people of different cultural, geographic, and language backgrounds; use knowledge, information, and opportunities in innovative ways, and take charge of financial, health, and civic responsibilities (Partnership for 21st Century Skills 2008). These skills will help American students compete in an increasingly competitive global market, and all students must have equitable access to the resources that will help them acquire these skills (AASL 2007; Partnership for 21st Century Learning Skills 2008).
“digital divide” to describe the gap between those who had access to computers and the internet at home and those who did not (Warschauer 2003). Extensive research exists documenting the barriers to equitable access. Socioeconomic status (Celano & Neuman 2008; Clark & Gorski 2002; DeBell & Chapman 2006; Eamon 2004; Horrigan 2008; Kelly & Lewis 2001; Madigan & Goodfellow 2005) is the major underlying determinant for whether or not a household will have access to computers and the internet. Education level, which is closely related to income, is also a strong indicator for home computer ownership (DeBell & Chapman 2006; Kelly & Lewis 2001; Madigan & Goodfellow 2005).
In an attempt to bridge the digital divide, the United States government instituted various programs that provide information and communication technologies to needy populations. The Telecommunications Act of 1996 sought to deregulate the
services for American schools and libraries (Beltran, Das, & Fairlie 2008). In 2004, the United States Department of Education announced the National Education Technology Plan, which advocates for increases in technology training for teachers, e-learning opportunities for students, and access to high-speed internet, digital content, and other integrated data systems (Beltran, Das, & Fairlie 2008). Although these federal programs have been successful in increasing computer and internet access in public schools across America, they have had little impact on increasing access for students at home. In fact, in spite of these programs, low-income households experienced the smallest percentage growth of home computer ownership (Clark & Gorski 2002).
Purpose
An extensive body of research identifies the digital divide as a multi-faceted problem that will be difficult to overcome. The digital divide is especially insidious because it is a cyclical process. Those who have access at home are more likely to gain 21st Century learning skills, go to college, get well-paying careers, and raise children who follow similar paths. Those who do not have access at home have less chances to develop 21st Century learning skills, typically do worse in school, find lower-level jobs, and raise children who face similar challenges. In order to break the cycle of inequitable access, public and school librarians, teachers, administrators, and policymakers must step in to ensure all students have access to these technologies and can use them to build 21st Century learning skills. This study is especially useful because it can easily be replicated by public librarians, educators, and government officials and adapted in ways that will allow these influential people to identify the specific needs of their communities.
The results from this study will not close the digital divide; but they, combined with the resources explored in the literature review, will help generate awareness for a problem that greatly impacts students’ learning. Furthermore, communities and educators can use this survey to gather information about their population and users in order to better meet their technology and information needs.
Literature Review
Internet and Computer Access at Home
In 2006, the international Organisation for Economic Cooperation and
United States maintained its 15th place position behind the top-ranked Netherlands, Denmark, and Norway (OECD 2009).1 Despite gaps in equitable access, assimilation of the internet has spread quickly, taking only nine years to reach a 50 percent penetration rate among American adults. In comparison, cellular phones took 15 years, and color televisions took 18 years to reach half of the United States’ adult population (Horrigan 2007). According to a Pew Internet Project survey in April 2008, 55 percent of American adults had broadband internet at home (Horrigan 2008).
Wireless access is also increasing. Fifty-six percent of adults in the United States report accessing the internet through wireless means, including laptops, cellular phones, and gaming consoles (Horrigan 2009). In 2008, 12 percent of broadband users also had wireless internet access in their homes (Horrigan 2008). A reduction in prices has influenced the penetration of high-speed internet. In 2008, users reported that the average cost of broadband per month was $34.50, digital subscriber line (DSL) was $31.50, and cable internet was $37.50 (Horrigan 2008). These prices represented a four percent drop since 2005.
Despite the increasing percentage of broadband and wireless users, disparities in internet service quality still remain. Dial-up internet continues to be the most
cost-efficient form of internet access, costing only $19.70 per month in 2008 (Horrigan 2008). Although only 10 percent of Americans still use dial-up to connect to the internet, 35 percent of those users believe broadband’s high prices make it impossible to upgrade. Furthermore, 10 percent of dial-up users, many of them in rural America, reported that high-speed internet access was not available in their communities (Horrigan 2008).
Although information on internet access at home is more prevalent than home computer access, research (Clark & Gorski 2002) suggests that access to computers at home closely mirrors access to the internet at home. In 2003, it was estimated that approximately one quarter of children in the United States did not have home access to computers. The number was highest among adolescents age 16 to 18. Twenty percent of those children did not have access to a computer at home (Beltran, Das, & Fairlie 2008).
Pelham, Crabtree, and Nyiri (2009) analyzed data from the Programme for International Student Assessment (PISA), an international standardized test, and found that computer ownership was a unique predictor of educational attainment. Typically, countries with high computer ownership and high gross domestic products (GDP) rank among the top scores. The United States is an interesting exception to this rule. Though the country has a relatively high rate of computer ownership and a substantial GDP, the United States does not score well on the test. Pelham, Crabtree, and Nyiri (2009) argue that the large discrepancies between those who have access and those who do not in the United States severely impact the country’s scores. On average, scores of students from high-income homes compete with the highest scores around the world, but American students from low-income homes perform poorly on the PISA exam.
Barriers to Access
the past decade, penetration rates for rural communities typically fall 10 percentage points behind the rates in more densely populated areas (Rainie, Bell, & Reddy 2004). Rural users also have reduced choices in the types of information and communication technology services available to them. Private telecommunications companies control the internet services market, and they are not obligated to provide high-speed internet to everyone, and those in rural and disadvantaged communities often cannot afford high-speed access (Kelly & Lewis 2001). Also, the costs for building and maintaining the infrastructure necessary to support high-speed internet, especially the ultra-fast cable internet, is extremely high, especially in rural areas where signals are low and the target population is small (Madigan & Goodfellow 2005). Thus, rural residents find themselves with few options regarding quality of access and connection speed (Rainie, Bell, & Reddy 2004).
Age, race, and education level also affect access to computers and the internet at home. In 2005, only 26 percent of Americans over the age of 65 used the internet at home, compared to 84 percent of Americans between ages 18 and 29 (Fox 2005). Large discrepancies also exist along racial boundaries. DeBell and Chapman (2006) found that 46 percent of African American students and 48 percent of Latino students used
Bell, & Reddy 2004; Spooner 2003). Americans with higher education levels also typically have better access to information and communication technologies at home. As a result, students whose parents are well-educated are more likely to have quality access at home (DeBell & Chapman 2006; Madigan & Goodfellow 2005; Spooner 2003).
The most important factor underlying home access to computers and the internet is household socioeconomic status (Celano & Neuman 2008; Clark & Gorski 2002; DeBell & Chapman 2006; Eamon 2004; Horrigan 2008; Kafai & Sutton 1999; Kelly & Lewis 2001; Madigan & Goodfellow 2005; Rainie, Bell, & Reddy 2004; Spooner 2003). DeBell and Chapman (2006) found that 20 percent of students access computers or the internet from only one location, be it home, school, work, the public library, or
elsewhere. Of those students, 60 percent of the youth in low-income households only had access at school (DeBell & Chapman 2006). Whereas 88 percent of students living in households with incomes exceeding $75,000 used computers at home, only 37 percent of students living in households reporting incomes of less than $20,000 had access to computers at home (DeBell & Chapman 2006). In a 2002 National Telecommunications and Information Administration (NTIA) survey, 15 percent of adolescents living in households with the lowest incomes reported not using computers. In contrast, only three percent of adolescents living in households with the highest incomes did not use
computers (NTIA 2002). Eamon (2004) found that less than 56 percent of poor adolescents had computers at home, while over 87 percent of non-poor adolescents owned computers. Of the 29 percent of Americans who do not have access to the internet at home, 25 percent report incomes below $20,000 a year. Although broadband
households dropped from 28 percent in March 2007 to 25 percent in April 2008 (Horrigan 2008).
Even when poor children have access to computers and the internet, they use them differently (Celano & Neuman 2008; DeBell & Chapman 2006; Kafai & Sutton 1999; Kupperman & Fishman 2001/2002; Malamud & Pop-Eleches 2008; Selwyn, Potter, & Cranmer 2009). In comparing how poor and non-poor youth utilized public libraries in the summer, Celano and Neuman (2008) found significant differences in the resources the children used. Although poor children used as many print and online resources as their wealthier counterparts, they tended to prefer resources with more graphics and lower reading levels. While the non-poor children used the computers and internet mainly for educational activities, poor youth tended to favor chasing games and other
entertainment resources. On average, middle income students spent 27 minutes per library visit on educational programs and one minute on entertainment, whereas poor students spent 11 minutes on educational programs and 13 minutes on entertainment (Celano & Neuman 2008).
educational software and up-to-date computer hardware for their children (Attewell & Battle 1999).
Economically disadvantaged students suffer even when they are at school. Although recent federal reforms have brought computers and internet access to the majority of American schools, only 39 percent of schools in low-income areas had internet connections in the classroom (Madigan & Goodfellow 2005). Furthermore, low-income schools have a higher student-to-computer ratio than middle- and upper-low-income schools. In 2000, the National Center for Education Statistics found that schools with the highest concentration of poor students had one computer for every 16 students, whereas schools with the lowest concentration of poor students had one computer for every seven students (as cited in Madigan & Goodfellow 2005). To make matters worse, students who are least likely to have access to computers and the internet at home are also least likely to have access to them at school (Clark & Gorski 2002). Teachers at low-income schools typically have less experience with computers and the internet, and therefore fail to incorporate the technologies into their classrooms in meaningful and effective ways (Clark & Gorski 2002). These teachers tend to rely more on skill drills, productivity software like Microsoft Word and Excel, and online worksheets, whereas teachers in higher-income schools utilize the technology for research, encouraging individual students’ interests, and developing creative, authentic lessons (National Center for Education Statistics 2001).
require students to complete homework outside of school using computers and the internet, students without these resources do increasingly poorly (Clark & Gorski 2002). Education and income level are so intricately intertwined it is difficult to see which causes the other, and limited access at home and at school, technologically inexperienced teachers, and an increasing dependence on at-home access to technology for success in school only compounds the problem.
Educational Outcomes
Researchers debate the educational benefits of computers and the internet at home (Eamon 2004; Giacquinta, Bauer, & Levin 1993; Kafai & Sutton 1999; Malamud & Pop-Eleches 2008; Mouza 2008; Pelham, Crabtree, & Nyiri 2009). In their studies of families who recently acquired a home computer, Giacquinta, Bauer, and Levin (1993) found that children preferred to use computers for games and other recreational uses and only used them for educational purposes when their parents were heavily involved. Eamon (2004) studied how poor and non-poor students used computers and the internet, and she also discovered that students, regardless of economic status, tended to use computers and the internet for recreational activities. However, she determined that African American and Latino students were more likely to use their computers for academic purposes than white students. This statistic remained significant even when she controlled for external factors like income status.
costs of a new computer. To qualify, households had to have at least one school- or university-aged child and be in a certain income bracket. The Ministry of Education, which was in charge of distributing the vouchers, reported that 94 percent of them had been used to purchase a computer during the first year of the program.
Although a large portion of Romania’s poorest children received access to a computer at home through Euro 200, Malamud and Pop-Eleches (2006) did not find the program to be successful. Though the computers led to less time in front of the television, the students also spent less time doing schoolwork. Furthermore, students who received the computers reported having lower grades in school and lower educational ambitions than those who did not receive the computers. Because educational software is expensive, the Ministry of Education developed math, science, geography, computer science, and history programs that could be installed on the computers. The parents only had to request the software at the time they cashed in the vouchers, and the salespeople at the retail stores would install the free programs. However, very few parents requested the software, decreasing the likelihood that their children would use the computers for educational purposes. Although the majority of Malamud and Pop-Eleches’ (2006) findings were negative, they did find that parental support and supervision mitigated any poor behaviors associated with having the computers.
Martin 2003; Mouza 2008; Senator George J. Mitchell Scholarship Research Institute [Mitchell Institute] 2004).
Attewell and Battle (1999) analyzed the National Educational Longitudinal Study of 1988 and found a positive relationship between home computer use and eighth
graders’ test scores and classroom grades. Although students in their study did report using computers and the internet for gaming, chatting, emailing, and other non-educational activities, Beltran, Das, and Fairlie (2008) found that students used their home computers for schoolwork and other educational activities much more often. These results led the authors to conclude that the concerns over students’ use of home
computers for strictly non-educational purposes were exaggerated (Beltran, Das, & Fairlie 2008). Seventy-five percent of students surveyed by Eamon (2004) agreed that owning a computer was critically important for success in school and life, and 80 percent of those students believed good computer skills and experience with technology were necessary for finding well-paying jobs in the future. Parents also concurred about the advantages of having a computer and learning technology skills. Ninety percent of parents who took part in a study conducted by Turow and Nir (2000) indicated that accessing and using computers and the internet helped their children with their
schoolwork, and 75 percent of parents agreed that students without access to information and communication technologies at home were at an educational disadvantage.
Conclusion
Telecommunications Act of 1996 and the E-Rate Program have been largely successful in minimizing the gap in public schools, but inequalities still exist. Low-income schools continue to suffer from inconsistent internet access, high student-to-computer ratios, and technologically inexperienced teachers. Furthermore, low-income and poorly educated parents are less likely to support their children’s continuing information and
communication technology education at home due to heavy work schedules, family obligations, and lack of experience with technology.
Teachers, especially those with access to computers and the internet at home, must be mindful of their students’ at-home access. 21st
Century skills must be taught regardless of whether or not students have access at home, but teachers must give students time to complete the assignments in school. Structuring lessons this way allows teachers and library media specialists to provide support and scaffolding to struggling students, and it ensures all students have equitable access to the resources offered in the schools. Teachers and school library media specialists must receive extensive training on how to use technology effectively and how to integrate it into the classroom. Proper teacher preparation and thoughtful, authentic assignments will minimize the
discrepancies between those who have access at home and those who do not.
The Current Study
The research questions that guided this study were:
1. What type of physical access do students have to computers and the internet in their homes?
2. What factors affect students’ access to these technologies at home?
3. How do students use these technologies for school, work, and entertainment? 4. Do students feel access to these technologies impacts their success in school?
Research Sites
This study took place at four Boys and Girls Clubs of America locations in central North Carolina. The Clubs provide afterschool and Saturday activities for children and teenagers, particularly those in poor, urban neighborhoods. In 2008, 65 percent of Boys and Girls Clubs members in the United States were minorities, and 33 percent of its members were teenagers between the ages of 13 and 18 (Boys and Girls Clubs of America 2010). Three of the Clubs served diverse urban communities. These
communities were between 58.7 and 80.8 percent African American, and the median household incomes ranged from $16,616 to $37,505 (U.S. Census Bureau 2000). The fourth club served a suburban middle class community that was 84.4 percent white with a median household income of $56,832 (U.S. Census Bureau 2000).
the number of teenagers served, recommendations from the counties’ Club coordinators, and the willingness of individual Club supervisors to participate in the research.
Participants were teenage students in grades seven through 12 who attended the four Boys and Girls Clubs after school between March 2 and March 17, 2010. Students were not penalized if they did not wish to participate, but those who did volunteer received candy. Although the study was particularly interested in students from minority and lower socioeconomic households, any willing student over the age of 14 was allowed to participate.
Survey Design
Quantitative data for the study were collected through anonymous surveys that were distributed at the students’ Clubs after school. The survey, found in Appendix A, was based on studies that examined how access to information and communication technologies at home impacts student learning and the barriers to access that some students, especially those is low socioeconomic households, faced (Celano & Neuman 2008; DeBell & Chapman 2006; Eamon 2004; Kafai & Sutton 1999; Kupperman & Fishman 2001/2002; Malamud & Pop-Eleches 2008; Rainie, Bell, & Reddy 2004; Selwyn, Potter, & Cranmer 2009; Spooner 2003).
parents’ or guardians’ highest level of education. According to research, education level directly correlates with a household’s socioeconomic status (U.S. Census Bureau 2007). Thus, one’s education level is a strong predictor for computer ownership (DeBell & Chapman 2006; Kelly & Lewis 2001; Madigan & Goodfellow 2005).
Data Analysis
After the surveys were administered and collected, each completed survey was assigned a number before it was analyzed in order to ensure more accurate data entry and facilitate analysis of individual surveys when necessary. The numbers were not
associated with individual students or their Clubs. The responses were then entered into SAS’s JMP 8.0 software. However, since the subject pool was so small and homogenous, the software was unable to process correlations between variables. Therefore, the results were also entered into an Excel spreadsheet, where relationships between students’ race and parent/guardian’s education level and students’ grades, self-perceived information skills, and uses of technology could be explored in more detail.
Findings and Discussion
uncomfortable answering or did not know the answer to, so some questions were not answered by all 69 participants.
Age
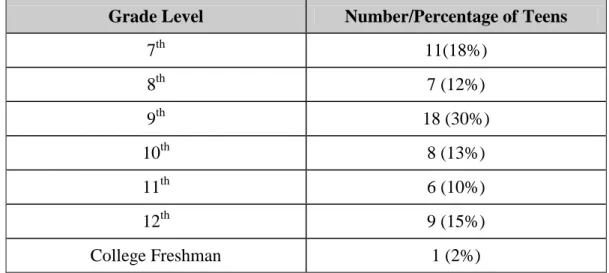
In order to understand if students’ ages impacted their uses of technology at home or their opinions about at-home access, the participants were asked to fill in their grade level. The grade level question was one of the five questions printed on the back of the survey, and only 60 teenagers responded to it. The majority (68 percent) of participants attended high school, or grades nine through 12. Of the remaining students, 30 percent were in middle school, and one teenager was a freshman in college (Table 1).
Grade Level Number/Percentage of Teens
7th 11(18%)
8th 7 (12%)
9th 18 (30%)
10th 8 (13%)
11th 6 (10%)
12th 9 (15%)
College Freshman 1 (2%)
Table 1: Grade Level Breakdown of Participants (n=60)
Race
“multiracial.” The heavily skewed racial breakdown of the participants was not surprising because the Boys and Girls Clubs mainly serve urban youth. Because of the lack of diversity in the sample, correlations between race and at-home access to computers and the internet would be weak. However, the results are still valuable, especially for educators, librarians, and officials working with urban and minority communities.
Table 2: Racial Breakdown of Participants (n=68)
Socioeconomic Status Research indicates that at-home access to computers and the internet is
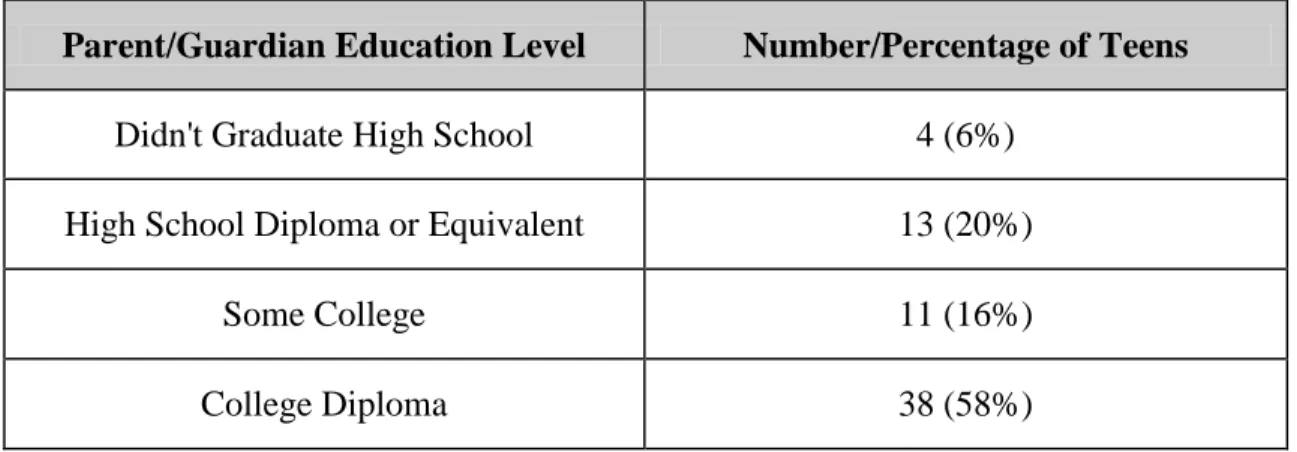
consistently divided along socioeconomic lines (Celano & Neuman 2008; Clark & Gorski 2002; DeBell & Chapman 2006; Eamon 2004; Horrigan 2008; Kelly & Lewis 2001; Madigan & Goodfellow 2005). Education level strongly correlates with household income (U.S. Census Bureau 2007), so the participants were asked to specify their parents’ or guardians’ highest level of education (Table 3). Education level was used as a substitute for actual household income because students were more likely to know their parents’ or guardians’ education levels than their incomes.
Only three teenagers left this question blank, and one of those wrote in that she did not know her parents’ highest education level. Some students selected more than one answer for this question because their mothers and fathers had different levels of
Race Number/Percentage of Teens
Black/African American 48 (71%)
White/Caucasian 9 (13%)
Latino/Hispanic 1 (1%)
education. In these cases, the highest level of education was counted. As Table 3 shows, of the 66 teenagers who responded to this question, over 50 percent of their parents or guardians had completed college. Such a high rate of college graduation suggests that the majority of students in this study lived in middle- to upper-income households. Although three of the four Boys and Girls Clubs used in this study served urban minority teenagers, it appears that the majority of the teenagers who completed the survey were not from low-income households, which were the households targeted for this study. The unexpectedly high household income level of the students explains the high rate of computer ownership, quality internet service, and access to the internet through alternate devices that will be explained in the following sections.
Parent/Guardian Education Level Number/Percentage of Teens
Didn't Graduate High School 4 (6%)
High School Diploma or Equivalent 13 (20%)
Some College 11 (16%)
College Diploma 38 (58%)
Table 3: Parent/Guardians’ Highest Level of Education (n=66)
E
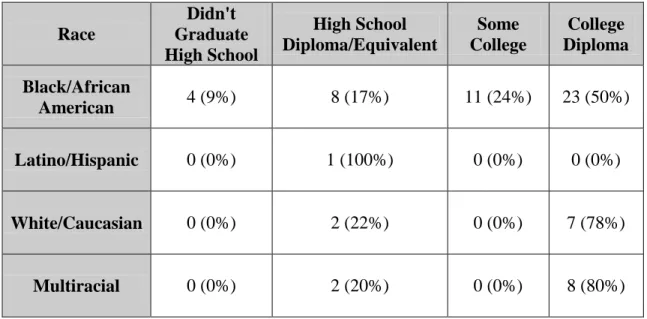
ven though the percentage of students who lived in middle to upper incomehouseholds was high across races, there was a correlation between race and
students’ parents or guardians had a college diploma, and 80 percent of multiracial students’ parents or guardians had a college degree. Therefore, white and multiracial students were 25 percent more likely to live in higher income homes than their African American peers.
Race
Didn't Graduate High School
High School Diploma/Equivalent
Some College
College Diploma
Black/African
American 4 (9%) 8 (17%) 11 (24%) 23 (50%)
Latino/Hispanic 0 (0%) 1 (100%) 0 (0%) 0 (0%)
White/Caucasian 0 (0%) 2 (22%) 0 (0%) 7 (78%)
Multiracial 0 (0%) 2 (20%) 0 (0%) 8 (80%)
Table 4: Parent/Guardian Education Level by Race (n=66)
Computer Access at Home
computer access, African Americans were also the only race in this study to report not having a computer at home.
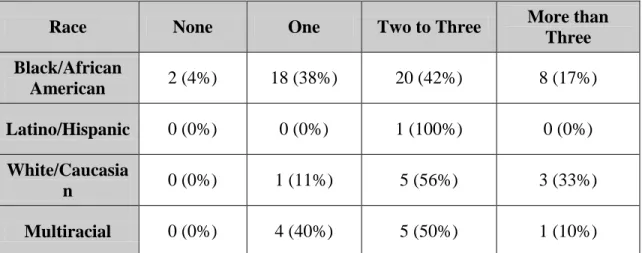
Although many of the teenagers surveyed had access to computers at home, more significant gaps emerged in the number of computers teenagers had available to them. Whereas 89 percent of white participants reported having two or more computers at home, only 58 percent of African American students and 60 percent of multiracial students had more than two computers (Table 5).
Table 5: Number of Computers at Home by Race (n=68)
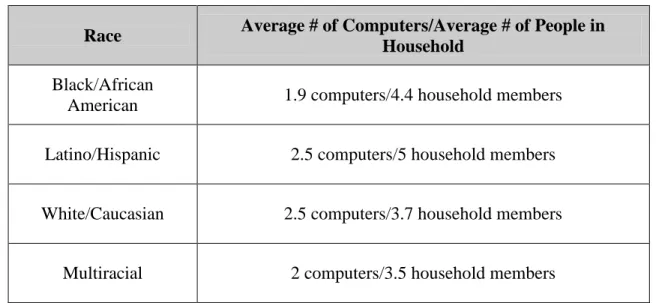
On average, African American students had to share fewer computers among more family members than the other racial groups. Forty-two percent of African American students had one or no computer at home, and 64 percent of those students lived in households with more than four people. Only one white student (11 percent) had a single computer at home and lived in a household with four or more people. Whereas white students had approximately one computer for every 1.5 people in their homes, African American students had approximately one computer for every 2.3 people in their homes (Table 6). Just because a student had access to computers at home does not mean
Race None One Two to Three More than
Three
Black/African
American 2 (4%) 18 (38%) 20 (42%) 8 (17%)
Latino/Hispanic 0 (0%) 0 (0%) 1 (100%) 0 (0%)
White/Caucasia
n 0 (0%) 1 (11%) 5 (56%) 3 (33%)
that access was always easy or readily available. When students had to vie for computer time with other household members, it could make it difficult for them to use technology for schoolwork, and this data shows that African American students were more likely to have limited access to computers at home.
Race Average # of Computers/Average # of People in
Household
Black/African
American 1.9 computers/4.4 household members Latino/Hispanic 2.5 computers/5 household members
White/Caucasian 2.5 computers/3.7 household members
Multiracial 2 computers/3.5 household members
Table 6: Average Number of Computers per Person in Household by Race2
While race clearly affected students’ access to computers at home, research indicates that socioeconomic status is the most significant predictor for computer ownership(Celano & Neuman 2008; Clark & Gorski 2002; DeBell & Chapman 2006; Eamon 2004; Horrigan 2008; Kafai & Sutton 1999; Kelly & Lewis 2001; Madigan & Goodfellow 2005; Rainie, Bell, & Reddy 2004; Spooner 2003). The results from this study also suggested that students’ household socioeconomic status influenced the number of computers they had at home (Table 7). Fifty-six percent of students whose
2
parents or guardians did not graduate from high school or who just had a high school diploma had one or no computer at home. On the other hand, only 21 percent of students whose parents or guardians had a college diploma had access to only one computer at home. As a result, students who lived in lower income homes were twice as likely to have less access to computers at home than their wealthier peers.
Education Level Zero One Two to Three More than
Three
Didn't Graduate
High School 0 (0%) 3 (75%) 0 (0%) 1 (25%)
High School
Diploma/Equivalent 1 (8%) 5 (38%) 5 (38%) 2 (15%)
Some College 1 (9%) 5 (45%) 4 (36%) 1 (9%)
College Diploma 0 (0%) 8 (17%) 22 (46%) 8 (17%)
Table 7: Number of Computers at Home by Parent/Guardian Education Level
household members. Therefore, students whose parents or guardians were better educated, and thus had a higher income, had easier access to computers at home.
Parent/Guardian Education Level
Average # of Computers at Home/ Average # of Family Members
Didn't Graduate High School 1.5 computers/5 household members
High School Diploma/Equivalent 1.6 computers/3.8 household members
Some College 1.6 computers/5.5 household members
College Diploma 2.3 computers/3.8 household members
Table 8: Average Number of Computers per Person in Household by Parent/Guardian Education Level
Internet Access at Home
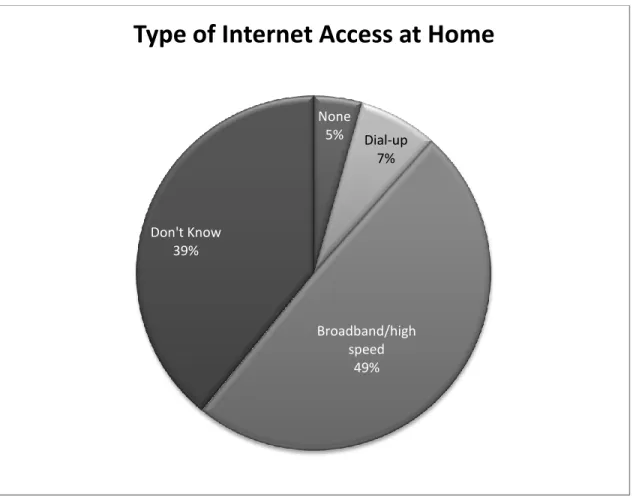
In April 2008, a Pew Internet and Family Life Project survey found that 55 percent of American adults had internet access at home (Horrigan 2008). The survey results from this study follow a similar pattern to the Pew study (Figure 1). The majority (56 percent) of teenagers surveyed reported having some type of internet access at home, but 39 percent of students did not know what type of internet access they had at home.
Figure 1: Types of Internet Access at Home (n=69)
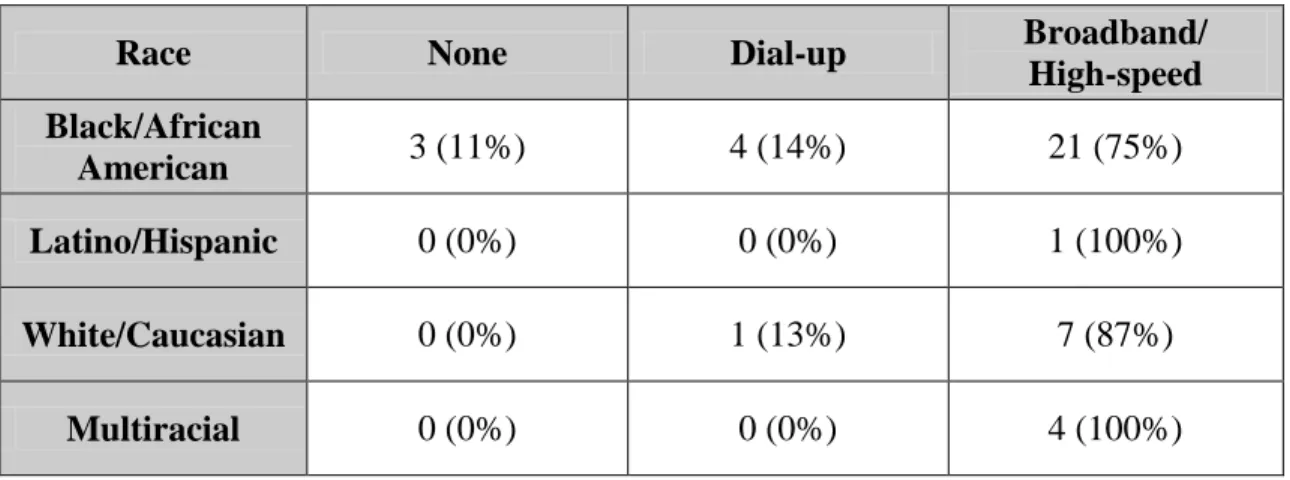
broadband or high-speed internet services at home (Table 9). Conversely, 89 percent of white students knew what type of internet connection they had at home, and 88 percent of those students had broadband or high-speed internet service. Fortunately, the percentage of students who had at-home access to the highest quality of internet service,
broadband/high-speed, was consistently high across races. However, a quarter of African American students had either no internet at home or used dial-up services, so they had little or no at-home access to high-quality internet connections.
None
5% Dial-up
7%
Broadband/high speed
49% Don't Know
39%
Race None Dial-up Broadband/ High-speed
Black/African
American 3 (11%) 4 (14%) 21 (75%)
Latino/Hispanic 0 (0%) 0 (0%) 1 (100%)
White/Caucasian 0 (0%) 1 (13%) 7 (87%)
Multiracial 0 (0%) 0 (0%) 4 (100%)
Table 9: Internet Services at Home by Race
In 2008, average broadband internet services cost $34.50 a month, and dial-up service cost $19.70 a month (Horrigan 2008). Since there was almost a $15-a-month difference in price, it was not surprising that socioeconomic status impacted students’ internet connections at home (Table 10). Once again, 80 percent of the students who knew what type of internet they had at home reported having broadband or high-speed internet. However, the rate of access to broadband and high-speed internet increased with the students’ parent or guardian’s education level. Sixty-seven percent of students whose parents or guardians had a high school diploma or equivalent had access to broadband or high-speed internet. Seventy-five percent of students whose parents or guardians had some college experience had access to broadband or high-speed internet, and 86 percent of students whose parents or guardians had a college degree had access to broadband or high-speed services.
Parent/Guardian
Education level None Dial-up
Broadband/ High-speed
Didn't Graduate High
School 0 (0%) 0 (0%) 2 (100%)
High School Graduate/ Equivalent
2 (22%) 1 (11%) 6 (67%)
Some College 1 (13%) 1 (13%) 6 (75%)
College Diploma 0 (0%) 3 (14%) 19 (86%)
Table 10: Type of Internet Connection at Home by Parent/Guardian Education Level
services than white students; and, according to Table 6, they also had fewer computers at home per household member. Likewise, students in lower income households generally had less access to broadband or high-speed internet and fewer computers at home per household member than middle and upper income students (Table 10 and Table 8). As a result, minority and lower income students had less access to technology at home to use for schoolwork.
access, she only had one computer at home that she shared with one to three people, and she did not use alternative technologies like cell phones to connect to the internet.
Figure 2: Ease of Access to Computers and/or the Internet at Home (n=61)
The availability of alternative technologies like cell phones, game systems, iPods, and iTouches likely contributed to the students’ access to technology at home. These devices allowed students to connect to the internet at home without having to have access to a computer or high-quality internet services. Over 90 percent of the students surveyed used at least one non-computer device to access the internet at home (Figure 3). As a result, even students who had no computer or only one computer had little trouble accessing the internet at home due to alternative technologies.
Very Hard 2%
Not a Problem 29%
Easy 20% Very Easy
49%
Figure 3: Devices Other Than Computers that Students Use to Access the Internet at Home
Although the overwhelming majority of students reported that they used these alternative technologies, socioeconomic status still affected access to them. As of March 2010, Verizon Wireless, Sprint, and AT&T charged a minimum of $30 a month for Blackberry users to access the internet with their cell phones (AT&T 2010; Sprint 2010; Verizon Wireless 2010). That price was in addition to the pricing plans for talking and text messaging. Game systems were also a popular way for students to access the internet, but they were costly as well. Microsoft’s Xbox 360 started at $199.99, with some models costing as much as $399.99, and Nintendo’s Wii console cost between $199.99 and $328.99. (Best Buy 2010). Considering how expensive cell phone data plans and game systems were, it made sense that students in lower income households would have less access to those technologies. Eighty-three percent of students whose parents or
0 10 20 30 40 50 60
Cell Phone Game System Other None
guardians had a high school diploma used at least one alternative technology to access the internet at home, while 97 percent of students whose parents or guardians had a college diploma had access to at least one alternative technology (Table 11).
Parent/Guardian Education
Level None One Two Three
Didn't Graduate High School 0 (0%) 2 (100%) 0 (0%) 0 (0%)
High School Diploma/Equivalent 2 (17%) 4 (33%) 6 (50%) 0 (0%)
Some College 1 (9%) 5 (45%) 4 (36%) 1 (9%)
College Diploma 1 (3%) 22 (65%) 11 (32%) 0 (0%)
Table 11: Number of Devices Students Use to Access the Internet by Parent/Guardian Education Level
Educational Outcomes
Figure 4: Teens’ Self-perceived Skills with Computers and the Internet (n=68 for computers, n=67 for internet)
Though most students considered themselves skilled with computers and the internet, white students were more likely to classify their skills as advanced. Sixty-seven percent of white students thought their computer skills were advanced, while only 39 percent of African American students and 40 percent of multiracial students selected the highest skill level.
Socioeconomic status did not yield consistent results in predicting computers skills. Since higher income students had more access to computers and high-quality internet services at home, it would make sense that they would rate their skills higher. However, that was not the case. Fifty percent of students whose parents or guardians did not graduate from high school rated their computer skills as advanced, and 46 percent of students whose parents or guardians had a high school diploma thought their computer
0 5 10 15 20 25 30 35 40
poor average advanced
Computer and Internet Skills
Computers
skills were advanced. Fifty-one percent of students whose parents or guardians had a college diploma thought their computer skills were advanced. Although more students who lived in higher income household rated their computer skills higher, the percentage was insignificant. In fact, two of the three students who rated their computer skills as poor had parents or guardians with college diplomas. All of the teenagers who rated their computer and internet skills as poor only had one computer in their homes, and two of them had either no internet service or dial-up service. Therefore, the lack of computers or quality internet service at home seemed to contribute to the students’ perceived lack of skills more than their race or socioeconomic status.
Judging one’s computer and internet skills is highly subjective, which likely led to the inconsistent results in this portion of the study. As a result, it is difficult to draw a strong correlation between race, socioeconomic status, computer ownership, and skill level. However, there is certainly evidence those students who have no or limited access to computers and the internet at home may not develop their information skills at the same speed or to the same proficiency as their peers who have better at-home access.
Figure 5: Perceived Value of At-Home Access Computers and/or the Internet to School Performance (n=69)
Even though the students in this study believed computer and internet access at home positively impacted their education, some parents, educators, and researchers have expressed concerns about how students use technology at home. In their research, Giacquinta et al (1993); Eamon (2004); and Malamud and Pop-Eleches (2008), found that students, especially those from lower income households, were more likely to use computers and the internet at home for recreational and entertainment purposes than for academic purposes. In order to explore how students used computers and technology, participants were asked to estimate how often they used technology at home for
educational, social networking, and entertainment purposes (Figure 6). Sixty-eight
Computer 7%
Internet 7%
Both 73% Neither
13%
teenagers provided estimates for how many hours per day they used computers or the internet at home for schoolwork: 26 percent never used technology for homework, 56 percent used technology one to two hours per day for homework, and 18 percent used technology three or more hours a day for homework.
Figure 6: Average Usage and Time Spent Using Computers or the Internet at Home per Day
Not surprisingly, social networking, including Facebook, MySpace, and similar sites, was a popular activity for teenagers surveyed. Sixty-nine students responded about their social networking activities: nine percent of teenagers reported that they never used technology at home for social networking, 51 percent used technology one to two hours per day for social networking, and 41 percent used technology three or more hours a day for social networking. Students also commonly used computers and the internet at home for entertainment purposes, including watching movies, playing games, and surfing the web. Once again, 69 students reported how often they used technology at home for
0 5 10 15 20 25 30 35 40 45
Homework (n=68) Social Networking (n=69) Entertainment (n=69)
Average Time Spent Using
Computers/Internet at Home per Day
entertainment purposes: four percent never used technology for entertainment, 61 percent used technology one to two hours per day for entertainment, and 35 percent used
technology three or more hours a day for entertainment.
Although students were 50 percent more likely to never use computers or the internet at home for schoolwork than for social networking or entertainment, the differences decreased dramatically in the one-to-two-hour and three-or-more-hour brackets. The fact that students used a variety of technologies to access the internet at home might explain why they were much less likely to use technology at home for schoolwork than for the other two activities. For example, one of the two students who reported not having a computer used his cell phone to access the internet at home. As a result, he spent only one to two hours a day using technology at home for schoolwork, but he spent more than three hours a day using his cell phone for social networking and entertainment purposes. As Figure 3 shows, over 90 percent of students used cell phones, game systems like the Nintendo Wii, and iPod Touches to access the internet at home. Considering these devices were not designed for academic use, it is not surprising that teenagers spend more time online talking to friends and watching videos than writing papers and doing research. After all, it is difficult to browse electronic databases and write history reports on a Blackberry.
supposed to choose only one set of average grades, many selected more; for example, a student might have checked both “mostly B’s” and “mostly A’s.” For that reason, only the responses from students who selected one answer were used whencomparing students’ grades to their access to and usage of computers and the internet at home.
How students used computers and the internet at home, and how often they used those technologies for various activities, did impact their academic performances. The more time students spent using technology at home for schoolwork purposes, the more they reported making A’s or B’s in school (Table 12). Although it was true that students’ grades were indirectly correlated with their time spent using technology at home for social networking and entertainment, this correlation was not very strong. Seventy-two percent of students reported making A’s or B’s regardless of how many hours per day they used technology at home for schoolwork, social networking, or entertainment. Beltran, Dasi, and Fairlie (2008) found that the concerns that technology at home negatively influenced students’ school performances were largely exaggerated. The results from this study likewise indicate that the amount of time students spend using technology at home for recreational purposes does not severly impact their academic performances.
Time Spent per Day Homework Social Networking Entertainment
Zero Hours 9 (60%) 3 (100%) 1 (100%)
One to Two Hours 20 (74%) 20 (74%) 23 (72%)
Three or More
Hours 6 (86%) 13 (65%) 12 (71%)
In fact, students who had more than one computer at home performed better in school. Eighty-five percent of the students who reported making mostly A’s had two or more computers at home, and 86 percent of students making mostly B’s had two or more computers at home (Table 13). However, only 38 percent of students making mostly C’s had two or more computers at home, and no students making D’s of F’s had two or more computers at home. The data shows that simply having access to a computer at home positively impacted students’ grades. Schools that have a high percentage of students without at-home access to computers should consider options for improving their students’ access.
Table 13: How Number of Computers at Home Impacts Grades (n=49)
One way for schools to improve at-home access would be to implement a one-to-one laptop program that provides laptops to students to take home after school. As of now, only five percent of the students surveyed were allowed to bring laptops home from school. School systems across the United States have instituted successful one-to-one laptop programs, and students in many of the schools produced higher quality work, had stronger computer literacy skills, and scored higher on standardized tests after receiving
# of Computers at
Home Mostly A's Mostly B's Mostly C's
Mostly D's and F's
zero 0 (0%) 0 (0%) 0 (0%) 0 (0%)
one 2 (14%) 3 (21%) 8 (57%) 9 (64%)
two to three 10 (37%) 15 (56%) 2 (13%) 0 (0%)
laptops (Maine Department of Education 2009; Mitchell Institute 2004; Silvernail & Gritter 2006).
Another, possibly less expensive option, would be for school library media centers to provide a number of laptops for students to check out and take home briefly. Currently, only four percent of the teenagers in this study were allowed to take laptops home from their school library media centers. Both one-to-one laptop programs and providing laptop checkouts would help improve at-home computer access for students, but they must be implemented well in order to maximize the benefits from the access. Teachers, school library media specialists, and students need to receive technology training, teachers must learn how to effectively integrate technology into their lessons and assignments, and school library media specialists must emphasize teaching information skills to students.
Although accessing computers and the internet at home generally results in the highest quality of access, students commonly access technology in other places to do schoolwork. In this study, students were asked where, other than school or home, they accessed computers or the internet to do homework. Participants were allowed to select more than one location, and they could also fill in a location if it was not included on the survey. Sixty-one students answered this question, and over 90 percent of those students used computers or the internet at a location other than home or school to do their
homework (Figure 7).
resources for students, especially for those who have no or limited access to computers and the internet at home. Even students who had readily available access to computers and the internet at home reported accessing technologies in other locations to do
schoolwork. As this study shows, organizations like the Boys and Girls Clubs and public libraries are important access points for students and other individuals, so it is important that they understand the needs of their users.
Figure 7: Places Other than School or Home Where Students Use Technology for Schoolwork
Conclusion
This study suggests that access to computers and the internet at home improves students’ academic performance and helps them learn important 21st
Century information skills. Fortunately, the majority of students surveyed had both a computer and internet
0 5 10 15 20 25 30 35 40 45
Public Library Friend or Family Member's
House
Work Boys and Girls
Club
Other No where
service at home. However, the presence of technology in the home did not always ensure high-quality access. White students and those in higher income households had more computers at home per family member, making it easier for them to access computers and the internet for schoolwork. Race and socioeconomic status also influenced the type of internet access students had at home. Although 80 percent of students who knew what type of internet they had at home reported having broadband or high-speed internet service, white and higher income students were more likely to have the highest quality service.
Students overwhelmingly believed that having access to computers and the internet at home helped them perform better in school. The relationships between grades, computer ownership, and time spent using technology demonstrated the positive effects technology may have on academic performance. Students who had access to more than one computer at home reported higher grades than those who had limited or no access to computers. While researchers and educators in the past were concerned that students used technology at home for recreational purposes at the expense of their education, this study did not reveal such worrying results. Though it was true that students who spent more time using computers and/or the internet for homework were more likely to make A’s or B’s in schools, time spent on social networking and entertainment did not significantly impact students’ grades.
surveys, they were text messaging their friends, or “multi-tasking” as one participant put it. In many schools today, it is acceptable and even expected for students to have
computers in class, but the use of cell phones in school is still shunned. Educators should take advantage of students’ easy access to these alternative technologies. How can cell phones, Nintendo Wii’s, and iPods be used to improve student learning? If students have access to the internet through alternative technologies but not through a computer, how can students use that access to their educational benefit?
Of course, educators must not assume all students have access to alternative technologies. This study shows that the high costs of computers and broadband internet prevented lower income households from obtaining those technologies to the same extent as their wealthier peers. Likewise, alternative technologies are expensive, and not all families and students can afford to spend an additional $30 a month for internet services on their cell phones. Therefore, educators must get to know their students, assess their information needs, and understand their access to computers, the internet, and alternative technology at home. This knowledge should shape how technology is taught in school, the availability of technology in school, and the type of assignments teachers give. If only 50 percent of a class has easy access to a computer and the internet at home, then teachers must plan assignments that do not require technology usage at home or allow class time for students to use school-provided technology.
Schools that have high percentages of students without quality access to
few laptops available for checkout in the school library media center could significantly benefit students and would be an interesting area for future study.
Even though the majority of students in this study had access to computers and the internet at home, they still accessed technology in other locations in order to do schoolwork. Students repeatedly responded that they used computers and the internet at their Boys and Girls Clubs and their public libraries for academic purposes. It would be ideal if all students had quality at-home access to computers and the internet, but some access at a library or a Boys and Girls Club is better than no access at all. Thus, these community centers play an important role in providing access to students and other people who have little access at home.
The results of this study suggest that the digital divide is shrinking, especially in middle and upper income households. However, minority and lower income students continued to have less access to computers and the internet at home. Teachers, school library media specialists, administrators, and community officials must be proactive in improving access for students and community members. Students must learn 21st Century skills to succeed in school and a technology-driven world, and they cannot learn how to use technology effectively if they do not have access to it. Schools could provide laptops to students, and school library media centers could offer extended hours and technology classes. Most importantly, educators must be aware of their students’ information needs and access capacities. Ninety-seven percent of students in this survey had access to a computer at home, and 80 percent had broadband or high-speed internet access.
together to create meaningful, authentic lessons and assignments that teach technology and information skills without depending upon at-home access. Only then will the shrinking digital divide truly begin to close for all students.
Study Limitations
Bibliography
American Association of School Librarians. (2007). Standards for the 21st Century Learner. Retrieved December 4, 2009, from http://www.ala.org/ala/mgrps/ divs/aasl/guidelinesandstandards/learningstandards/AASL_Learning_Standards_2 007.pdf
AT&T. (2010). PDAs & Smartphones. Retrieved March 28, 2010, from
http://www.wireless.att.com/cell-phone-service/cell-phones/pda-phones-smartphones.jsp
Attewell, P., & Battle J. (1999). Home Computers and School Performance. The Information Society, 15, 1–10.
Beltran, D., Das, K., & Fairlie, R. (2008, November). Home Computers and Educational Outcomes: Evidence from the NLSY97 and CPS. Retrieved November 8, 2009, from http://www.federalreserve.gov/pubs/ifdp/2008/958/default.htm. Washington, DC: Federal Reserve Board, International Finance Discussion Papers, No. 958. Best Buy. (2010). Microsoft – Xbox 360 Arcade. Retrieved March 28, 2010, from
http://www.bestbuy.com/site/Microsoft++Xbox+360+Arcade/9267937.p;jsessioni d=FF5B39FD98C33FF2E5D8D18546CBD079.bbolsp-app0538?id=12180719079 12&skuId=9267937
Best Buy. (2010). Nintendo – Wii. Retrieved March 28, 2010, from
http://www.bestbuy.com/site/Nintendo++Wii/8008559.p?id=1156203165702&sk uId=8008559&st=wii&cp=1&lp=6
Boys and Girls Clubs of America. (2010). The Facts. Retrieved March 13, 2010, from http://www.bgca.org/whoweare/facts.asp.
Celano, D., & Neuman, S.B. (2008, December). When Schools Close, the Knowledge Gap Grows. Phi Delta Kappan, 90(4), 256-262.
Clark, C., & Gorski, P. (2002). Multicultural Education and the Digital Divide: Focus on Socioeconomic Class Background. Multicultural Perspectives, 4(3), 25-36. DeBell, M., & Chapman, C. (2006). Computer and Internet Use by Students in 2003
Eamon, M. K. (2004, June). Digital Divide in Computer Access and Use Between Poor and Non-Poor Youth. Journal of Sociology and Social Welfare, 31(2), 91-112. Fox, S. (2005, October). Digital Divisions. Retrieved November 15, 2009, from
http://www.pewinternet.org/Reports/2005/Digital-Divisions.aspx. Pew Internet & American Life Project.
Giacquinta, J.B., Bauer, J.A., & Levin, J.E. (1993). Beyond Technology’s Promise: An
Examination of Children’s Educational Computing at Home, Cambridge University Press, New York.
Horrigan, J. B. (2007, August). Why It Will Be Hard to Close the Broadband Divide. Retrieved November 15, 2009, from http://www.pewinternet.org/Reports/
2007/Closing-the-Broadband-Divide.aspx. Pew Internet & American Life Project. Horrigan, J. B. (2008, July). Home Broadband Adoption 2008. Retrieved November 15,
2009, from http://www.pewinternet.org/Reports/2008/Home-Broadband-2008.aspx. Pew Internet & American Life Project.
Horrigan, J.B. (2009, July). Wireless Internet Use. Retrieved November 15, 2009, from http://www.pewinternet.org/Reports/2009/12-Wireless-Internet-Use.aspx. Pew Internet & American Life Project.
Kafai, Y., & Sutton, S. (1999). Elementary School Student’s Computer and Internet Use at Home. Journal of Educational Computing Research, 21(3), 345-362.
Kelly, R. E., & Lewis P. E. T. (2001). Household Demand for Internet Connection.
Journal of Media Economics, 14(4), 249-265.
Kupperman, J., & Fishman, B.J. (2001-2002, Winter). Academic, Social, and Personal Uses of the Internet: Cases of Students from an Urban Latino Classroom. Journal of Research on Technology in Education, 34(2), 189-215.
Kvasyny, L., & Keil, M. (2006, January). The Challenges of Redressing the Digital Divide: A Tale of Two U.S. Cities. Information Systems Journal, 16(1), 23-53. Lemke, C., & Martin, C. (2003). One-to-One Computing in Maine: A State Profile.
Retrieved December 5, 2009, from http://www.k12blueprint.com/k12/blueprint/ cd/ME-Profile.pdf
Madigan, E., & Goodfellow, M. (2005, Fall). The Influence of Family Income and Parents Education on Digital Access: Implications for First-Year College Students. Sociological Viewpoints, 21, 53-62.
Malamud, O., & Pop-Eleches, C. (2008, May). The Effect of Computer Use on Child Outcomes. Retrieved, November 7, 2009, from http://www.columbia.edu/ ~cp2124/papers/computer.pdf
Mouza, C. (2008, Summer). Learning with Laptops: Implementation and Outcomes in an Urban, Under-Privileged School. Journal of Research on Technology in
Education, 40(4), 447-472.
National Center for Education Statistics. (2001). Teachers’ Tools for the 21st Century: A
Report on Teachers’ Use of Technology. Washington, DC: Author.
National Telecommunications and Information Administration. (2002). A Nation Online: How Americans Are Expanding Their Use of the Internet. Washington, DC: U.S. Department of Commerce.
Organisation for Economic Cooperation and Development. (2009). OECD Broadband Statistics to December 2006. Retrieved December 2, 2009, from
http://www.oecd.org/document/54/0,3343,en_2649_34225_38690102 _1_1_1_1,00.html
Organisation for Economic Cooperation and Development. (2006). OECD Broadband Statistics to December 2006. Retrieved December 2, 2009, from
http://www.oecd.org/document/7/0,3343,en_2649_34225_38446855_1_1_1_1,00. html
Partnership for 21st Century Skills. (2008). 21st Century Skills, Education, and
Competitiveness: a Resource and Policy Guide. Retrieved December 4, 2009, from http://www.21stcenturyskills.org/documents/21st_century_skills_education _and_competitiveness_guide.pdf
Pelham, B., Crabtree, S., and Nyiri, Z. (2009, Summer). Technology and Education: the Power of the Personal Computer. Harvard International Review, 31(2), 74-76. Rainie, L., Bell, P., & Reddy, P. (2004, February). Rural Areas and the Internet.
Retrieved November 15, 2009, from http://www.pewinternet.org/Reports/2004/ Rural-Areas-and-the-Internet.aspx. Pew Internet & Life Project.
Selwyn, N., Potter, J., & Cranmer, S. (2009). Primary Pupils’ Use of Information and Communication Technologies at School and at Home. British Journal of Educational Technology, 40(5), 919-932.
Silvernail, D., & Gritter, A. (2006). Maine’s Middle School Laptop Program: Creating
Better Writers. Retrieved November 8, 2009, from http://www.usm.maine.edu/ cepare/Impact_on_Student_Writing_Brief.pdf Gorham, ME: Maine Education Policy Research Institute, University of Southern Maine Office.
Spooner, T. (2003, August). Internet Use by Region in the United States. Retrieved November 15, 2009, from http://www.pewinternet.org/Reports/2003/Internet-Use-by-Region-in-the-US.aspx. Pew Internet & American Life Project. Sprint. (2010). Data Plans. Retrieved on March 28, 2010, from
http://www.nextel.com/en/stores/popups/mir_plan_details_popup.shtml Turow, J., & Nir, L. (2000, May). The Internet and the Family 2000: the View from
Parents; the View from Kids. Report series No. 33. Philadelphia, PA: The Annenberg Public Policy Center of the University of Pennsylvania. Retrieved December 6, 2009, from http://www.eric.ed.gov/ERICDocs/data/
ericdocs2sql/content_storage_01/0000019b/80/16/c5/d3.pdf
Universal Service Administrative Company. (2008). Overview of the School and Libraries Program. Retrieved December 4, 2009, from
http://www.universalservice.org/sl/about/overview-program.aspx
U.S. Census Bureau. (2007). Educational Attainment in the United States: 2007. Retrieved March 22, 2010, from http://www.census.gov/prod/2009pubs/p20-560.pdf
U.S. Census Bureau. (2000). Census 2000 Demographic Profile Fact Sheet. American FactFinder. Retrieved March 31, 2010, from http://factfinder.census.gov/ home/saff/main.html?_lang=en
U.S. Congress. (1996). Telecommunications Act of 1996. Washington, D.C.: U.S. Government Printing Office.
Verizon Wireless. (2010). Individual Plans. Retrieved on March 28, 2010, from http://www.verizonwireless.com/b2c/splash/plansingleline.jsp.
Warschauer, M. (2003, August). Demystifying the Digital Divide. Scientific American
Appendix A3
COMPUTERS AND SCHOOL
1. Does your school let you take laptops home?
□ No
□ Yes
2. Can you check out laptops from your media center to take home overnight?
□ No
□ Yes
3. On average, how many hours a week do you use a computer (but not the internet) at home to do school work?
□ 0
□ 1-3 hours
□ 4-6 hours
□ 7-9 hours
□ 10 hours or more
4. On average, how many hours a week do you use the internet at home to do school work?
□ 0
□ 1-3 hours
□ 4-6 hours
□ 7-9 hours
□ 10 hours or more
COMPUTERS AT HOME
5. How many computers (including laptops and desktops) do you have in your house?
□ 0
□ 1
□ 2-3
□ More than 3
COMPUTERS AND YOU
13. On average, how many hours a day do you use your computer or the internet at home for school work?
□ 0 hours
□ 1-2 hours
□ 3 or more hours
14. On average, how many hours a day do you use your computer or the internet at home for social networking (Facebook, MySpace, etc)?
□ 0 hours
□ 1-2 hours
□ 3 or more hours
15. On average, how many hours a day do you use your computer or the internet at home for entertainment (playing games, searching the internet, email, chatting)?
□ 0 hours
□ 1-2 hours
□ 3 or more hours
16. How would you describe your computer skills?
□ Poor (I don’t know anything)
□ Average (I can do what I need to do)
□ Advanced (I can teach someone else)
17. How would you describe your internet skills?
□ Poor (I never find what I need)
□ Average (I find what I need sometimes)
□ Advanced (I almost always find what I need)
3
6. What kind of internet do you have at home?
□ None
□ Dial-up
□ Broadband/high-speed
□ Don’t know
7. Do you have wireless access in your home?
□ No
□ Yes
8. How many people use the computers and the internet in your house? (leave this blank if you don’t have computers or the internet at home)
□ 1-2
□ 3-4
□ 5 or more people
9. How many people live in your house?
□ 1-3
□ 4-6
□ 7-9
□ 10 or more
10. How hard is it for you to get access to computers or the internet at home?
□ Impossible
□ Very hard
□ Not a problem
□ Easy
□ Very easy
11. Other than computers, what devices do you use to access the internet at home?
□ Cell phone
□ Game system (Xbox, Wii, Play Station, etc)
□ Other ___________________
18. Do you think having a computer at home helps you perform better in school?
□ No
□ Yes
19. Do you think having the internet at home helps you perform better in school?
□ No
□ Yes
THE BASICS
20. What is your gender?
□ Male
□ Female
21. What is your race?
□ White
□ Black/African American
□ Asian (includes Southeast Asian and Indian)
□ Latino/Hispanic
□ Multiracial
22. What is your parents’/guardians’ highest level of education?
□ Didn’t graduate from high school
□ High school diploma or equivalent (GED)
□ Some college
□ College diploma
23. What grade are you in? _____ 24. What grades do you get in school?
□ Mostly D’s and F’s
□ Mostly C’s
□ Mostly B’s
12. Other than school and home, where do you go to access computers or the internet for school work? (check all that apply)
□ The public library
□ A friend or family member’s house
□ Work
□ The Boys and Girls Club