PREDICTORS OF NONRESPONSE IN A LONGITUDINAL SURVEY OF ADOLESCENTS
1William D. Kalsbeek, Juan Yang, and Robert P. Agans
Department of Biostatistics, University of North Carolina, Chapel Hill, NC 57599-2400
1
Work on this paper was funded by the UNC Center for Health Statistics Research as part of a grant from the CDC/National Center
for Health Statistics (Contract No. UR6/CCU417428-01).
KEY WORDS:
Respondent Recruitment, Process Effects,
Health Surveys, Sensitive Behavior
Introduction
Longitudinal design in surveys provides a unique opportunity to
study the causes and effects of nonresponse, particularly when
participants in a given round are recruited from a cohort of
respondents from the prior rounds. The availability of survey
data for respondents and nonrespondents in a given round allows
one to directly estimate nonresponse bias and its components, as
well as to gauge the relative effectiveness of weight adjustment
strategies (Ka lsbeek et al. 2001). In addition, multiple contacts
with the same sample over several rounds of data collection can
be utilized to investigate the role that the survey design and
process play in determining the final recruitment outcome for
individual followup rounds.
Recruiting the same sample on multiple occasions expands
the list of potentially viable predictors of sample recruitment
outcomes in longitudinal cohort studies. The more times one
works with a sample, the more opportunities one has to observe
those things that may influence recruitment in later rounds.
Despite this, relatively few published studies on the predictors of
nonresponse in longitudinal studies have been done. De Maio
(1980), for example, examined the role of past survey
experience, while Aneshensel et al. (1989) studied the role of
characteristics of the baseline interview (e.g., length). More
recently, Lengacher, et al. (1995) have studied the effect of
incentives, and Campanelli and O’Muirchartaigh (1999) have
reported on the role of interviewer continuity across consecutive
rounds. Most of the remaining research on this topic has
focused on nonresponse in cross -sectional in-person and
telephone surveys.
This paper examines factors affecting several outcomes of
subject recruitment in followup rounds of multi-round cohort
samples. In particular, our goal is to identify those design and
process features which affect any of four 0/1 recruitment
outcome variables, defined later for the National Longitudinal
Study of Adolescent Health (the Add Health Study), a national
school-based health survey of teenagers with several rounds of
in-home followup after an initial in-school administration. These
variables presume that recruitment can lead to study
participation, or any of the following four types of nonresponse,
defined according to where in the recruitment process the end
result occurs (Lessler and Kalsbeek, 1992):
1)
Not Solicited (NS): Sample members are not solicited for
participation by the interviewer because: they have moved
and their new address is unknown, they are out of the
country, or interviewers were not able to talk to them
about survey participation after having established contact
with their place of residence.
2)
Solicited but Unable (SUA): Sample members are asked
to participation in the study, but they decline because of
their inability to do so. Possible reasons include:
physically/mentally incapable, language barriers,
scheduling problems, and so on.
3)
Solicited but Unwilling (SUW)
: Sample members are
asked to participate but they refuse. Reasons for
declining in this way include: confidentiality concerns,
mistrust of government, just too busy, topic too personal,
don’t do surveys, and so on.
4)
Other nonrespondents (OTH)
: Sample members fail to
become participants for a reason that does not fit in any of
the three previous categories. Some examples are lost
schedules, partial respondents, and other
non-interviewable respondents.
Following a conceptual framework for round-specific
recruitment outcomes in certain longitudinal interview surveys,
we fit separate multivariate logistic regression models for var-
ious recruitment outcomes of the in-home Wave II (IH2) round
of the Add Health Study. Questionnaire and process data from
the prior in-home Wave I round (IH1) were used in our search
for predictors of four round-specific recruitment outcomes.
The Add Health Study
The Add Health Study is an ongoing school-based national
survey of health-related behaviors in adolescents from grades
7-12.
Its study design calls for collecting data from selected
teenagers, their parents, and school administrators to identify
risk factors for adolescent health behavior and to quantify their
prevalence. Questionnaire topics have included: health status,
exposure to violence, smoking behavior, illegal substance use,
and sexual behavior. Add Health’s sample of students is
school-based, meaning that multi-stage stratified systematic sampling
was first used to select 80 high schools and 52 middle schools
with probabilities proportional to size (PPS), and that the target
population is limited to the school age population of those
enrolled in grades 7-12. Stratification in school selection was by
region of the country, urbanicity, school type, ethnicity, and
school size. A baseline sample of students was then chosen in
the second sampling stage from rosters of current students in
participating schools. The final teen student sample at the
study’s outset consisted of an approximately equal-probability
core sample and several specialized samples (e.g., of minorities,
the disabled, twins, siblings, and unrelated pairs). The focus in
our study has been on the recruitment experience from the core
sample alone.
Four rounds of data gathering have been completed thus far
in the Add Health study, starting with a self-administered
in-school questionnaire (IS1, n=90,118) in 1994-1995 and followed
by three in-person in-home interviews for IH1 (n=20,745) in
1995, IH2 (n=14,738) in 1996, and a Wave III round (IH3) that
1740
is being completed in 2001-2002. Recruitment and data
collection in IS1, IH1, and IH2 were done by the National
Opinion Research Center. RTI International is conducting IH3.
The overall response rate for the core sample was 78.1% for IH1
and 88.4% for IH2 (with 12,105 and 9,148 completed
interviews, respectively). In IH1 and IH2, the household first
received an advanced letter to introduce the study, then
interviewers contacted the selected teen’s parents or guardians
by personal household visit or telephone to: (i) obtain permission
to interview the selected teen in the home and (ii) ask them to
participate in an in-home parent interview in IH1. Once
permission was given, interviewers then conducted the interview
with the selected teens in person or set up an appointment for an
in-home interview with them. During this interview, questions
were read aloud and the respondent's answers entered into laptop
computers (CAPI) for less sensitive topics and a specially
designed form of audio computer assisted self-interviewing
(ACASI) was used for more sensitive topics to maximize the
confidentiality of the teen’s responses. The parent interview
followed standard face-to-face interviewing methods. A
household was considered to have responded if the teen
completed an interview. A more detailed description of the Add
Health study design is published elsewhere (Bearman, et al.,
1997; Udry 1998). The focus in our study of recruitment
outcomes is IH2 only.
A Conceptual Framework for Recruitment Outcomes
The conceptual framework in our search for predictors of
recruitment outcomes is an adaptation of a recently proposed
framework for similar outcomes in interview surveys (Groves
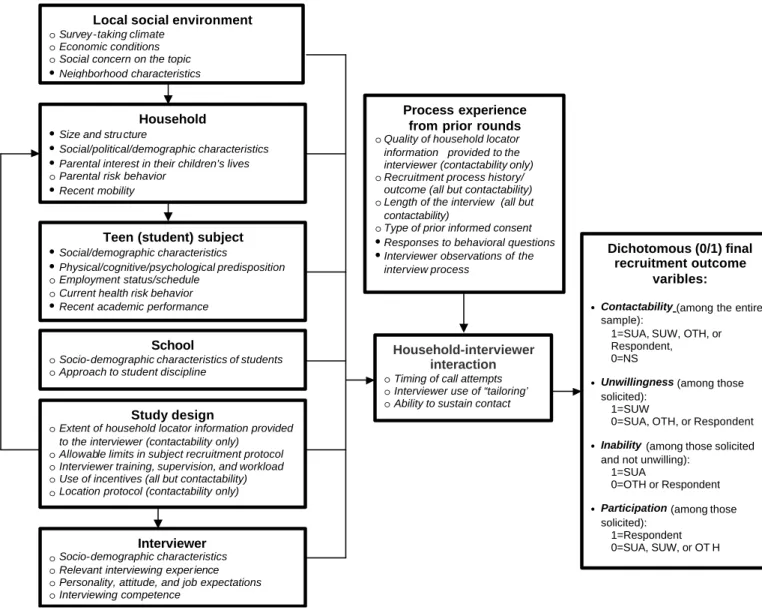
and Couper, 1998). Our framework (see Figure 1) is specifically
intended for longitudinal studies of the student population from
school-based samples as used in Add Health.
As defined in the right hand box of Figure 1, the four
recruitment outcome variables we consider are:
contactability
(success in soliciting study participation among those in the
entire sample);
unwillingness (a refusal among those solicited);
inability (not able among those solicited and not unwilling); and
participation
(responding among those solicited). Specific
computational expressions are seen there for these 0/1 variables.
We conduct separate sea rches for predictors of each variable.
Structurally, our framework presumes that outcomes of the
recruitment process may be affected by several
factors
(boldface
type in Figure 1) that are tied to this process.
Household
,
teen
(student) subject
,
school
, and
interviewer
factors are linked to
the main “players” in the recruitment process, while the
study
design
and
experience from prior waves
, respectively,
correspond to the macro and micro scientific context. The
local
social environment
and
household-interviewer interaction
reflect the macro and micro process backdrop to recruitment,
respectively. Each factor, in turn, consists of a number of
hypothesized
influences
(bulleted in Figure 1), some of which
have justification from the research literature. It is for each of
these influences that we seek data items to serve as potential
predictors of recruitment outcomes. It should be noted that
Figure 1 is intended to be a simultaneous visual portrayal of
possible predictors of all four of the recruitment outcome
variables we considered, with the set of factors being the same
for each outcome, but the influences varying somewhat among
them, as indicated. For instance, the “location protocol” in the
study design is hypothesized to influence contactability but not
the other three outcome variables.
The search for outcome predictors in our framework
considers the nature of recruitment in this type of longitudinal
design, as well as those involved in the process itself. Viewed as
a sociological event, survey recruitment may be affected by the
local social environment
surrounding the recruitment process.
For example, high crime rates in the resident’s neighborhood
may limit access by the telephone interviewer to the household
and may lead to a greater likelihood of refusal because of
concern about safety. Recruitment may also be affected by the
surrounding degree of urbanization. Characteristics of the
household
one is trying to recruit in an interview survey also
may play a role. Several of these characteristics have been
examined as predictors of survey participation (Couper and
Groves, 1996;
Groves and Couper, 1998). Attributes of the teen
and other members of the
household
like its recent mobility
patterns of its members, and its members’ working schedules
may determine at-home patterns, which in turn affect the
chances that they will be solicited. Social, political, or
demographic characteristics of the
household
and its members,
including their education, race, and socio-economic status, are
also thought to affect the household’s decision to participate, as
is the level of parental interest in the lives of their children. We
also allow the possibility that the
teen’
s recent academic
performance, behavioral characteristics, and basic predisposition
to participation in the study may affect the outcome of efforts to
solicit or interview him/her in followup rounds.
The Add Health Study initially identified and recruited each
sampled teen through the
school
they were attending at the time.
Socio-demographic and disciplinary policies of these
schools
may therefore impact the ability of interviewers to locate and
recruit its students and their families for followup, if the schools
are partners in this process by supplying information or support
to the recruitment process. The extent of locator information for
followup required by the
study design
, combined with the
quality of the locator information that the school provides
initially, and the survey organization is able to obtain later, may
also impact the ability of interviewers to locate households and
complete followup interviews. It is also plausible to expect that
study design
specifications for locating and recruiting
respondents, along with the use of incentives and features of the
operational plan for training and supervision of interviewers,
could influence recruitment outcomes. Some of these
study
design
features, along with the personal and professional
background of the
interviewer
have been found to be associated
with contactability and unwillingness recruitment outcomes
(Botman and Thornberry, 1992;
Couper, 1991; Groves and
Couper, 1998). In addition to the quality of locator information,
recruitment outcomes in a given round may also be affected by
other
experience from prior rounds
, including the recruitment
process in those rounds as well as interviewer observations or
responses to related behavioral questions. For example,
reporting an extreme health behavior (e.g., illegal drug use) in
one round may signal the possibility of avoidance in subsequent
rounds. Finally, the use of certain recruitment strategies (e.g.,
the timing of call attempts) by the interviewer at the point of
interaction with the household(er) may affect the outcome of
recruitment efforts.
Joint Statistical Meetings - Section on Survey Research Methods
Methods
The principal analysis tool we used in our search for recruitment
predictors was fitted logistic regression modeling with
dichotomous 0/1 indicator variables corresponding to the four
IH2 recruitment outcomes from our conceptual framework
(i.e.,contactability, unwillingness, inability, and participation).
These indicators were computed by reviewing the final IH2
outcome for each member of the sample that was assigned for
recruitment in that round. Each household in the IH2 sample
was then classified as either a respondent or a type of
nonrespondent (i.e, as NS, SUA, SUW, or OTH). The results of
this sample classification were then used to define the four
outcome indicator variables defined in Figure 1 that would
become dependent variables in our logistic model fitting.
Subsequent procedural steps of our analysis plan were the
following. First, we did a careful review of all available survey
and process data from IH (conducted the year before IH2) to
identify those data items corresponding to our framework that
might become predictors of the recruitment outcomes we
considered. This review yielded 81 data items. Influences
recorded in solid bullets in Figure 1 are those with one or more
of these items. To reduce this relatively large set of items to a
more manageable number for subsequent modeling, a two-way
categorical analysis was performed to measure the bi-variate
association between each dichotomized or categorized item and
the response/nonresponse outcome for the full sample. The
specific measure of association we used for this purpose was a
(maximum) risk ratio, calculated as the largest of the
nonresponse rates among all item categories, divided by the
smallest of these nonresponse rates. The 16 items with a risk
ratio of 1.5 or higher were retained for subsequent evaluation as
possible predictors of the four 0/1 outcome variables. Next,
using sample weights that were normalized to the respondent
sample size, we ran four separate stepwise selection logistic
models in SAS v8.2 (SAS Institute Inc., 2001), one for each
recruitment outcome variable and with all the 16 semi-finalist
items as candidate predictors. Item regression coefficients
significant at
α
=0.05 were thereby flagged as provisional
predictors for each outcome. Of the sample of 10,374 IH2
sample members (i.e., IH1 respondents) that were available for
this analysis step, 7,072,
6,874,
6,650,
and 6,874 were used for
contactability, unwillingness, inability, and response,
respectively, since observations with missing values for any of
the 16 semi-finalist variables or the dependent variable were
dropped from this part of the analysis. Note that we ran this
stepwise model fitting both with and without plausible
first-order interactions included, and that except for contactability the
significant predictors that emerged were the same as reported
below. Finally, for each of the four recruitment outcomes, the
final stepwise model was re-run using PROC RLOGIT in SAS
callable SUDAAN v8.0 (Research Triangle Institute, 2001) to
account for key features of the Add Health sample design in
identifying the final set of predictors for each recruitment
outcome. The sample sizes were adjusted back to 7,794, 8,305,
9,298, and 8,301 for the four outcomes respectively with only
the missing values of the finalized dependent and independent
variables excluded.
Findings
Our search of all available IH1 documents yielded 81 data items
corresponding to 10 influences (solid bullets in Figure 1) linked
to four of the eight factors in our conceptual framework. They
included degree of urbanization and measures of neighborhood
safety for the
local social environment
. We also identified
several
household
measures including its: size, income, number
of years at the current address, and type of residential structure;
its residents’ ages and social inter-relationship; and the parents’
education, employment status, and involvement in relevant
organizations (e.g., the PTA). We found a number of items
related to the
teen
, including age, race, gender, religion,
depression scales, and whether or not they had received
counseling in the previous year, had ever considered suicide, had
recently been in trouble with school administrators, or had
recently gotten bad grades in school. Finally, we were able to
identify the following items based on
experience from prior
rounds
(i.e., IH1): current substance use (e.g., alcohol, tobacco,
and illegal drugs), whether or not they were a regular smoker,
had been drunk in the past year, or had been a binge drinker, and
interviewer observations of the respondent (e.g., bored,
embarrassed. etc.).
The sets of significant predictors identified by stepwise
model fitting differed by recruitment outcome variable, although
some of the 16 items that were run through this process were
significant in more than one model. Controlling for other
covariates and using p
≤
0.05 to designate a significant predictor,
the SUDAAN results for the four outcomes are presented in
Tables 1-4. Note that all predictors listed in these tables had
been found to be significant in the stepwise modeling:
Contactability (Table 1):
We found that teens’ households were more likely to be solicited
in IH2 the longer the household had lived at its current address
as of IH1, and if the household’s reported in come in IH1 was
above the poverty level based on the 1995 national standards
(U.S. Bureau of the Census, 1996), or if the teen felt safe in the
neighborhood, had not smoked in the past 30 days, or was
performing relatively well academically at that time. Based on
the size of the estimated odds ratio (OR), the items linked to
neighborhood security, the household being above poverty, and
current smoking status as of the prior round were the most
important among the set of significant predictors, all three
having a positive effect on contactability. Note that when the
stepwise procedure was run with first-order interactions
included, the neighborhood security and recent mobility items
were no longer significant predictors of contactability and their
interaction was marginally significant.
Unwillingness (Table 2):
Solicited household in IH2 were more likely to refuse to
participate if the teen was white, or if in IH1 the teen had not
smoked in the past 30 days, had parents who did not volunteer to
do fund-raising for the PTA, or had parents whose highest
educational attainment was high school or less. Race and prior
smoking behavior were the two most important among these
items, both demonstrating a positive effect on unwillingness.
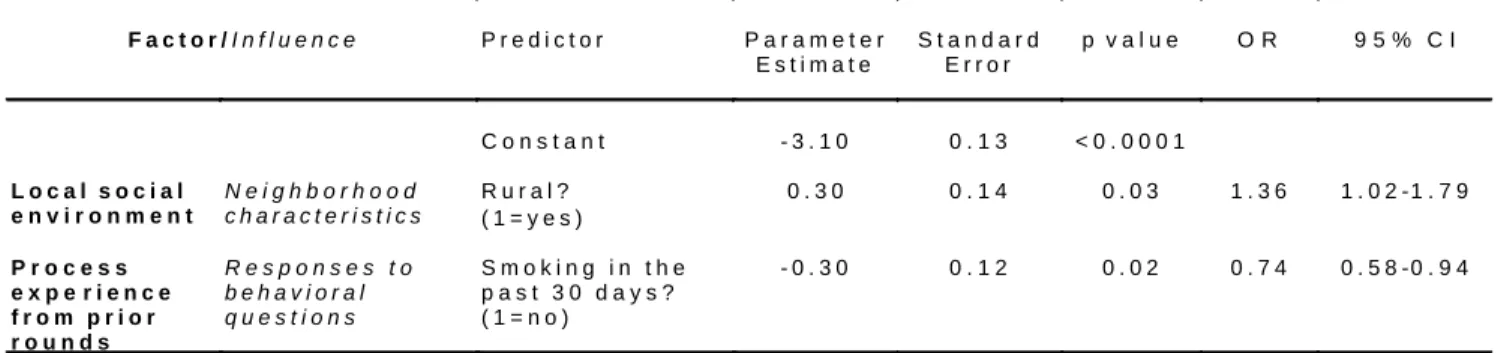
Inability (Table 3):
Willing IH2 households were more likely to be unable to
participate if in IH1 they lived in a rural area or had smoked in
the past 30 days, both items being of nearly equal importance.
Participation (Table 4):
Households of solicited teens were more likely to participate in
IH2 if, as of IH1, the teen was nonwhite or if the teen’s parents
had gone to college or had volunteered to do fund-raising for the
school’s PTA. Parental involvement in the PTA was most
important among these three items. Recall that these two
parental traits were also significant predictors of unwillingness
but in the opposite direction, as one would expect.
Discussion
Our findings are partially consistent with earlier research.
Among the inconsistencies, a number of items that have been
found to be important predictors of survey nonresponse in
interview surveys did not emerge here or were found to have
differing effects. For example, Groves and Couper (1998)
reported that urban residents are usually less likely to be
contacted in surveys due to different reasons of spending more
time out of home. Weeks et al. (1980) reported that finding
someone age 14+ at home was most likely in rural areas and
most difficult in the inner city. Indeed, our findings did not find
level of urbanization to be predictive of contactability. Also,
contrary to what we might have anticipated based on these
earlier studies, teens living in rural areas were less likely to be
able to participate in IH2, although recall that our assessment
was limited to those who were not unwilling to participate.
Also, our findings on the effect of race only partly agree
with previous studies. We found lower response rates and
greater unwillingness among whites, which agrees with the
findings by Weaver et al. (1975) and O’Neil (1979) for
telephone surveys but not those reported by Kalton and
Lepkowski et al. (1990) for in-person interviewing and by
Moonesinghe et al. (1995) for a mail-then-telephone protocol.
One interesting but somewhat curious finding from our
research is the broad and prominent effect of reported smoking
behavior from the previous round on recruitment outcome for
the current round. We found that students who had been current
smokers in the previous round were less likely to be solicited,
more likely to be unable as long as they were not unwilling, but
less likely to refuse once they are solicited. Puzzling is that
accompanying these effects we might have expected smoking
status to affect participation as well, but it did not.
While the longitudinal design of the Add Health Study has
enabled us to evaluate the statistical effect of several substantive
and process items on recruitment outcomes for IH2, only a
relatively small portion of the possible outcome influences posed
by our conceptual framework had data for this round of data
collection. Fortunately, a wider range of data items will be
available to our research team for the next round of this study
(IH3) and will be used for subsequent assessment. It is our hope
that the results of this and later work will enable those planning
surveys like Add Health to better predict recruitment outcomes
so that appropriate preventive steps can be taken in future rounds
of the Add Health Study, and in other similar studies, to
diminish the extent of adverse recruitment outcomes
References
Aneshensel CS, Becerra RM, Fielder EP, and Schuler RH.
(1989). Participation of Mexican American female adolescents
in a longitudinal panel survey. Public Opinion Quarterly.
53:548-562
Bearman, Peter S., Jones, Jo, and Udry, J. Richard. (1997) The
National Longitudinal Study of Adolescent Health: Research
Design [WWW document]. URL:
http://www.cpc.unc.edu/addhealth
Botman SL and Thornberry OT. (1992). Survey design features
correlates of nonresponse. ASA Proceedings of the Section on
Survey Research Methods. 309-314
Campanelli, P. and O'Muircheartaigh, C. (1999). Interviewers,
interviewer continuity, and panel survey nonresponse. Quality
and Quantity. 33:59-76
Couper, M.P. (1991). Modeling survey participation at the
interviewer level. ASA Proceedings of the Section on Survey
Research Methods. 98-107
Couper MP and Groves RM. (1996). Social environmental
impacts on survey cooperation. Quality & Quantity.
30:173-188
DeMaio TJ. (1980). Refusal: who, where and why. Public
Opinion Quarterly. 44:223-233
Groves, RM and Couper, MP (1998). Nonresponse in Household
Interview Surveys. New York: Wiley
Kalsbeek W, Morris C., and Vaughn B. (2001). Effects of
Nonresponse on the Mean Squared Error of Estimates from a
Longitudinal Study. Proceedings of the American Statistical
Association, Section on Survey Research Methods
[CD-ROM], American Statistical Association, Alexandria, VA
Kalton G and Lepkowski J. (1990). Characteristics of second
wave nonrespondents in a panel survey. ASA Proceedings of
the Section on Survey Research Methods. 462 -467
Lengacher JE, Sullivan CM, Couper MP, and Groves RM.
(1995). Once reluctant, always reluctant? Effects of
differential incentives on later survey participation in a
longitudinal study. ASA Proceedings of the Section on Survey
Research Methods. 1029-1034
Lessler, JT and Kalsbeek, WD (1992). Nonsampling Errors in
Surveys. New York: Wiley and Sons
Moonesinghe, R, Mitchell, S, and Pasquini, D. (1995). An
identification study of nonrespondents to the 1993 survey of
doctorate recipients. ASA Proceedings of the Section on
Survey Research Methods. 453-458
O’Neil, MJ. (1979). Estimating the nonresponse bias due to
refusals in telephone surveys. Public Opinion Quarterly.
43:218-232
SAS Institute Inc. (2001). SAS/STAT User’s Guide, Version
8.2. Cary, NC: SAS Institute Inc.
Research Triangle Institute (2001). SUDAAN User’s Manual,
Release 8.0. Research Triangle Park, NC: Research Triangle
Institute
U.S. Bureau of the Census. (1996). Current Population Reports,
Series P60-194, Poverty in the United States: 1995. U.S.
Government Printing Office, Washington, DC
Weaver, CN, Holmes, SL, and Glenn, ND. (1975). Some
characteristics of inaccessible respondents in a telephone
survey. Journal of Applied Psychology. 60:260-262
Weeks MF, Jones BL, Folsom RE, and Benrud CH. (1980).
Optimal times to contact sample households. Public Opinion
Quarterly. 44:101-11
Udry, JR. (1998). The National Longitudinal Study of
Adolescent Health (Add Health), Waves I & II, 1994-1996
[machine-readable data file and documentation]. Chapel Hill,
NC: Carolina Population Center, UNC-CH
Joint Statistical Meetings - Section on Survey Research Methods
Teen (student) subject • Social/demographic characteristics
• Physical/cognitive/psychological predisposition o Employment status/schedule
o Current health risk behavior
• Recent academic performance
Dichotomous (0/1) final recruitment outcome
varibles:
• Contactability (among the entire sample):
1=SUA, SUW, OTH, or Respondent, 0=NS
• Unwillingness (among those solicited):
1=SUW
0=SUA, OTH, or Respondent
• Inability(among those solicited and not unwilling):
1=SUA
0=OTH or Respondent
• Participation(among those solicited):
1=Respondent 0=SUA, SUW, or OT H
Local social environment
o Survey-taking climate o Economic conditions o Social concern on the topic
• Neighborhood characteristics
Household • Size and stru cture
• Social/political/demographic characteristics
• Parental interest in their children’s lives o Parental risk behavior
• Recent mobility
Study design
o Extent of household locator information provided to the interviewer (contactability only)
o Allowable limits in subject recruitment protocol o Interviewer training, supervision, and workload o Use of incentives (all but contactability) o Location protocol (contactability only)
Interviewer
o Socio-demographic characteristics o Relevant interviewing exper ience o Personality, attitude, and job expectations o Interviewing competence
School
o Socio-demographic characteristics of students o Approach to student discipline
Process experience from prior rounds
o Quality of household locator information provided to the interviewer (contactability only) o Recruitment process history/
outcome (all but contactability) o Length of the interview (all but
contactability)
o Type of prior informed consent
• Responses to behavioral questions
• Interviewer observations of the interview process
Household-interviewer interaction
o Timing of call attempts o Interviewer use of “tailoring’ o Ability to sustain contact
Table 1.
Predicting contactability (n=7,794)
F a c t o r /I n f l u e n c e P r e d i c t o r P a r a m e t e r E s t i m a t e
S t a n d a r d E r r o r
p v a l u e O R 9 5 % C I
C o n s t a n t 2 . 2 9 0 . 2 6 < 0 . 0 0 0 1
L o c a l s o c i a l e n v i r o n m e n t
N e i g h b o r h o o d c h a r a c t e r i s t i c s
F e e l s a f e i n t h e n e i g h b o r h o o d ? ( 1 = y e s )
0 . 4 4 0 . 1 9 0 . 0 3 1 . 5 5 1 . 0 6 -2 . 2 7
H o u s e h o l d S o c i a l / p o l i t i c a l / d e m o g r a p h i c c h a r a c t e r i s t i c s
P o v e r t y ?
( 1 = a b o v e n a t i o n a l p o v e r t y l e v e l )
0 . 3 9 0 . 1 9 0 . 0 5 1 . 4 7 1 . 0 0 -2 . 1 6
R e c e n t m o b i l i t y Y e a r s l i v i n g i n t h e c u r r e n t r e s i d e n c e
0 . 0 9 0 . 0 2 0 . 0 0 0 1 1 . 1 0 1 . 0 6 -1 . 1 4
P r o c e s s e x p e r i e n c e f r o m p r i o r r o u n d s
R e s p o n s e s t o b e h a v i o r a l q u e s t i o n s
S m o k i n g i n t h e p a s t 3 0 d a y s ? ( 1 = n o )
0 . 4 1 0 . 1 7 0 . 0 2 1 . 5 0 1 . 0 7 -2 . 1 1
T e e n ( s t u d e n t ) s u b j e c t
R e c e n t a c a d e m i c p e r f o r m a n c e
I n d e x o f p o o r a c a d e m i c p e r f o r m a n c e *
-0 . 1 5 0 . 0 4 0 . 0 0 1 0 . 8 6 0 . 7 9 -0 . 9 4
* I n c l u d i n g p o o r g r a d e s , t r o u b l e w i t h t e a c h e r / s c h o o l / h w / s t u d e n t s , f i g h t , s k i p s c h o o l , r e p e a t g r a d e , a n d o u t-o f- s c h o o l s u s p e n s i o n .
Table 2.
Predicting unwillingness among those solicited (n=8,305)
Table 3.
Predicting inability among those solicited but not unwilling (n=9,298)
Table 4
. Predicting response among those solicited (n=8,301)
F a c t o r /I n f l u e n c e P r e d i c t o r P a r a m e t e r E s t i m a t e
S t a n d a r d E r r o r
p v a l u e O R 9 5 % C I
C o n s t a n t - 3 . 8 5 0 . 2 0 < 0 . 0 0 0 1
H o u s e h o l d S o c i a l / p o l i t i c a l / d e m o g r a p h i c c h a r a c t e r i s t i c s
H i g h e s t e d u c a t i o n a l a t t a i n m e n t o f p a r e n t s ( 1 = c o l l e g e o r h i g h e r
- 0 . 2 9 0 . 1 2 0 . 0 2 0 . 7 4 0 . 5 8 - 0 . 9 6
P a r e n t a l i n t e r e s t i n t h e i r c h i l d r e n ’ s l i v e s
A p a r e n t v o l u n t e e r s i n s c h o o l f u n d -r a i s i n g ? ( 1 = y e s )
- 0 . 5 1 0 . 2 5 0 . 0 5 0 . 6 0 0 . 3 6 - 1 . 0 0
P r o c e s s e x p e r i e n c e f r o m p r i o r r o u n d s
R e s p o n s e s t o b e h a v i o r a l q u e s t i o n s
S m o k i n g i n t h e p a s t 3 0 d a y s ? ( 1 = n o )
0 . 4 8 0 . 1 9 0 . 0 2 1 . 6 1 1 . 0 9 - 2 . 4 0
T e e n ( s t u d e n t ) s u b j e c t
S o c i a l / d e m o g r a p h i c c h a r a c t e r i s t i c s
R a c e ( 1 = w h i t e )
0 . 6 6 0 . 1 5 0 . 0 0 0 1 1 . 9 4 1 . 4 2 - 2 . 6 6
F a c t o r /I n f l u e n c e P r e d i c t o r P a r a m e t e r E s t i m a t e
S t a n d a r d E r r o r
p v a l u e O R 9 5 % C I
C o n s t a n t - 3 . 1 0 0 . 1 3 < 0 . 0 0 0 1
L o c a l s o c i a l e n v i r o n m e n t
N e i g h b o r h o o d c h a r a c t e r i s t i c s
R u r a l ? ( 1 = y e s )
0 . 3 0 0 . 1 4 0 . 0 3 1 . 3 6 1 . 0 2 -1 . 7 9
P r o c e s s e x p e r i e n c e f r o m p r i o r r o u n d s
R e s p o n s e s t o b e h a v i o r a l q u e s t i o n s
S m o k i n g i n t h e p a s t 3 0 d a y s ? ( 1 = n o )
- 0 . 3 0 0 . 1 2 0 . 0 2 0 . 7 4 0 . 5 8 -0 . 9 4
F a c t o r /I n f l u e n c e P r e d i c t o r P a r a m e t e r
E s t i m a t e
S t a n d a r d E r r o r
p v a l u e O R 9 5 % C I
C o n s t a n t 2 . 3 5 0 . 1 9 < 0 . 0 0 0 1
L o c a l s o c i a l e n v i r o n m e n t
N e i g h b o r h o o d c h a r a c t e r i s t i c s
R u r a l ? ( 1 = y e s )
- 0 . 1 3 0 . 0 8 0 . 1 4 0 . 8 8 0 . 7 4 - 1 . 0 5
H o u s e h o l d S i z e a n d
s t r u c t u r e
H o u s e h o l d s i z e ( c o n t i n u o u s )
0 . 0 4 0 . 0 4 0 . 3 5 1 . 0 4 0 . 9 6 - 1 . 1 2
S o c i a l / p o l i t i c a l / d e m o g r a p h i c c h a r a c t e r i s t i c s
H i g h e s t e d u c a t i o n o f r e s i d e n t i a l p a r e n t s ( 1 = c o l l e g e o r h i g h e r
0 . 2 7 0 . 1 0 0 . 0 1 2 1 . 3 0 1 . 0 6 - 1 . 6 0
P a r e n t a l i n t e r e s t i n k i d s ’ l i v e s
A p a r e n t v o l u n t e e r s i n s c h o o l f u n d -r a i s i n g ? ( 1 = y e s )
0 . 4 1 0 . 1 5 0 . 0 1 1 . 5 1 1 . 1 2 - 2 . 0 4
T e e n ( s t u d e n t ) s u b j e c t
S o c i a l / d e m o g r a p h i c c h a r a c t e r i s t i c s
R a c e ( 1 = w h i t e )
- 0 . 2 5 0 . 1 0 0 . 0 2 0 . 7 8 0 . 6 3 - 0 . 9 6
Joint Statistical Meetings - Section on Survey Research Methods