By
Anne Lachiewicz
A Master's Paper submitted to the faculty of the University of North Carolina at Chapel Hill
in partial fulfillment of the requirements for the degree of Master of Public Health in
the Public Health Leadership Program.
Chapel Hill
Abstract
Obesity is associated with osteoarthritis of the knee. It is anticipated
that after successful total knee arthroplasty, patient activity should
increase and body weight should decrease. There are little prospective
data on the effect of primary total knee arthroplasty on the weight and
activity level of overweight and obese patients in the United States.
We conducted a prospective study of changes in patient weight,
body mass index (BMI), and activity level over two years in 219
consecutive patients, 188 (86%) of whom were overweight or obese (BMI
:::._25). Weight and BMI were assessed preoperatively and at one and two
years. Physical activity level was evaluated using the Lower Extremity
Activity Scale (LEAS), a self-assessment instrument. Multiple linear
regression was used to examine the relationship between preoperative
LEAS score and weight!BMI at two years of follow-up.
At two years postoperatively, weight and BMI data were available
for 152 patients (81%) with BMI :::_ 25. No mean weight change was found
(p=0.80), but mean BMI increased significantly by 0.46 kg/m2 (p=0.049). Mean LEAS score for 96 patients increased significantly from preoperative
to two years (p<0.001). At two years follow-up, 17% of patients had lost
:::_5% of body weight, 23% had gained :::_5% of weight, and 60% had <5%
change in weight. Preoperative LEAS score was not associated with
After primary total knee arthroplasty, mean patient weight did not
change and BMI increased at two years, despite an apparent increase in
activity level. These findings have important implications for patient
Table of Contents
Manuscript ... 5
Introduction ... 5
Methods ... 7
Results ... 13
Discussion ... 20
Introduction Addendum ... 24
Background Overweight and Obesity in the United States ... 24
Osteoarthritis of the Knee ... 25
Obesity and Osteoarthritis of the Knee ... 26
Outcomes of Total Knee Arthroplasty in Obese Patients ... 29
Systematic Review of the Studies on Weight/Body Mass Index Change after Total Joint Arthroplasty Selection of Articles ... 34
Appraisal of the Literature ... 35
Tables of Studies in Systematic Review ... Appendix Discussion Addendum ... .44
Research in Context ... .44
Critical Appraisal of Study ... .44
Implications for Clinical Practice ... .47
Perspectives for Future Research ... .49
Introduction
The prevalence of overweight and obesity among adults in the
general population is increasing, and in 2003-2004, 66.3% of adults 20
years of age or older were overweight or obese (Body Mass Index (BMI) >
25 kg/m2).1 This rise has also occurred within the age-groups that most
frequently have total knee arthroplasty as 71.0% of adults::_ 60 years are
overweight or obese.1· 2 The prevalence of overweight and obesity among
adults may even be higher among patients having total knee arthroplasty
because increased weight is a risk factor for osteoarthritis of the knee. 3 Overweight and obese patients with symptomatic knee arthritis commonly
undergo total knee arthroplasty for severe pain and disability. Patients
anticipate pain relief after arthroplasty, hopefully leading to an increase in
activity level and a decrease in weight.
Total knee arthroplasty relieves pain and improves function in
patients with a variety of arthritic disorders for as long as fifteen years
following surgery.4· 5 Several studies have shown that even obese patients
can have a successful outcome with only a slightly increased risk of
complications.6-11 However, high preoperative weight and BMI have been
reported to be a risk factor for surgical complications and adverse
postoperative outcomes.11-13
Less is known about whether patients' weight or BMI change
following arthroplasty. The preoperative weight of these patients is of
facilitate the procedure and to decrease complications.6 We, like others, have found that overweight and obese patients often claim they are
unable to lose weight because pain from severe arthritis of the knee limits
their activity and thus their ability to expend calories.14 The patients often believe that total knee arthroplasty will permit an increase in their physical
activity and enable them to lose weight postoperatively.
Few studies have investigated weight change or BMI change after
primary total knee arthroplasty.15-17 Previous studies examining weight and
BMI change after total knee or total hip arthroplasty have found mixed
results, but, overall, they suggest that lower extremity arthroplasty does
not facilitate weight loss. Three studies in the United Kingdom and one in
the United States found that total hip arthroplasty patients gained weight14· 16
· 17 or increased BMI18 postoperatively. Woodruff and Stone16 and Heisel
et al.17 found that patients undergoing total knee arthroplasty had an increase in mean body weight, but the results were not statistically
significant Pritchett and Bortel found that morbidly obese women, who
were advised by a physician to lose weight and were counseled by a
dietician, had no sustained weight loss and 24% gained weight following
total knee arthroplasty. 15
Previous studies of weight change in total knee arthroplasty
patients are limited by small sample sizes and the lack of data on change
in activity level and change in BMI. The present study prospectively
after primary total knee arthroplasty. Our hypothesis was that, although
patient activity level would generally increase after total knee arthroplasty,
weight and BMI would not change. We also investigated whether
preoperative activity level was associated with weight!BMI change in these
patients after arthroplasty.
Methods Parlicipants
We prospectively followed 219 consecutive patients after they
underwent primary total knee arthroplasty performed by one surgeon at an
American university medical center between May 1998 and December
2003. All patients with BMIIess than 25 kg/m2 (n = 31) were excluded from the analysis since it would be undesirable for normal weight or
underweight patients to lose weight after total knee arthroplasty. If a
patient with staged bilateral arthroplasties had both operations during the
five year period, only data collected from the time of the second operation
were analyzed. All charts were reviewed and data were collected by one
investigator (AL). The research protocol was reviewed and approved by
Procedures and Data Collection
Outcome variables
Patient height and weight, with clothing and shoes, were recorded
preoperatively and at one year and two year follow-up visits by one of two
nursing personnel using one scale (Scale-tronix 6002, Scale-tronic,
Wheaton, Illinois) accurate to one-tenth of a pound. Weight and height
were converted to BMI as defined by the ratio of body weight in kilograms
divided by the height in meters squared (kg/m2).13 Patients were classified
by preoperative BMI as normal weight (BMI <25 kg/m2), overweight
(25.0-29.9 kg/m2), obese class I (30.0- 34.9 kg/m2), obese class II (35.0- 39.9
kg/m2), and morbidly obese (BMI::: 40 kg/m2).19
Independent Variables
Several patient characteristics and demographic variables were
collected preoperatively, including age, gender, and orthopedic diagnosis.
Preoperatively and at one and two years of follow-up, data were also
collected on arthritic co-morbidities and typical activity level.
Co-morbidities potentially affecting mobility were assessed
preoperatively and at one year and two year follow-up visits using the
three patient classifications described by Charnley,20 which we modified for knees (Supplementary Table 1). Class A patients had unilateral knee
arthroplasty and no other problems limiting ambulation. Class B patients
in the contralateral knee severe enough to limit ambulation. Class C
patients had unilateral or bilateral knee arthroplasty and multiple arthritic
problems or other conditions directly impeding ambulation, such
rheumatoid arthritis, neurological conditions, or lumbosacral arthritis. The
Charnley patient classification was originally designed for use in patients
undergoing total hip arthroplasty but has been modified for use in knee
arthroplasty patients in several publications.17· 21-23 Although the Charnley
classification scheme has never been systematically validated, it has been
used by convention for over two decades to describe ambulatory function
in lower extremity arthroplasty patients.
s
upp ementarv a e T bl 1 D escnptton o f M d"f d o tte Ch arn ev ca e S I Class A Unilateral knee arthroplasty and no other problems limitingambulation
Class B Bilateral knee arthroplasty or unilateral knee arthroplasty and arthritis in the contra-lateral knee severe enough to limit ambulation
Class C Unilateral or bilateral knee arthroplasty and multiple arthritis problems or other conditions directly impedinq ambulation
Patient activity level was assessed preoperatively and at one year
and two year follow-up visits with the Lower extremity Activity Scale
(LEAS),24 used prospectively since September 1998 (Supplementary Figure 1 ). This self-administered scale reflects an individual's typical daily
activity, including frequency and intensity. The LEAS is well-suited to
measure activity change in total hip or knee arthroplasty patients because
while other commonly used activity instruments measure maximum
item scale scored from 1-18 with a score of 1 being "I am confined to bed
all day," 9 being "I am up and about at will in my house and can go out
and walk as much as I like with no restrictions (weather permitting)," and
18 being "I am up and about at will in my house and outside. I also
participate in vigorous physical activity such as competitive level sports
daily." This instrument has recently been validated to measure physical
activity in patients with revision total knee arthroplasty24 However, the LEAS has also been tested in patients undergoing primary total knee
Lower Extremity Activity Scale*
Please read through each description given below, pick the ONE description that best describes your
regular daily activity and put a check in that box {Check only one box).
Cl 1, I am confined to bed all day. (1)
0 2. I am confined to bed most of the day except for minimal transfer activities (going to the bathroom, etc.) (2)
0 3. I am either in bed or sitting in a chair most of the day. (3)
Q 4. I sJt most of the day, except for minimal transfer activities, no walking or standing. (4)
Cl 5. i sit most of the day, but I stand occasionally and walk a minimal amount in my house. {I may
rarely leave the house for an appointment and may require the use of a wheelchair or scooter for
transportation.) (5)
0 6. I walk around my house to a moderate degree but I don't leave the house on a regular basis.
I may leave the house occasionally for an appointment. (6)
CJ 7, I walk around my house and go outside at wltl, walking one or two blocks at a lime. {7) 0 8. t walk around my house, go outside at will and walk several blocks at a time without any
assistance (weather permitting). (8)
CJ 9. I am up and about at will in my house and can go out and walk as much as I would like wfth no restrictions (weather pennitting}. {9)
iO. 1 am upandaboutatwill in my house and outside. I afso work outside the house in a: Q minimally (10)
Cl moderately (11) Q extremely active job ( 12)
(Please check the best description of your work leveL)
11. 1 am up and about at will in my house and outside. I also participate in relaxed physical activiTy such as jogging, dancing. cycling, swimming:
a
occasionally {2-3 times per month) (13)[J 2-3 times per week (14)
Q daily (15)
(Please check the best description of how often you particfpate in this activity.)
12. I am up and about at will in my house and outside, I also participate in vigorous physical activity such as compeHtive level sports
Q occasionally (2-3 times per month) (16)
0 2-3 times per week (17) Q daily (18)
(Please check the best description of how often you participate in this activity.)
*actual score obtained is specified in parentheses at end of whichever statement is chosen
Supplementary Figure 1, Lower Extremity Activity Scale24 Reprinted with permission from The Journal of Bone and Joint Surgery, Inc,
Statistical Analysis
Univariate statistics were used to describe all study variables and
obese patients. The preoperative characteristics of patients who were
included in the analyses were compared to those of patients who had
incomplete data at one or two years of follow-up using 2-Sample t-tests for
continuous variables and Pearson's chi-squared tests for categorical
variables.
The percentages of patients who gained, lost, or had no change in
weight from preoperative to two years of follow-up were calculated. The
United States Food and Drug Administration considers a five percent
reduction in weight to be clinically significant weight loss.26 Therefore, patients whose weight decreased by 5% or more were considered to have
lost weight, while patients who weight increased by 5% or more were
considered to have gained weight. All other patients were classified as
having no significant weight change.
The difference in mean change in weight and BMI from
preoperative to one and two years of follow-up was analyzed using a
Paired t-test. We examined mean changes for the entire sample as well as
the subgroups when the sample was stratified by gender and by
pre-operative BMI as either overweight (25::_BMI<30) or obese (BMI:::_30).
Bivariate analyses were performed to determine associations
between weight/BMI at two years and all other study variables, to examine
the unadjusted associations between preoperative LEAS score and
patient characteristics, and to test for collinearity. 2-Sample t-test was
variables with more than two categories, and Pearson's Correlation for
continuous variables as appropriate. Analyses for BMI were repeated
using the Wilcoxon Rank-sum test for variables in two categories, the
Kruskaii-Wallis test for variables with more than two categories, and
Spearman's Correlation for continuous variables.
Multiple linear regression was used to examine the relationship
between preoperative LEAS score and weighUBMI at two years of
follow-up. The primary outcomes, weight and BMI, and the exposure,
preoperative LEAS score, were all treated as continuous variables.
Pre-operative weighUBMI, age, gender, pre-Pre-operative Charnley class were
included in the regression models.
All P values were two-sided, and p<0.05 was considered
statistically significant. Stata Statistical Software version 9.027 was used for all analyses.
Results
Preoperative data were recorded for 219 patients (Figure 1). After
excluding 31 underweight or normal weight patients, postoperative data
were recorded for 188 overweighUobese patients who were followed for a
mean of 21 months. Data were available at one year follow-up for 165
patients (87.8%): 12 patients had no follow-up data and 11 patients had
only two year follow-up data. Data were available at two years for 152
only one year follow-up data. Patients were excluded due to death,
untimely follow-up, refusal to return for follow-up, or were lost to follow-up.
Overall, 141 patients had preoperative, one-year, and two year follow-up
data; 11 had preoperative and two-year data only; 24 had preoperative
and one-year data only; and 12 had preoperative data only.
219 consecutive TKA patients ( 17 had staged bilateral TKA during the study period)
31 excluded because of BMI < 25 kg/m2
188 overweight or obese patients
12 patients 24 patients without · with only 1 follow-up data year follow-up
data
~
5 missed I and 2 year 9 missed 2 yr follow-up visits follow-up visit11 patients
I died l died 141 patients
6 lost or refused 14 lost or refused with 1 and 2 with only 2 follow-up follow-up year follow-up year follow-up
data data (missed 1 year fOllow-up visit)
152 total patients with 2 year follow-up data
Characteristics of All TKA Patients
One hundred and forty-three patients (65%) had a unilateral
arthroplasty, 59 (27%) had one-stage bilateral arthroplasty, and 17 (8%)
had staged bilateral arthroplasty. One hundred and sixty-one patients
(74%) were female and 58 (26%) were male. The mean age was 71.5
years (range 41-94 years). The preoperative diagnosis was osteoarthritis
in 185 patients (84%); rheumatoid arthritis in 12 (5%); osteonecrosis in 6
(3%); psoriatic arthritis in 5 (2%); traumatic arthritis in 4 (2%): and a
variety of other diagnoses in 6 (4%).
Characteristics of Overweight/Obese Patients
Preoperatively, 188 patients (86%) were classified by BMI as either
overweight or obese (Table 1). Of these, 100 patients (53%) were
overweight, 52 (28%) were in obesity class I, 32 (17%) were in obesity
class II, and 4 (2%) had extreme obesity. Among overweight or obese
patients, 123 (65%) patients had a unilateral arthroplasty, 50 (26.5%) had
one-stage bilateral arthroplasty, and 16 (8.5%) had staged bilateral
arthroplasty. One hundred and forty patients (74%) were female and 48
(26%) were male. The mean age was 71 years (range 41-89) The
preoperative orthopaedic diagnosis was osteoarthritis in 160 (85%);
rheumatoid arthritis in 10 (5%); psoriatic arthritis in 5 (3%); osteonecrosis
in 4 (2%); traumatic arthritis in 4 (2%); and a variety of other diagnoses in
differences existed between overweight/obese patients who were included
in the analyses and those patients who were not interviewed or lacked
LEAS data at two years of follow-up.
Table 1. Preoperative Characteristics of Overweight or Obese Patients (n=188)
Characteristic Mean (s.d) or range
percent
Mean aqe 70.9 (8.7) 41-89
%Female . 74
Mean weight (kg) 84.9 (12.6) 54.4-117.0
Mean body mass index (kq/m") 30.8 (4.0) 25-42.1
BMI classification
Overweight (25.:::_BMI<30) 53
Obesity class I (30.:::_BMI<35) 28 Obesity class II (35.:::_BMI<40) 17
Morbidly obese (BMI>40) 2
Mean activity level 7.9 (2.7) 2-17
Charnley
Class A 23 ..
Class B 42
Class C 35
Staging
Unilateral 65
One-stage bilateral 26.5
Staged bilateral 8.5
Diagnosis
Osteoarthritis 85
Rheumatoid arthritis 5
Other 10
When the sample was stratified by gender, female patients had
significantly lower weight (p<0.001), greater BMI (p=0.03), and lower
activity level (p=0.002) than did male patients. Males and females did not
different significantly on other preoperative characteristics (data not
The percent of patients who gained, lost, or had no change in
weight from preoperative to two years of follow-up were calculated. At two
years of follow-up, 17% of patients had lost weight _::5% of body weight,
23% had gained _::5% of body weight, and 60% had <5% change in
weight. These percentages did not differ by gender or preoperative obesity
status (data not shown).
T bl 2 a e : Patient Weight Change at 2Y ears Postop eratively .* 2 Years
Postoperatively (n=152)
% Lost Weight 17
% No Weight Change 60
% Gained Weight 23
*Weight change IS _::5% or _:::_5% of we1ght from preoperative
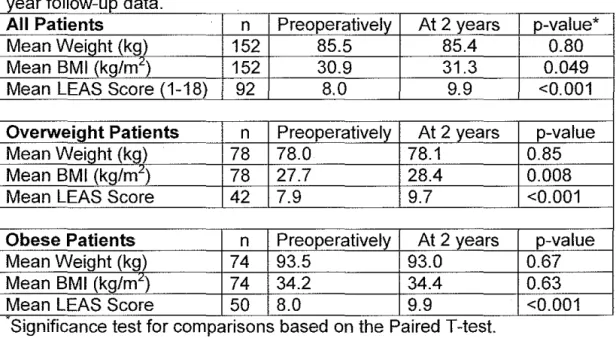
At two years postoperatively, no significant mean weight loss was
found, but mean BMI increased (Table 3). Mean postoperative weight loss
was 0.14 kg (95% Cl: -1.3-1.0, p=0.80). Mean postoperative BMI at two
years increased by 0.46 kg/m2 (95% Cl: 0.00-0.92, p=0.049). When patients with preoperative and one year follow-up data were analyzed, no
significant weight or BMI changes were detected (data not shown).
Mean changes were also examined with patients stratified by
gender and by preoperative BMI as overweight (25_::BMI<30) and obese
(BMI_::30). When patients were stratified by gender, no significant mean
weight loss was found and the increase in BMI was no longer statistically
significant (data not shown). When patients were stratified by preoperative
significantly among overweight patients but not among obese patients
(Table 3).
LEAS scores were available preoperatively, at one and at
two-years for 87 overweight and obese patients (46%), preoperatively and at
one-year for 116 patients (62%), and preoperatively and at two-years for
92 patients (49%). Mean LEAS activity level increased significantly
postoperatively (Table 3). Mean activity score increased by 1.8 points
(95% Cl: 1.3-2.3, p<0.001) from preoperative to year two. Significant
changes in mean activity level were also found among patients with one
year of follow-up, among female and male patients (data not shown), and
among overweight and obese patients (Table 3).
Table 3: Comparison of Mean Weight, BMI, and Activity for Patients with 2
f II d
year o ow-up ata.
All Patients .
n Preoperatively At 2 years p-value*
Mean Wei~ht (kg) 152 85.5 85.4 0.80
Mean BMI (kg/m") 152 30.9 31.3 0.049
Mean LEAS Score (1-18) 92 8.0 9.9 <0.001
Overweight Patients n Preoperatively At 2 years p-value
Mean Weight (kg) 78 78.0 78.1 0.85
Mean BMI (kg/m") 78 27.7 28.4 0.008
Mean LEAS Score 42 7.9 9.7 <0.001
Obese Patients n Preoperatively At 2 years p-value
Mean Weight (kg) 74 93.5 93.0 0.67
Mean BMI (kg/mL) 74 34.2 34.4 0.63
Mean LEAS Score 50 8.0 9.9 <0.001
..
S1gmf1cance test for compansons based on the Pa1red T-test.
Several significant associations were detected between patient
characteristics and weight, BMI, and preoperative LEAS. Age and
the p<0.001 significance level. Similarly, age and preoperative BMI were
positively correlated with postoperative BMI (p<0.001). Males were more
likely to have higher weights after two years (p<0.001 ). Females tended to
have higher BMI after two years, but this was not statistically significant
when BMI was assumed to have a non-parametric distribution (p=0.07).
When patients were stratified by preoperative BMI, obese patients were
significantly younger than overweight patients (p<0.001). Preoperative
LEAS score was significantly higher among males patients (p=0.002).
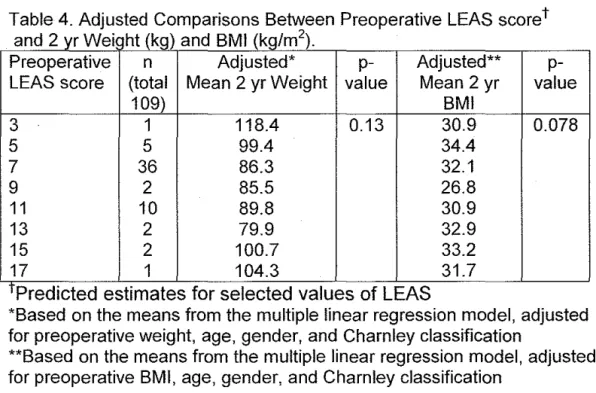
Multiple linear regression was also used to identify the relationship
between preoperative LEAS score and weighUBMI at two years, adjusted
for covariates. The models included preoperative LEAS score,
preoperative weight or BMI, age, gender, and preoperative Charnley
classification as covariates. Preoperative LEAS score is not associated
with weight or BMI at two years postoperatively (Table 4).
Table 4. Adjusted Comparisons Between Preoperative LEAS scoret an d 2 yr W . ht (k ) el g an d BMI (k (g,m . I 2)
Preoperative n Adjusted* p- Adjusted**
p-LEAS score (total Mean 2 yr Weight value Mean 2 yr value
109) BMI
3 1 118.4 0.13 30.9 0.078
5 5 99.4 34.4
7 36 86.3 32.1
9 2 85.5 26.8
11 10 89.8 30.9
13 2 79.9 32.9
15 2 100.7 33.2
17 1 104.3 31.7
T Predicted est1mates for selected values of LEAS
*Based on the means from the multiple linear regression model, adjusted for preoperative weight, age, gender, and Charnley classification
Discussion
Two years after primary total knee arthroplasty, this cohort of
overweight and obese patients experienced no change in mean weight,
but an increase in mean BMI. These findings occurred despite an
apparent increase in activity level. Only 17% of patients had lost :::5% of
body weight by two years postoperatively. Preoperative LEAS score was
not associated with weight or BMI at two years.
Although we were unable to identify which patients were most likely
to lose weight after arthroplasty, 17% of patients did lose a notable
amount of weight two years after total knee arthroplasty. It is not clear if
this is higher or lower than the percentage of all overweight or obese
adults aged 41-89 in the general population who experience weight loss
over two years. Perhaps total knee arthroplasty does allow some
overweight/obese patients to lose weight more easily than they would
without arthroplasty. However, this question is beyond the scope of our
study.
These results are similar to those found in previous studies of
weight or BMI change among total knee arthroplasty patients. Neither
Woodruff and Stone,16 following 68 knee patients, nor Heisel et al.,17
examining 45 knee patients, found a significant change in mean weight.
Similarly, Pritchett and Bortel found that 45 morbidly obese women had no
overweight and obese patients even when statistical power was increased
by including 152 patients in our analyses.
Unlike previous studies of knee arthroplasty patients, we also
examined change in BMI. Often studies of weight change among adults do
not include BMI because adult height generally remains constant.
However, decreasing height with age is well-documented,28 and we found that many of our patients lost height over the two year period. This height
reduction may explain why BMI, but not weight increased significantly at
two years of follow-up.
We examined preoperative LEAS score in an attempt to identify
which patients were most likely to experience weight or BMI change two
years after arthroplasty. Preoperative LEAS score was not significantly
associated with weight or BMI change at two years. The relationship
between weight and activity is unclear. Similar to our results, Elia et al.
found no correlation between physical activity and BMI in subjects over
age 65,29 but McClung et al. reported that lower activity, measured with a pedometer, was associated with a higher BMI among 151 hip and knee
arthroplasty patients.23 This disagreement may result from the differences in the tools used to measure typical activity.
This study has several limitations. Although it was a prospective
study, the case series design increased the potential for both confounding
and selection bias. While we examined the relationship between
total hip arthroplasty patients about their weight postoperatively and
reported that many factors influenced postoperative weight change
including illness, change in diet, and enjoyment offood.18 Although we analyzed co-morbidities limiting ambulation using a modified Charnley
classification, we did not identify all co-morbidities that may have affected
weight change in this population.
In addition, only 81% of patients had weight/BMI data at two years
and 49% had completed the LEAS both preoperatively and at two years.
Although no significant differences in preoperative characteristics were
detected between patients who were included and excluded in weight/BMI
or LEAS analyses, unknown differences may exist between patients who
returned for follow-up and those who were not interviewed at follow-up or
between patients who completed the LEAS form and those who failed to
complete the LEAS form.
The validity of these findings is strengthened by our large
consecutive sample with a robust follow-up percentage. One surgeon
interviewed and operated on all patients, and two trained personnel
performed all weight and height measurements. Unlike previous studies,
we limited our population to only overweight and obese primary total knee
arthroplasty patients and followed patients until two years post-operatively.
The generalizability of these results may be limited to patients
having total knee arthroplasty at academic medical centers in the
because the characteristics of our population are comparable to most
populations of patients undergoing primary total knee arthroplasty in the
United States.2
The findings of this study have important implications for patient
expectations and counseling prior to primary total knee arthroplasty.
Although increased patient weight does not prevent a successful surgical
outcome, overweight and obese patients should not expect total knee
Introduction Addendum (Background and Systematic Review)
Background
Overweight and Obesity in the United States
Quetelet's Index or Body Mass Index (BMI), defined by the ratio of
body weight in kilograms divided by the height in meters squared, 30 is often used to define overweight and obese.31 Frequently, people with BMI greater or equal to 25 kg/m2 are considered overweight and people with BMI greater or equal to 30 kg/m2 are considered obese31 The National Heart, Lung, and Blood Institute guidelines divide patients into more
specific, but also commonly used risk categories. Individuals are classified
as underweight (BMI<18.5 kg/m2), normal (18.5_::BMI<25), overweight
(25_::BMI:<30}, obese/obesity class I (30_::BM1<35), obese/obesity class II
(35_::BMI<40) and extreme obesity/obesity class Ill (BMI_:::40).19
From 1960 to 2002, the prevalence of overweight and obesity in the
American population rose dramatically for people of all ages, sexes, and
racial or ethnic groups. Mean weight for both adult men and women
increased by more than 24 pounds. Mean BMI increased from 25.1 kg/m2 to 27.8 kg/m2 among men aged 20-7 4 and from 24.9 kg/m2 to 28.2 kg/m2 among women aged 20-7432
As the general population of the United States has become more
overweight, so have those in the age-groups requiring total knee
performed on patients greater than 60 years of age. The NHANES Survey
from 1999-2001 indicates that most men and women 60 years of age or
older are overweight or obese. Seventy-four percent of men 60 years or
older are overweight (BMI_:::_25) and 32% are obese (BMI_:::_30). Similarly,
68% of women 60 years or older are overweight (BMI_:::_25) and 32% are
obese (BMI_:::_30).34
This trend has implications for physicians who care for patients with
knee osteoarthritis (OA) and for surgeons who perform total knee
arthroplasty. These physicians must be prepared to discuss with their
patients the influence of increased weight on OA of the knee and the
effect of obesity on surgical outcome of total knee arthroplasty.
Osteoarthritis of the Knee
OA is the most common form of arthritis, and more than 70.% of
total knee or hip arthroplasties are performed for symptomatic OA.35 Six percent of adults 30 years or older have symptomatic knee OA and
disease prevalence increases with age.36 Over the age of 50, women have a higher prevalence of symptomatic knee OA than do men. 3 In the
Framingham Osteoarthritis Study, men and women aged 63-94 had
similar prevalence of radiographic OA, but 31% of women reported knee
Obesity and Osteoarthritis of the Knee
Several cross-sectional population-based studies have shown an
association between obesity and OA. Data from the National Health and
Nutrition Examination Survey of 1971-1975 (HANES I) identified a
dose-response relation between current BMI and radiographic OA of the knee
(p for trend<0.001).38 In addition, among women, there was a significant association between self-reported minimum adult weight, a proxy for
long-term obesity, and radiographic OA of the knee (RR=2.66, 95% Cl,
1.60-4.42). Similarly, the Behavioral Risk Factor Surveillance System in 2001
found that people with a BMI of 25-29.9 have 1.38 (95% Cl, 1.31-1.44)
times the odds of self-reported arthritis than do people of normal weight,
adjusted for covariates39 The adjusted odds of arthritis increased to 2.03
(95% Cl, 1.92-1.44) and 4.41 (95% Cl, 3.91-4.97) for those with a BMI of
30-39.9 and BMI greater than 40, respectively.
While cross-sectional studies can only note associations, multiple
cohort studies provide evidence that overweight/obesity is a strong risk
factor for knee OA. Using the Framingham cohort, Felson et al. examined
whether preoperative weight increased the risk of radiographic knee OA
about 35 years later40 Adjusting for covariates, they found that women in the highest (RR=1.44; 95% Cl, 1.11-1.86) and second quintiles of weight
(RR=2.07; 95% Cl, 1.67-2.55) and men in the highest quintile of weight
(RR=1.51; 95% Cl, 1.14-1.98) had a significantly higher risk of OA than
The increase in risk was similar for both symptomatic and asymptomatic
patients suggesting that obesity is contributing to knee OA, rather than
severe knee pain leading to a sedentary lifestyle and obesity.
More recently, findings from the Framingham Osteoarthritis Study
noted that higher BMI increased the risk of incident radiographic knee OA
10 years later (OR=1.6 per 5-unit increase; 95% Cl, 1.2-2.2).41 Moreover, weight gain over 10 years was associated with the development of OA
(OR=1.4 per 1 0-lb; 95% Cl, 1.1-1.8). Spector et al. examined another
subgroup in the Framingham Osteoarthritis Study, middle-age women in
with radiographic unilateral knee OA, and found that BMI was the
strongest risk factor for incident OA in the contralateral knee, but the
relative risk was not significant.42
Two studies from Northern Europe have looked at the relationship
between BMI and clinically significant knee OA potentially leading to total
knee arthroplasty. A cohort study of Finnish farmers followed for 10 years
found that BMI was predictor of disabling knee OA.43 The adjusted relative risk was 1.4 (95% Cl, 1.2-1.5) per standard deviation of BMI (3.8 kg/m2).
Jarvholrn et al. used total knee arthroplasty as a proxy for severe knee
OA, and noted that among Swedish male construction workers higher BMI
increased the risk of OA!arthroplasty both for men with high BMI and for
men within the range of normal BMI.44
Evidence suggesting that weight loss decreases the risk of
to strength this relationship. Among both all women and overweight
women (BMI:::_25) in the Framingham Osteoarthritis Study, a decrease in
BMI of 2 units or more over 10 years decreased the odds for developing
symptomatic OA by over 50% (p=0.02)45 Another study found that when overweight and obese older adults with knee OA participated in an
18-month trial of diet and exercise, each pound of weight lost resulted in
4-fold reduction in the load exerted on the knee per step while walking.46 While the study did not correlate load reduction to any patient-oriented
outcomes, the authors suggest that a reduction of this magnitude would
likely be clinically meaningful when accumulated over thousands of steps
per day46
The biological mechanism by which excess weight may cause OA
is still not completely clear, but may be due to both local mechanical
stress and some systemic factor(s).47 Evidence for the load theory is especially strong for knee OA because the force of body weight is
multiplied many times as the load moves over the knee joint. The increase
force on the joint is thought to induce cartilage breakdown or cause failure
of ligamentous or other structural support leading to OA. 3 Unknown systemic factors, perhaps a circulating cartilage growth factor or bone
factor, may contribute to this relationship as well by accelerating cartilage
breakdown47 This systemic theory is supported by a few studies showing
that obesity increases the risk of OA of the hand, even though obesity
addition, most studies show that the relationship between obesity and OA
is stronger in women than in men, which has not been explained by the
load theory3· 47
Outcomes of Total Knee Arthroplasty in Obese Patients
Since obesity is a risk factor for knee OA, both obese and morbidly
obese patients commonly have total knee arthroplasty. In the past, high
patient weight has been considered a relative contraindication for total
knee arthroplasty.6 One study examining long-term outcomes found that the best results, based on Knee Society scores and ten-year survival
rates, were in non-obese women with OA over the age of 60, who had a
ten-year survival rate of 99.4%.12 Obese men with OA who were less than 60 years of age had the worse results and a ten-year survival rate of
35.7%.
Many other cases series have also compared the total knee
arthroplasty outcomes of obese or morbidly obese patients to non-obese
or normal weight patients. Overall, the evidence suggests that obese
patients can have successful total knee arthroplasty with only a slight
increase jn intra-operative and postoperative complications. The extent
and severity of the complications, however, is controversial. Moreover,
since total knee arthroplasty is an elective procedure and patients are not
randomly selected, these obese patients may only represent those
surgery. These studies may also over-represent wealthy individuals who
are well-insured, receive good medical care, and perhaps, have less
advanced disease.
Preoperative morbidity and a several peri-operative complications
are thought to be higher among obese patients undergoing total knee
arthroplasty. Miric et al., examining an extensive number of complications,
found positive correlations between BMI and cardiac history (p=0.02),
history of diabetes (p=0.006), postoperative hospital stays longer than 7
days (p=0.03), discharge to rehabilitation facility (p=0.02), and the risk of a
postoperative complication (p=0.004)49 The greatest differences were
detected between patients with BMI<35 and patients with BMI:::35.
Patients with BMI:::35 were more likely than lighter patients to have a
complication (p=0.002) as well as to experience multiple complications
(p=0.03). In contrast, Jiganti et al. found that total hip and knee
arthroplasty patients greater than 20% of ideal body weight were actually
less likely to experience a minor or major peri-operative complication than
lighter patients.7 Longer operative times among obese patients was the
only outcome which reached statistical significance.
Few clinical differences have been detected between obese and
non-obese patients after short-term follow-up. Stern and lnsall found that
total knee patients whose weight was greater than 120% of desired weight
had no overall difference in Hospital of Special Surgery scores after 2-5
desired weight did report significantly more patellofemoral symptoms
(p<0.03). Smith et al. found that in total knee arthroplasty patients with two
years of follow-up all differences between obese and non-obese patients
in Hospital of Special Surgery scores, incidence of radiolucencies on
x-ray, and peak extension torque disappeared after adjusting for gender and
age.6 Similarly, Konig et al. found that overall Knee Society score
(including knee and function scores) and knee score were not influenced
by BMI, but higher BMI predicted a lower function score at a minimum of
two years of follow-up. 50 In contrast, Foran et al. found that although obese and non-obese patient had similar preoperative knee and function
Knee Society scores, patients with a BMI~30 had significantly lower knee
and function scores five years after total knee arthroplasty. 51
Short-term improvement and satisfaction is reported for both obese
and non-obese patients after total knee arthroplasty. Deshmukh et al.
noted definite improvements in both the Nottingham Health Profile and
Knee Society score one year after total knee arthroplasty regardless of
BMI.10 The results from a voluntary survey of over 1600 hip and knee arthroplasty patients found no difference in between patient satisfaction
and decision to repeat surgery one year after arthroplasty9 In addition, no difference were detected by BMI in change in physical or mental
component summaries of the Short Form-36 or in change in Western
survey did find that BMI was significantly associated with an increase risk
of having difficulty descending or ascending stairs one year after surgery.
Since obese patients have a higher risk of knee OA, perhaps due to
greater mechanical loading of the knee, obese patients might also "wear
out" their joints faster. However, evidence shows that obese patients can
have successful total knee arthroplasty in the long-term. Spicer et al.
found that obese (BM1:::30) and non-obese (BMI<30) patients had similar
ten-year survivorship figures and no differences in revisions or change in
Knee Society scores.8 The authors noted that obese patients had lower preoperative Knee Society scores leading to lower postoperative scores,
and although there was no difference in linear radiolucencies, obese
patients had significantly more focal osteolysis on x-ray examination.
Griffin et al. found that after ten years of follow-up, obese patients
(BMI-:::30) had lower Knee Society function scores and more patellofemoral
symptoms than non-obese patients (BMI<30). However, no differences
were detected in overall Knee Society score, Hospital of Special Surgery
score, or revision rates.13
Obese and non-obese patients may have different natural histories
of total knee arthroplasty over the long-term. Foran et al. followed patients
for 15 years and noted that differences in failure rates between obese
(BMI:::30) and non-obese (BMI<30) patients did not become statistically
significant until after 14 years of follow-up.52 After 15 years, non-obese
revisions suggesting increased wear from active use. On the other hand,
obese patients, although not statistically significant, had a trend toward
greater rates of aseptic loosening, which may be due to increase stress at
the bone-prosthesis interface. 52 Similarly, Ranawat et al. found that
patients who weighted more than 80 kg had significantly lower
survivorship after 15 years, and in their series of 112 knees, all patients
with radiographically loose components weighed more than 80 kg.5 Since total knee arthroplasty survival rates reflect wear and use rather than time,
obese patients may have successful long-term outcomes despite
increased mechanical load, because higher BMI has been associated with
lower activity in total joint arthroplasty patients.23
Although evidence suggests that obese patients can have a
successful outcome with total knee arthroplasty, morbidly obese patients
may be at a greater risk for complications. Pritchett and Bortel found that,
compared to non-obese women, morbidly obese women, who on average
were 200% of ideal body weight, had greater operative blood loss and
longer hospital stays as well as more patellofemoral symptoms and fewer
good or excellent Knee Society scores at a mean follow-up of 33
months.15 After five years of follow-up, Winiarsky et al. noted that morbidly
obese patients (BMI~40) had significantly lower Knee Society scores
(p<0.0001) and higher peri-operative complications (p<0.0001 ), including
increased problems with primary wound-healing, wound infections, and
Systematic Review of the Literature:
Lower extremity Arthroplasty and Weight/Body Mass Index Change
We conducted a systematic review of the literature to identify
studies examining the association between lower-extremity arthroplasty
and postoperative weight or BMI.
Selection of Articles
The Medline/Pubmed database was searched the using exploded
Medical Subject Headings (MeSH) descriptors: "arthroplasty," "body
weight," and "body mass index". Searches were limited to English
language articles published between January 1980 and April 2006.
Searching the combination of "arthroplasty" and "body weight"
found 97 citations, while searching "arthroplasty" and "body mass index"
found 53 citations. Twenty-three duplicate citations were discarded, and
the remaining 127 titles were assessed for relevance. Inclusion criteria
were that studies pertain to either total hip or total knee arthroplasty and
that the titles contained words related to either weight/BMI (eg.,
"overweight" or "obese" or "weight change") or patient characteristics (eg.
"patient-controllable factors" or "risk factors"), but not including "nutrition"
or "nutritional factors." Eighty-one articles were excluded and the abstracts
of the remaining 46 articles were reviewed. Articles not pertaining to
postoperative weight or BMI changes were excluded. Editorials,
comments, newspaper articles, and review articles were also excluded.
arthroplasty in overweight or obese patients were hand-searched for
articles with titles that appeared relevant to our hypotheses (eg. articles
about "body weight change" or body mass index change").
The search resulted in 5 original research articles examining weight
or body mass index change following total lower extremity arthroplasty
(Appendix Table A). Two were case series,14·16·17one was a prospective
study, 17 one was a retrospective study, 18 and one was a non-randomized comparison study.15 One case series and the prospective study examined postoperative weight of both total knee and hip arthroplasty patients, while
the other case series and the retrospective study examined only total hip
arthroplasty patients. The comparison study examined weight change in
morbidly obese women who elected to undergo total knee arthroplasty
compared to both non-obese women that had arthroplasty and morbidity
obese women who declined arthroplasty.
Appraisal of Literature Examining Weight or Body Mass Index Change Following Lower Extremity Arthroplasty
Internal Validity Ratings
Appendix Table B presents quality rating for each of the five articles
during systematic review of the literature. The articles were assigned
quality ratings by the primary reviewer (AL) using a 1-3 point scale
checklist (1 =poor, 2=fair, 3=good) for each of the components described
below, i.e., setting and study population, measurement and data
quality score assessing internal validity was the average of the individual
component scores.
Selection of Study Population
Selection of the study population was evaluated according to
whether the source population was adequately described and whether the
study population was representative of the source population. Only one
study received a good for adequately describing the source population.18 Two different studies received a good rating on whether the study
population represented the source population.14• 15 In one, the source
population and study population were clearly the same,15 and in the other, the populations were the same except for three patients who were
excluded for incomplete follow-up.14
Most studies received scores of fair or poor because of moderate
potential for selection bias. Without a clear description of the source
population, it was difficult to discern if the study population was
representative. For example, one study population included 100 randomly
selected patients, but how they were selected or who they were selected
from was not described.17 Another study received a score of fair because the authors did not describe a source population, but implied that the
source and study populations were the same.16 Jain et al. received a fair score because 20% of patients failed to return the questionnaire after
Measurements and Data Collection
Measurements were evaluated based on means of data collection,
and identification of the data collectors. Studies received higher scores if
the authors adequately described the method of collecting of weight
and/or height data and any dependent variables analyzed. Reliability and
validity was an important factor in measurement quality score. Studies
received higher measurement scores if data collectors were identified.
Two studies received scores of poor/fair14• 18 and three studies
received scores of poor.15-17 All studies have large potential for
measurement bias. One study mentioned that postoperative weight and
height were self-reported, implying that preoperative weight and height
were measured.18 In addition, while these authors did not mention if their questionnaire was validated, they clearly described the components of the
questionnaire, which included some validated scales. The other four
studies had no mentioned of how weight and/or height were measured.
One study acknowledged the three individuals who collected data.14 Without any description of measurement, it was impossible to know if
either the effect or outcome measures were valid or reliable. Overall,
these studies did a fair job of describing the other dependent variables
that were collected, but did not clearly explain how they were measured or
whether measurements were valid
Measurements and chart reviews were not blinded for any of the
manipulated data, any coding errors are likely be randomly distributed
between patients who gained, lost, or had no change in weight.
Statistical Analysis and Confounding
Quality of analysis was based on the description and use of
appropriate statistical methods and the potential for confounding of the
results.' While the knowledge of the unadjusted relationship between
pre-and postoperative weighUBMI is valuable for patient counseling on
expectations, studies received higher scores if the authors examined or
controlled for any other factors that might influence the relationship.
These studies differed in analytical strategy and the extent of
analysis. One study described the percentage of patients who gained and
lost weight, but received a poor because no method of analysis was
described15 Another study reported the mean absolute weight and BMI change, the correlation between pre-operative BMI and change in BMI,
and the number of patients with unacceptable BMI, acceptable BMI,
overweight BMI, and obese BMI pre- and postoperatively.18 This study received a fair because, while the analysis was more extensive, no
method of statistical analyses was described. The other three looked for a
statistically significant difference between preoperative and postoperative
weighUBMI, 14· 16· 17 and one of these compared changes between
Although several studies stratified by gender, only two studies
examined or attempted to control for other factors, such as preoperative
function or ambulation capacity, that might confound the relationship
between pre- and postoperative weight!BMI. One study also compared
changes in Harris hip scores, which describe hip function, between obese
and non-obese patients, but did not control for preoperative hip score
when examining BMI change.14 Another study, however, examined weight change when patients were stratified by Charnley class, a description of
ambulation capacity.17
Many reasons potentially exist causing patients to gain, lose, or
experience no change in weight!BMI after undergoing total joint
arthroplasty. These could be considered confounders in the relationship,
but most authors sought only to know whether arthroplasty patients
change weight!BMI following arthroplasty regardless of the cause.
Results
Quality of reporting was based on the whether the preoperative
characteristics of study population and weight!BMI changes were
adequately described and easily comprehensible. Higher scores were
given for clear and complete tables and/or figures.
Overall, the preoperative characteristics of study population were
adequately described. The studies varied more in the reporting of the
a poor rating because the authors reported only that no patients sustained
weight loss greater than 20% and that 24% of patients gained 5-15% of
body weight.15 Another study received a fair because the authors did not report the p-vallie for BMI change or a correlation coefficient when they
stated that preoperative BMI and BMI change were uncorrelated.18
Total Knee Arthroplasty
Overall, no studies were able to detect significant difference in
pre-and postoperative weights/BMI among knee arthroplasty patients.
However, these studies may lack the power to detect a statistically
significant difference since they were all limited by small sample sizes
(45-68 patients). Studies found that 24% of morbidly obese female patients 15 and 41.2% of all patients gain weight after arthroplasty.15· 16
Total Hip Arthroplasty
The results on total hip arthroplasty were inconsistent. The study
with large sample (n=140) found that unilateral, uncemented hip
arthroplasty patients had statistically significant weight gain.14 Another study found that the weight gain among all hip arthroplasty patients had
borderline significance, but the weight gain for women undergoing hip
arthroplasty was significant.16 The third study detected that hip resurfacing arthroplasty patients, but not total hip arthroplasty patients had significant
weight gain.17 For these groups with a statistically significant mean weight change, mean weight gain was 1.87-3.2 kg, an amount that may lack
Summary of Internal Validity
The overall quality of the articles in this systematic review was fair
to poor. The potential for both selection bias and measurement bias was
high. The source population was rarely described adequately. In most
studies, the study population appeared to be the same as the source
population, but often the information provided was insufficient to detect
exactly how well the study population represented the source population.
Since most studies were observing the population as a whole,
comparability between groups was not a major concern. Maintenance was
rarely described, and several of the studies excluded all patients without
follow-up data from the analyses. No studies adequately described how
weight and/or height were measured making it difficult to judge the
reliability and validity of measurements. None of the studies attempted to
control for confounders in the relationship between pre- and
post-operative weight/BMI with regression analyses, but some looked for
potential confounding or effect modification by Harris hip score, Charnley
classification, gender, or preoperative weight by stratifying or comparing
the data. Finally, case series and comparative studies are highly
External Validity of Findings from the Systematic Review
External validity of the findings from the systematic review to other
primary total knee arthroplasty patients is discussed in this section. No
quality ratings for external validity were assigned.
Overall, the patients in these study populations were 60-70%
female, had a mean age of 58-71 years, were predominately diagnosed
with OA, and were mostly overweight or obese. While these are the typical
demographics for patients undergoing total joint arthroplasty,2 they may not represent all total knee arthroplasty populations.
Results from the studies on total hip arthroplasty may not apply to
patients undergoing total knee arthroplasty. Knee arthroplasty patients are
often older and heavier than hip arthroplasty patients.16· 17 After the age of
50, women have a higher prevalence of knee OA, but most studies show
that hip OA is more frequent in men a In addition, hip and knee OA may be
associated with different risk factors, and the relationship between obesity
and hip OA is weaker than its association with knee OA.3
In addition, postoperative weight/BMI trends may differ based on
preoperative BMI classification. Several studies combined normal weight
or underweight patients with overweight or obese patients in their
analyses. While we would like for overweight and obese patients to lose
weight postoperatively, weight loss would be undesirable for normal
weight or underweight patients. Although the majority of patients in all
not provide accurate information regarding postoperative expectations for
overweight and obese patients. Another study examined only morbidly
obese women, and since morbidly obese patients likely experience
greater disability due to their weight, these results may not apply to less
obese patients.
Finally, these studies all involved patients at a single hospital or
institute and may not be generalizable to patients outside the facility
catchment area. Patients who receive arthroplasty at university-affiliated
hospitals are probably different from those receiving arthroplasty from an
orthopedist in private practice. In addition, the prevalence of obesity and
the factors that influence weight change are likely to vary by region and
socio-economic status. Therefore, findings from European patients may
Discussion Addendum Research in Context
As discussed above, our findings are similar to those found in
previous studies of weight and BMI change in total joint arthroplasty
patients. Moreover, the increase in activity postoperative was not
surprising. Mechanisms in the existing literature may explain the lack of
weight loss despite an increase in activity. First, increased body weight
generally decreases the ability to be physically active,53 and overweight and obese patients are still faced with this obstacle after successful
surgery. Secondly, the progressive decline in energy turnover with aging29 may prevent these patients from losing any notable amount of weight even
with an increase in physical activity. Moreover, the energy expenditure
resulting from increased activity following total knee arthroplasty is unlikely
to be sufficient to cause weight loss. A study of Caucasian adults found
that an increased energy expenditure from physical activity required for
weight loss or maintenance is approximately 1500-2000 kcal/weeks4
Critical Appraisal of Study Selection of Study Population
Previous studies on weight/BMI change total knee arthroplasty
patients are limited by small sample sizes, ranging from 45-68 patients.
We increased statistical power by including 152 patients in our analyses.
selection bias and limits the generalizability of the findings. We tried to
decrease bias by including a consecutive sample. In addition, we detected
no differences in preoperative characteristics between those who were
included in our analyses and those who were excluded due to incomplete
weight, BMI, or LEAS score data. However, unknown differences may still
exist between these groups. We clearly described who was included in our
study population and their preoperative characteristics so that readers
could decide if these results applied to their patient populations.
Measurements and Data Collection
We clearly described methods of collecting of weight and height
data and all dependent variables analyzed. Weight and height were
accurately measured by trained personnel on one scale. Although patients
remained dressed in clothes and shoes while measured, we do not
believe that this resulted in a systematic bias. Additional weight
contributed by clothing is unlikely to be differential among patient groups
and should be canceled out when weight change is calculated. Moreover,
patients with severe knee arthritis rarely were shoes with substantial
heels.
Measurement of typical physical activity is also likely to be
accurate. The LEAS is a new scale that has not been used extensively in
practice, but has been previously validated. While the only published
arthroplasty, the activity scale is also likely to be accurate in patients
undergoing primary arthroplasty.
A weakness of the LEAS is that it requires patient self-assessment.
A patient completing the scale must choose only one of the eighteen
levels of activity that most closely matches his own activity. Patients with
low literacy, low education, or vision problems may have difficult choosing
the appropriate level. Patients may altogether neglect to complete the
additional sheet of paperwork during their visit. In addition, we examined
whether preoperative activity level is associated with postoperative weight,
and the LEAS may not reliably measure energy expenditure from physical
activity.
Statistical Analyses and Confounding
We clearly described our use of appropriate statistical methods and
assess the potential for confounding of the results. The lack of ability to
control for co-morbid conditions is a substantial limitation that was
discussed above. In addition, we did not adjust for preoperative or
postoperative pain that may limit physical activity and energy expenditure.
In our analyses of the relationship between activity and weight/BMI at two
years, we chose to examine preoperative activity as the exposure rather
than change in activity. Using change in activity as the exposure would
require controlling for preoperative activity, and we were concerned about
There is some concern for incidental significant findings due to
multiple analyses/comparisons in our study. Although we established
questions and hypotheses a priori, perhaps we could have used a
significance level of p<0.01 for secondary questions and subgroup
analyses.
Internal and External Validity
The overall internal validity our results are likely fair to poor as the
study is very susceptible to biases from its study design. However, we
clearly defined and analyzed our study population, performed accurate
measurements, and controlled for several known confounders in attempts
to reduce biases as much as possible.
The external validity of our study is discussed above in detail and is
likely fair. Generalizability of our study is improved because the
preoperative characteristics of our study population resemble the
characteristics of the most American primary knee arthroplasty
populations. 2
Implications for Clinical Practice
These findings confirmed our hypothesis that overweight and obese
patients do not lose weight after arthroplasty despite an increase in typical
physical activity. In this population, total knee arthroplasty should not be
mechanism. Surgeons should screen patients for realistic expectations
prior to surgery and correct any misconceptions they may have about the
operation. Patients should be told that they will, if anything, have more
responsibility for adhering to a healthy diet and exercise postoperatively.
Preoperative counseling may also help prepare patients to change
diet and exercise habits postoperatively. The importance of reduced
caloric intake, in addition to increased physical activity, should be stressed
to patients who believe that arthroplasty will result in weight loss. 55 Counseling on these lifestyle modifications could take place in a primary
care setting prior to referral or incorporated into postoperative
rehabilitation and physical therapy practices.
Physicians should also make preoperative referrals for dietary
counseling or bariatric surgery when appropriate. Notable weight loss
resulting from dieting or bariatric surgery may facilitate later arthroplasty,
and Parvizi et al. demonstrated that morbidity obese patients can have
successful total joint arthroplasty following surgical treatment for obesity.s6 In addition, as the number of overweight and obese persons continues to
increase in the United States, surgeons should be prepared to address
any of potential complications that may arise when operating on obese
Perspectives on Future Research
Future studies relating to this topic would benefit from the use of
comparison or control groups. Comparison groups could include patients
with osteoarthritis who chose not to undergo arthroplasty or participants of
a similar age in the general population. Although only 17% of patients lose
::':.5% of weight following arthroplasty, perhaps they are more likely to lose
weight after two years than those who do not undergo arthroplasty.
Unfortunately, the elective nature of this procedure and the
well-established effectiveness of this procedure with a lack of alternatives
make randomized studies of this question unethical. Additional studies
could also examine the relationship between preoperative BMI
classification as overweight or obese and postoperatively LEAS score or