CHRONIC HEPATITIS C DISEASE IN NORTH CAROLINA:
EPIDEMIOLOGY, HOSPITAL UTILIZATION TRENDS, AND IMPLICATIONS FOR STATE POLICY CHANGE
By Lori K. Carswell November 17, 2006
A Master's paper submitted to the faculty of the University of North Carolina at Chapel Hill in partial fulfillment of the requirements for the degree of Master of Public Health in
the School of Public Health, Public Health Leadership Program.
ACKNOWLEDGEMENTS
This paper would not have been possible without the assistance of the University of North Carolina at Chapel Hill's Cecil B. Sheps Center for Health Services Research, which provided the North Carolina Hospital Discharge Database, Solucient, Fiscal Years 1996-2004. Special thanks to Tom Ricketts and Sandra Greene for approving my request for the data, and to Ann Howard for the programming effort required to provide the database subset used in this paper.
Thanks to William Sollecito, PHLP, and Susan Thompson, Hepatitis C Coordinator for North Carolina, for substantial editorial assistance and advice throughout the preparation of this paper.
The North Carolina Medicaid claims statistics are included thanks to the efforts of J. Timothy Whitmire, Ph.D., North Carolina State Center for Health Statistics.
TABLE OF CONTENTS
Glossary of Terms and Acronyms ... .4
Abstract. ... 6
1. Introduction ... 8
1.1. Goals and Objectives ... 9
2. Global Epidemiology of Chronic Hepatitis C Infection ... 11
2.1. Prevalence by Region ... .11
2.2. Transmission and Risk Factors ... .12
2.3. Co-infection with HIV and Comparisons with HBV ... 13
2.4. Priority ofHCV in Global Health ... .14
3. Epidemiology of Chronic Hepatitis C Infection in the United States ... .l4 3.1. Chronic HCV Prevalence in the United States ... .14
3.2. Risk Factors for HCV in the United States ... 16
3.3. Natural History ofHCV ... 17
3.4. HCV Testing Procedures ... 17
3.5. HCV Treatment.. ... 19
4. Epidemiology of Hepatitis C in North Carolina ... .21
4.1. Prevalence and Mortality ... 21
4.2. Size of Populations at Risk in North Carolina ... 22
4.3. Liver Transplants in North Carolina ... 23
5. Published Estimates and Forecasts of the Cost of Hepatitis C in the United States .... 24
5.1. Existing National Cost of Illness Estimates and Models ... 24
5.2. Implications for North Carolina ... 26
6. Analysis of North Carolina Hospital Inpatient Data and Medicaid Statistics ... 27
6.1. Data Sources ... .27
6.2. Research Questions ... 28
6.3. Methods ... 29
6.4. Results from North Carolina Hospital Inpatient Data ... .31
6.5. Results from North Carolina Medicaid Claims Data ... 36
6.6. Limitations and Strengths of Analysis ... 37
7. HCV Testing Policy in North Carolina and Other States ... 39
7.1. HCV Testing in Other States ... 39
7.2. HCV Testing Programs in North Carolina ... .42
8. Conclusions and Recommendations ... .42
8.1. Sunnnary and Conclusions ... .42
8.2. Recommendations for Further Data Collection and Analysis ... .46
8.3. Recommendations for Policy Change ... .48
Figures and Tables ... 51
Appendix: Supplemental Tables ... 68
GLOSSARY OF TERMS AND ACRONYMS
ALT - alanine aminotransferase, an enzyme produced inside liver cells that may be elevated in people with HCV, indicating possible liver damage; detectable in blood tests. AST - aspartate aminotransferase, another enzyme produced in the liver; elevated levels may indicate liver damage, or other organ or muscle damage.
Ascites- abnormal buildup of abdominal fluid; a complication ofliver disease.
Average annual growth rate- the simple mean of a series of year-on-year growth rates for a quantity observed annually over a time period spanning two or more years. (Example: A stock price is $100 in 2000, $110 in 2001, and $132 in 2002. This represents 1 0% growth in the first year and 20% growth in the second year, so the average annual growth rate is (10% + 20%) /2, or 15%.)
CAGR- Compound Annual Growth Rate- another method of calculating "average" annual growth rates for time series data. CAGR is the annual growth rate that, if applied each year over the time period observed, beginning with the quantity observed for the first year, would yield the quantity observed in the last year. In this paper, CAGR is calculated using the simple formula:
(last year quantity/first year quantity) (1/(lengthoftimeperiod))- 1. Using the example above, the CAGR would be: (132/100) (1/2) -1, or 14.9%. Note that in this example and in many real time series, the average annual growth rate and the CAGR are similar.
CDC- Centers for Disease Control and Prevention.
Cirrhosis -liver damage in which normal liver cells are replaced with scar tissue, blood flow is restricted, and the liver begins to lose function.
Compensated cirrhosis- cirrhosis in which the liver is damaged, but still functioning. Decompensated cirrhosis- cirrhosis in which the liver is severely impaired, usually treatable only by liver transplantation.
Fibrosis- scarring of the liver, occurring in progressive stages and often leading to cirrhosis.
HA V- Hepatitis A virus. HBV- Hepatitis B virus.
HCV- Hepatitis C virus.
ICD-9-CM- International Classification of Diseases, Ninth Revision, Clinical Modification. The official system of assigning codes to diagnoses and procedures associated with hospital utilization in the United States.
ICD-1 0- International Classification of Diseases, Tenth Revision. The coding system used for classification of mortality statistics in the United States and internationally. NHANES- National Health and Nutrition Examination Survey.
Nosocomial- acquired in a hospital setting.
RIBA- recombinant immunoblot assay; a blood test to detect antibodies.
RNA -ribonucleic acid, the genetic material of a virus; RNA blood tests detect presence of actual virus, not just antibodies, in the blood.
Schistosomiasis - a parasitic infection acquired from freshwater sources, in which worms invade the host and release eggs that cause damage to the liver and other organs;
prevalent in parts of Africa, South America and other regions.
s/co ratios- signal-to-cutoff ratios, used to improve the predictive value of screening tests; an s/co value can be identified, for each type of antibody test, that would predict a true anti-HCV-positive test result at least 95% of the time, regardless of the anti-HCV prevalence or other characteristics of the population being tested.
SVR- sustained virological response; indicates that HCV RNA is undetectable in the blood for at least six months following a prescribed course of treatment.
ABSTRACT
Chronic infection with the hepatitis C virus (HCV) is recognized as a rapidly growing global, national, and local public health problem. More than 3 million people in the United States, and 130 million people worldwide, are living with chronic HCV infection. Chronic HCV can progress to serious, debilitating forms ofliver disease, including advanced cirrhosis and liver cancer. Available treatments for HCV are expensive and not always effective, and there is no vaccine to prevent HCV. Published mathematical models and data analyses have predicted and documented dramatic growth in the number of patients in the United States with advanced disease related to HCV, with corresponding increases in hospitalizations and medical costs. However, these analyses used data only through 2001, and were not conducted at the state (North Carolina) level. The objective of this paper is to summarize the current state of knowledge about HCV in North Carolina, with an emphasis on the impact or burden of the disease. With this assessment as a base, the paper identifies areas for further research and policy change.
However, the highest annual growth rates in stays and charges are now seen in the 55-64 age group, reflecting the aging of the population chronically infected with HCV and the gradual progression ofHCV infection to severe forms of liver disease. North Carolina hospital charges attributable to HCV were over $70 million in 2004 (2005 dollars); charges could easily be over $100 million in 2006 if current trends continue. The North Carolina Medicaid program has also experienced growth in the number of recipients with an HCV diagnosis, and associated paid claims amounts, from 2003 through 2005. The number of annual deaths associated with hospital stays for HCV in North Carolina has grown significantly over the past several years. These findings suggest that there is a need for the morbidity, mortality, and societal costs associated with HCV to be more effectively addressed and controlled in North Carolina.
1. INTRODUCTION
Chronic infection with the hepatitis C virus (HCV) is recognized as a growing public health problem globally, nationally, and in many individual states. Chronic HCV is a communicable, blood-borne disease that can progress over time, eventually causing cirrhosis, liver cancer, other forms of debilitating liver disease, and death. Chronic HCV is recognized as a major cause of liver transplants in the United States. Prevalence of positive antibodies, indicating past or present HCV infection in the U.S. population, was recently estimated at 1.6% of the population (4.1 million people), with 1.3% (3.2 million people) having chronic infection.1•2
Long-term chronic HCV disease now represents a growing, significant global health challenge. Published mathematical models ofHCV disease progression and analyses of available data4-7 have predicted and documented dramatic increases in the number of patients with advanced liver disease related to HCV with corresponding increases in hospitalizations and direct medical costs. Available treatments to limit or prevent HCV disease progression are expensive, can cause significant side effects, and have limited effectiveness in many patient subgroups. In contrast to hepatitis A and B (HA V and HBV), no vaccine is currently available for HCV.
Published analyses and models that measure the costs ofHCV 4-7 are not current
and do not provide estimates specific to individual states such as North Carolina. Therefore, there is a need for current, state-specific analyses of available data on HCV disease-related costs. In light of this situation, the North Carolina Hepatitis C Program, Division of Public Health, began an initiative to quantitatively assess the human and economic impact ofHCV disease in North Carolina. The analysis presented in this paper was conducted at the request of the North Carolina Hepatitis C Coordinator and the North Carolina Viral Hepatitis Task Force. The results of this analysis will be reported to the North Carolina Viral Hepatitis Task Force, the North Carolina State Center for Health Statistics, and other state government officials.
1.1: Goals and Objectives. The overall goal of this paper is to quantify the current impact, or disease burden, of chronic HCV in North Carolina. However, this paper is not a formal economic burden-of-illness study. The burden of an illness can be measured in a number of ways, using a variety of measures ranging from simple
economic analyses of direct and indirect medical costs. Comprehensive burden-of-illness studies often measure impacts in quality-adjusted life years (QALYs) or
disability-adjusted life years (DALY s), which are used in formal cost-effectiveness analyses and to inform global resource allocation decisions. For the purpose of this research, the state-level impact (or burden) ofHCV will be measured in terms of the available
epidemiologic data (including prevalence, mortality, and liver transplant data), hospital utilization data (including hospital stays and charges), and state Medicaid claims statistics. Results will be reported in terms that should be familiar and relevant to state and local-level health authorities and policymakers, such as total hospital stays, average hospital charges, and average growth rates over time periods. The terms "impact" and "burden" will be used interchangeably to refer to the specific human and economic effects ofHCV disease that are addressed in this paper.
In brief, the objectives of this paper are:
I) To review the global and national epidemiology of chronic HCV, including prevalence (proportion of the population chronically infected), transmission and risk factors, and testing and treatment issues;
2) To summarize available information on the epidemiology ofHCV in North Carolina, including mortality and liver transplant data, and compare this information with national-level data;
3) To describe previous studies that sought to quantifY the costs ofHCV nationally; 4) To quantifY the human and economic impact ofHCV in North Carolina using
5) To measure trends in North Carolina HCV-related hospital utilization from 1996 through 2004;
6) To describe the current status of free HCV testing programs in North Carolina; 7) To recommend directions for further research and policy change.
Toward these goals, the next three sections of this paper briefly summarize the epidemiology of chronic HCV infection from global, national, and North Carolina perspectives. The fifth section reviews previously published national-level estimates of the current and future medical and other costs associated with HCV. The sixth section of this paper presents an analysis ofHCV-related inpatient hospital stays and charges based on the North Carolina Hospital Discharge Database, and also reports current statistics on the costs ofHCV to the state Medicaid program. The paper concludes with a summary of the status of free HCV screening programs in North Carolina and related policy issues, and recommends steps for further data collection, research, and policy.
2. GLOBAL EPIDEMIOLOGY OF CHRONIC HEPATITIS C INFECTION
2.1: Prevalence by Region. Estimates of global HCV prevalence vary. The World Health Organization estimates that 130 million persons around the world (2% of the global population) are chronically infected with HCV, with 3 to 4 million new infections occurring per year.8 Estimates of prevalence ofHCV in individual countries and communities also vary widely, and typically rely upon cross-sectional seroprevalence studies of convenient populations (such as blood donors) that may not adequately
Cameroon, Guinea, and Egypt, and prevalence between 2.5 and 10% in several countries in Asia (including China and Japan) and Africa, as well as in Ukraine, Romania, and Brazil.10 In North America and in most of Europe, India, and Australia, WHO estimated HCV prevalence to be 1% to 2.5%.10 Prevalence estimates are constantly changing as new studies are regularly published in specific populations within each region.
2.2: Transmission and Risk Factors. Because HCV is transmitted through
human blood contact, the major causes ofHCV infection worldwide are transfusions from unsafe blood supplies, shared needles and drug paraphernalia associated with injection drug use, and re-use of needles and syringes in health care and other settings.9•11
Less commonly, transmission may also occur through sexual and perinatal exposures. Other modes of transmission may include religious and cultural practices such as ear and body piercing, circumcision, and tattooing with unsterilized equipment, although data are insufficient to conclude that these are significant. 9 Unlike hepatitis A (HA V), HCV is not food-borne. HCV is not spread by sneezing, coughing, or casual contact.
In high-income countries such as the United States, Australia, and several countries in Europe, HCV is not highly communicable in most populations. There is strong evidence to conclude that behaviors associated with injection drug use are the primary source of new HCV infections. However, in low- and middle-income
(developing) countries, unscreened blood transfusions and unsafe therapeutic injections are important.9 Efforts are underway to improve screening of blood products in
developing countries and to improve injection practices in medical settings.
15%-20%, the highest in the world. HCV was widely transmitted during the
anti-schistosomiasis campaigns that were undertaken from the 1950s through the 1980s using contaminated injection equipment.12•13 Ironically, schistosomiasis was the major cause of
liver disease in Egypt prior to the 1990s, but HCV is now the predominant cause. An estimated 6 million Egyptians are now chronically infected with HCV, which presents a huge challenge to Egyptian health authorities. Few Egyptian patients have access to chronic HCV treatment.13
2.3: Co-infection with HIV and Comparisons with HBV. The global
epidemiology ofHCV is best understood in the context of two other important causes of death from infectious disease: human immunodeficiency virus (HIV) and hepatitis B virus (HBV). All three diseases are blood-borne with shared routes of transmission and risk factors, such as injection drug use or exposure to un-sterilized needles and other medical equipment. Although vaccines to prevent HBV have been available for more than 20 years, chronic HBV is much more easily transmitted than HCV or HIV and is still far more prevalent than HCV worldwide; an estimated 350 million people are chronically infected with HBV.14 HIV is far less prevalent than HCV, as there are an estimated 39 million people living with HIV/ AIDS.15 About 4 to 5 million people are estimated to be co-infected with HCV and HIV, whereas 2 to 4 million are estimated to be co-infected with HBV and HIV. HCV infection has been found in 25-30% ofHIV-positive individuals, and in 72-95% ofHIV-ofHIV-positive injection drug users.16 Estimates of co-infection rates vary substantially by country and by risk group.
debate, there is evidence suggesting that end-stage liver disease is now a major cause of death in these patients.9•17 HIV infection is known to lead to faster progression
ofHCV-related liver diseases such as cirrhosis.17
2.4: Priority of HCV in Global Health. Unfortunately, no vaccine is yet available to prevent HCV, and the cost of available treatments for chronic HCV is prohibitively high for developing countries. Compared with low-cost, highly effective interventions such as childhood immunization and malaria prevention, HCV is given low priority. Interventions to delay HCV disease progression appear to be uncommon in developing countries. However, HCV transmission could be reduced as a result of cost-effective interventions such as blood and needle safety programs, which are now primarily used to prevent HIV transmission. A recent report of the Disease Control Priorities Project (DCPP) ranked these programs high on a list of cost-effective global health interventions; prevention of alcohol misuse (which could help delay HCV
progression) was also listed as cost-effective.18 Until an HCV vaccine is available and/or treatments to prevent disease progression are cheaper and widely available, global
interventions targeting HCV will probably remain scarce.
3. EPIDEMIOLOGY OF CHRONIC HEPATITIS C INFECTION IN THE
UNITED STATES
confidence interval: 3.1-4.8 million) who had ever been infected with HCV.2 Further RNA testing of anti-HCV-positive participants showed that 73.9% were chronically infected with HCV, corresponding to about 2. 7 million people. These prevalence estimates were recently updated with NHANES data collected from 1999 through 2002. Current prevalence estimates are 1.6% anti-HCV-positive, or 4.1 million people, and 1.3% with chronic HCV infection, or 3.2 million people using current national population estimates.1 Therefore, although incidence of acute HCV has declined significantly since the late 1980s, prevalence of chronic HCV has declined only slightly, and the total U.S. population chronically infected has increased. In the most recent NHANES study,
relatively high prevalences of antibodies to HCV were seen in people between the ages of 40-49 (4.3%); men (2.1 %); non-Hispanic blacks (3.0%), people living below the poverty threshold (3.2%), and current or former injection drug users between the ages of20 and 59 (57.5%). Non-Hispanic black males aged 40-49 had 13.6% anti-HCV prevalence, which was significantly higher than most other demographic groups.
It is important to note that NHANES participants are a representative sample of non-institutionalized civilians living within identifiable United States households.
Affairs estimates that 5-10% of veterans using its health care system are infected with HCV, and offers an HCV testing and education program.Z0•21
3.2: Risk Factors for HCV in the United States. There is consensus among HCV researchers and experts that the primary risk factor for having acquired HCV infection in the United States is a history of either past or present injection drug use or other percutaneous blood exposures, such as receiving blood transfusions before 1992, when highly sensitive screening of donor blood began22 In the most recent NHANES analysis described above, injection drug use was the factor most strongly associated with HCV infection.1 With improvements in the safety of the blood supply, transfusions and other medical procedures are no longer a risk factor for new HCV infections in the United States. Other risk factors include a large number oflifetime sex partners, a history of sexually transmitted diseases, and being born to an infected mother. 22
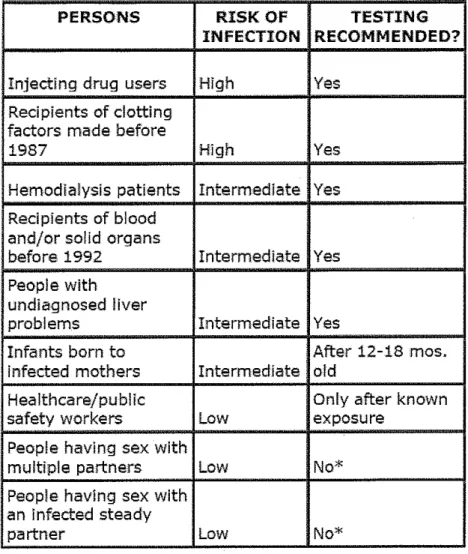
Nosocomial (health care-related) transmission is also possible. Although sexual history is considered a risk factor, long-term spouses of patients with chronic HCV infection are not usually considered to be at significantly elevated risk, although they may choose to be tested for peace of mind. These risk factors are evident in the guidelines CDC currently provides for determining whom should be tested for HCV infection, which appear in Figure I.
3.3: Natural History ofHCV. HCVis an enveloped virus in thejlaviviridae family. HCV exists in at least 6 genotypes; genotype 1 is responsible for most HCV infections in the United States, and genotypes 2 and 3 account for most of the rest.2 After initial (acute) infection, most people are asymptomatic, but some will experience vague flu-like symptoms that usually subside after several weeks. Following initial infection, some people will spontaneously clear the virus, but 60 to 85 percent of people with acute HCV will develop chronic HCV, which is diagnosed by the detection ofHCV RNA in serum for at least 6 months.24 Many patients with chronic HCV remain asymptomatic, but in some patients, the disease slowly and silently progresses to liver fibrosis which may lead to cirrhosis, end-stage liver disease (ESLD), and/or liver cancer (hepatocellular carcinoma, or HCC). The proportion of chronically infected people who develop
cirrhosis within 20 years after initial infection is estimated at 1 0-15 percent overall, with substantial variability related to age at time of infection, gender, immunosuppression from HIV, and other concurrent infections such as HBV. Alcohol use is clearly
associated with more rapid progression of liver disease from HCV?4 Advanced, severe cirrhosis can only be treated by liver transplantation. HCC can also follow fibrosis or cirrhosis, and HCC treatment may also involve liver transplantation. HCV is considered the primary reason for liver transplantation in the United States?4
3.4: HCV Testing Procedures. As discussed earlier and shown in Figure 1, the
CDC recommends testing for HCV infection for people considered to be at increased risk. Testing procedures for HCV are complex and not widely understood, even by many health care professionals25; several different testing methods are used alone or in
("anti-HCV"), possibly using signal-to-cutoff (s/co) ratios, and/or followed by recombinant immunoblot assay (RIBA) to rule out false positives. Antibody tests cannot distinguish between acute, chronic, or resolved (cleared) infection. Therefore, for those testing anti-HCV-positive, nucleic acid (RNA) testing is usually recommended to determine whether the individual is chronically infected. RNA tests may be either qualitative or
quantitative; qualitative tests are more sensitive, but quantitative tests are useful to predict and monitor response to treatment26 Genotype identification is also important in predicting response to treatment and in making treatment decisions, since genotypes 2 and 3 are associated with higher treatment success rates. Additional tests, including liver biopsy, are used to evaluate patients for treatment and to monitor disease progression. Liver biopsy, although not necessarily mandated, is considered the "gold standard" in determining course of treatment.26
The CDC recently recommended a revised laboratory algorithm for HCV antibody testing and reporting, incorporating signal-to-cutoff ratios.Z5 Using a single antibody test without follow-up of positive results is not recommended; as with other screening tests, false positives can occur in populations with low prevalence ofHCV infection,25•26 and false negatives can occur also.
Routine HCV screening of the general adult population is not currently
recommended by CDC or other experts. Routine testing of pregnant women, and of the general adult population at no increased risk, has not been found to be cost-effective using mathematical models.27•28 CDC and the American Gastroenterological Association
have recommended screening all HIV patients for HCV,23•29 but this recommendation
Published analyses of the cost-effectiveness and other issues surrounding HCV testing of HIV patients, and patients with other co-infections, are scarce.
Policies and issues related to HCV screening and testing in North Carolina and other states are discussed further in Section 7 of this paper.
3.5: HCV Treatment. HCV treatment issues are even more complex than HCV testing issues. The goal of treatment is to achieve a sustained virological response (SVR), which is usually defined as a six-month absence of detectable virus following a defined course of treatment. Although relapses do occur, the long-term prognosis for patients who clear the virus is excellent; successfully treated patients can usually expect no further progression of liver disease, and some experts consider an SVR to be
equivalent to a cure. The current "gold standard" of treatment is pegylated interferon alfa, injected once a week, plus oral ribavirin daily, for up to 48 weeks; the duration of treatment varies depending on the patient's HCV genotype and response to treatment during the first 12 weeks.26•29•30 The overall proportion of patients who achieve an SVR
has been estimated at 54% to 56%. Patients with genotypes 2 and 3 respond more quickly and are more likely to achieve an SVR than patients with genotype 1.Z6•30
Research is ongoing to determine the optimal treatment strategies for individual patients, based on early virological response, viral load, and other factors.30
autoimmune disorders, and many other medical problems.29 Patient groups not
recommended for treatment include pregnant women, people with uncontrolled mental illness, and people with other severe co-morbid conditions. Patients who already have decompensated (advanced) cirrhosis are not treatable, but instead are referred for liver transplantation. Patients who are current injection drug users or alcohol abusers are recommended for HCV treatment only in conjunction with treatment for these
behaviors.29 Because of the complexities involved in treating HIV and HCV co-infected people, data are scarce to support HCV treatment decisions for HIV -positive individuals, but existing models suggest that HCV treatment can be successful and cost-effective in this population; additional research is needed.31•32
The cost ofHCV treatment is typically quite high, depending upon the length of therapy and the combination of medications used. Salomon et ai33 estimated the cost of a standard 48-week course of combination therapy for genotype 1 at $18,507 in 2001 US dollars, not including the associated costs for medical evaluation and monitoring.
Published average wholesale prices for one of the pegylated interferon products, Roche's Pegasys ™, were more than $1500 per month in 2005.34 These prices do not include the costs associated with testing, monitoring, and medications possibly prescribed to combat side effects, such as anti-depressants.
number of patients undergoing treatment, the proportion of patients achieving SVR, and similar measures. In summary, more efficacious and less expensive therapies are desperately needed to treat chronic HCV patients. Fortunately, several newer therapies are in clinical trials, and some of these should become available within the next five years. 35,36
4. EPIDEMIOLOGY OF HEPATITIS C IN NORTH CAROLINA
4.1: Prevalence and Mortality. Reliable prevalence estimates for chronic HCV are generally unavailable at the state level. Although some states have surveillance systems for chronic HCV, most states estimate the number of residents with chronic HCV by extrapolating the national prevalence estimates from NHANES to the state population. The complexity of testing need to diagnose either acute or chronic HCV, and the need to use additional RNA testing to confirm chronic disease, hinder any state's ability to use surveillance systems to monitor prevalence of chronic disease.
Chronic HCV is not a reportable disease in North Carolina, although acute HCV is reportable; North Carolina uses the most current (2004) CDC acute HCV case
definition of acute HCV to screen suspected cases. This definition is restrictive,
about the prevalence ofHCV antibodies in North Carolina residents, nor about the prevalence or burden of chronic HCV in the state.
Mortality data is obtained from death certificates, using the ICD-1 0 disease codes for classification of the underlying cause of death. North Carolina imd United States deaths and age-adjusted death rates for 1999 through 2003, for acute and chronic HCV combined, appear in Table I. The age-adjusted death rates for both the state and the country increased between 1999 and 2001, and then were fairly stable for 2001 through 2003. The proportion of the United States deaths that occurred in North Carolina grew from 2.1% to 2.6% during this period of time. In 2003, the death rate per I 00,000
persons from HCV in North Carolina was 1.4, compared with 1.6 for the United States as a whole.
Because these statistics do not include all deaths possibly caused by HCV from conditions such as advanced liver disease or liver cancer, they are clearly underestimates of the mortality associated with HCV. However, deaths from those related conditions could be attributed to other causes, such as HBV. Therefore, without making additional assumptions (such as the proportion of deaths from liver cancer, cirrhosis, etc., that are attributable to HCV), the state and national mortality statistics are oflimited use in determining the absolute impact ofHCV in North Carolina. Additional comparisons of the North Carolina and U.S. populations with respect to HCV risk factors are given in the next section.
prisoners, and HN-infected individuals living in North Carolina, compared with the United States as a whole, because these groups have been identified as high-risk for chronic HCV disease. As shown in Table 2, North Carolina is now home to about 2.9% of the US population. 39 The gender and age distributions in North Carolina are very similar to those in the U.S. as a whole. Table 2 also shows that North Carolina has a proportionally greater population of minorities, especially African-Americans, and more African-American men compared with the U.S. as a whole. North Carolina also has more people living with HIV/AIDS than does the United States overall, but North Carolina has fewer prisoners per 100,000 persons than in the U.S. overall.
As discussed earlier and shown in NHANES and other research, current or former injection drug users are probably the group at highest risk for acute or chronic HCV infection. Unfortunately, data are scarce to determine the number of current or former injection drug users in North Carolina. Some national surveys of drug abuse, such as the National Survey on Drug Use and Health, provide estimates of the current national prevalence of injection drug use and other illegal drug use, but data on former injection drug use is difficult to find at the state level.
years. The OPTN states that chronic HCV-associated cirrhosis has been increasing, and accounted for 43% ofliver transplants in 2004.40
In summary, available epidemiological data, population demographics, and liver transplant data provide only a few clues to the extent of the impact of chronic HCV in North Carolina. Mortality data, population demographics, and liver transplant data suggest that the prevalence and costs ofHCV in North Carolina may be approximately proportional to the national HCV burden, or possibly somewhat lower on a population basis, i.e. between 2.0% and 2.9% of the national burden. The next section of this paper summarizes the findings from earlier, published cost estimates and forecasts of the national impact of chronic HCV.
5. PUBLISHED ESTIMATES AND FORECASTS OF THE COST OF HEPATITIS
C IN THE UNITED STATES
Leigh et al41 developed a detailed, comprehensive estimate of the economic costs ofHCV, using a "top-down" methodology and including both direct and indirect costs. They concluded that in 1997 dollars, HCV cost U.S. society $5.46 billion, of which about one-third ($1.8 billion) were direct costs. Of the direct costs, $1.4 billion were estimated to be medical (not administrative) costs. Leigh eta!. provided comparisons of their assumptions with those of Wong, and defended the accuracy of their comparatively much higher estimates.
Kim et a16 used the Nationwide Inpatient Sample (NIS) of the Healthcare Cost and Utilization Project (HCUP) data, for the year 1995 only, to investigate
hospitalizations, charges, and mortality for liver diseases caused by HCV and, in comparison, alcohol-induced liver disease. They concluded that in 1995, there were 64,800 hospitalizations related to HCV, of which 26,700 were "liver-related"
hospitalizations. Of the 26,700 "HCV and liver-related" hospitalizations, there were 2600 in-hospital deaths. The total hospital charges associated with these hospitalizations were $514 million (in 1995 dollars), and the total in-hospital visit days were 207,600. These results imply an average length of stay of7.8 days per visit, and average charges of $19,251 per visit. Charges per hospitalization varied by a factor of more than 10,
depending on whether liver transplantation occurred. Kim et a! also investigated factors associated with in-hospital death and hospitalization charges.
million in 1998 dollars). Kim also concluded that in 1998, approximately 2% of all hospital discharges listed an HCV diagnosis.
Building on the work of Kim eta!, Grant et a15 investigated growth trends in the inpatient, outpatient, and prescription drug costs associated with HCV. They analyzed the national inpatient database from HCUP through 2001, as well as data from the National Ambulatory Medical Care Survey and the Verispan Source Prescription Audit. Grant et a! found consistent, strong growth trends (22%-31% average annual growth rates), in each ofHCV-related hospitalizations, HCV and liver-related hospitalizations, HCV hospital days, charges, and deaths, for 1994-2001. They also found that outpatient office visits by HCV patients increased at an average annual rate of36%, and that spending for HCV drug treatment increased each year over the time period studied. In the supplemental tables for their paper, they reported 277,430 hospitalizations with a diagnosis ofHCV; 92,694 HCV-and liver-related hospitalizations; and about $2.5 billion in HCV -and-liver-related hospitalization charges in the year 2001.
5.2: Implications for North Carolina. The published analyses summarized in
the previous section are consistent in concluding that the morbidity, mortality, and economic impact of HCV in the United States is substantial and is growing. However, these analyses were conducted at different times and using different methods. The most recent analysis, by Grant eta!, used data only through 2001. These analyses need to be updated in order to determine whether the growth trends in HCV hospitalizations, deaths, and costs have continued beyond 2001.
programs. Therefore, from the point of view of state and local policy, there is a need to determine the size of the economic impact ofHCV in North Carolina, and assess whether state-level indicators such as hospital charges are growing at the very high (20-30% per year) annual rates seen in the national studies conducted previously. Accordingly, the next section of this paper presents an original analysis of the North Carolina Hospital Inpatient Data. Also reported are statistics on the costs ofHCV to the state Medicaid system; these were provided by the North Carolina State Center for Health Statistics. 6. ANALYSIS OF NORTH CAROLINA HOSPITAL INPATIENT DATA AND
MEDICAID STATISTICS
6.1: Data Sources. The major data source used for this analysis was the North Carolina Hospital Inpatient Discharge Database for the fiscal years 1996-2004.42 This time period was chosen because the database does not include the year 1995 (although it does include earlier years); the discontinuity hinders the potential analysis of even longer trends. In addition, a nine-year time period was more than sufficient to answer the key research questions. The database contains discharge records abstracted from claim forms for most hospitals in the state, including acute care licensed hospitals, rehabilitation facilities, and psychiatric and substance abuse facilities, with the exception of four state psychiatric hospitals.43 This database is not a sample; it represents the majority of
Medicaid claims statistics for North Carolina for the calendar years 2003-2005 were requested from and generated by a staff member at the State Center for Health Statistics (J. Timothy Whitmire, SCHS). Data for years before 2003 were not available. For the analysis, the SCHS used a subset of Medicaid claims data in which every claim record had some diagnosis ofHCV. They were unable to include every claim that might have been associated with an HCV diagnosis because some claim types, such as
pharmacy claims, do not include a diagnosis code. Therefore, their results may represent underestimates of the total number of Medicaid patients with HCV and the total costs associated with HCV diagnoses.
6.2: Research Questions. The primary goal of the hospital inpatient data analysis was to quantify North Carolina hospital stays (discharges), days of stay, and inpatient hospital charges, in terms of both annual values and growth trends, by patient groups including age, gender, and payer status. Basic counts, sums, means, and trend statistics, including compound annual growth rates and simple average annual growth rates, were computed as described in the Methods section below and defined in the Glossary. Additional research questions addressed in the inpatient hospital data analysis were the extent of the inpatient mortality associated with HCV and liver-related
diagnoses, and the proportion ofHCV and liver-related hospital discharges in which the patient also had a diagnosis ofHIV/AIDS.
were the years available. The costs to the Medicaid system were determined from actual paid claims records; therefore, they represent variable, direct medical costs to society and to the state government.
6.3: Methods. The same ICD-9-CM diagnosis codes were used to select records from both the hospital inpatient and Medicaid databases. The HCV diagnosis codes and their definitions are shown in table A-1 of the Appendix. Counts of visits with "acute or unspecified" HCV diagnoses were compared with the number of visits with chronic diagnoses in the inpatient database, and with the number of acute HCV disease reports in North Carolina. Based on these comparisons, it appeared likely that the majority of diagnoses of"acute or unspecified" HCV were actually chronic cases. For this reason, and to be consistent with the methods used in previous studies by Kim and Grant, acute/unspecified HCV as well as chronic HCV diagnoses were included in both the hospital inpatient data analysis and the Medicaid data analysis.
Two levels of analysis were conducted using the hospital inpatient database. In the first level, the full database was used, consisting of all discharges (hospital stays) from participating North Carolina hospitals in which any diagnosis ofHCV was recorded, 1996-2004. In the second level analysis, termed the "HCV and liver related" analysis, the database records with HCV diagnoses were partitioned further to create a subset in which the hospital stays and associated charges for this subset are highly likely to be directly attributable to HCV. The criteria used to create this more selective
field, indicating that HCV was the main reason for hospital admission; or if, in addition to a non-primary diagnosis ofHCV, there was also any diagnosis of a form ofliver disease attributable to HCV, such as cirrhosis or other chronic liver disease; liver cancer; ascites (abdominal fluid); or a liver transplantation procedure.
For each level of the analysis, descriptive statistics were computed for North Carolina hospital stays (discharges), days of stay, inpatient hospital charges per stay, and days per stay. Because a small proportion of hospital stays involve liver transplants or other extremely expensive procedures, the distribution of charges per stay is quite
asymmetric. For this reason, both mean and median charges per stay were calculated, and the standard errors for the mean charges per stay are reported for each year. For the "HCV and liver related" analysis, the number and proportion of hospital stays resulting in death and stays for patients co-infected with HIV/AIDS were also determined by age group.
To investigate whether the long-term trend patterns are similar to recent trends, the compound annual growth rate (CAGR) was computed both for the entire nine-year period and also for only the latest four years, 2001 through 2004. The CAGR is a
completeness and to facilitate comparison with previous research. Formulas and further definitions for both measures are provided in the Glossary.
Sampling weights are not included with this database; all observations (hospital stays/discharges) were weighted equally. All hospital charges were adjusted to 2005 dollars using the Medical Consumer Price Index. The data were checked for errors and missing observations. Analysis was also conducted by age group, gender, and payer. For the hospital data analysis, race was not used as a subgroup classification because a
significant percentage of observations contained missing or unknown values for race. For the North Carolina Medicaid claims database, total claim amounts and counts of Medicaid recipients by age group, gender, and race were reported. Because only three years of data were available, the year-on-year growth rates in each of the two intervening years (2003-2004 and 2004-2005) were computed and reported, instead of the CAGR or average annual growth rate.
6.4: Results from North Carolina Hospital Inpatient Data. Results from the analysis of the hospital inpatient database are given in Tables 4 through 11 and Figures 2 through 4, and are summarized in this section. Additional details on the number of hospital discharges by year, for both levels of database analysis, are provided in Tables A-2 and A-3 of the Appendix.
Counts and totals for the number of hospital discharges, hospital days, and total charges were obtained for the entire North Carolina Hospital Inpatient Database, regardless of diagnosis. Growth rate measures (CAGR for the whole time period, average annual growth rates, and CAGR for 2001-04 only) were calculated for
Table 4. Total North Carolina hospital discharges and days grew at annual rates of only about 1% to 2%, over both the longer (1996-2004) and more recent (2001-2004) time periods. North Carolina hospital charges, adjusted for inflation, grew at about 5% per year for the longer time period, and grew more rapidly (8.9% per year) during the most recent years. Total North Carolina hospital discharges and charges were also compared with discharges and charges for stays with any diagnosis ofHCV; the results are shown in Figure 2. The proportion of hospital discharges with any diagnosis ofHCV grew steadily from about 0.2% in 1996 to 1% in 2004, while the proportion of hospital charges with any HCV diagnosis grew steadily from about 0.3% to 1.2%. Although increased awareness ofHCV may be partly responsible for the increasing relative levels ofHCV-related hospital utilization, these trends are still quite striking.
were charged to either Medicaid or Medicare. The annual rates of growth in hospital discharges are currently higher in the Medicaid population than in other payer groups, with a CAGR of more than 20% from 2001-2004.
Although the rate of annual growth in HCV-re1ated discharges appears to be somewhat lower than in the past, it is still quite high. Nearly all subgroups were still experiencing more than 10% annual growth during the past four years; only the 25-34 and 35-44 age groups showed recent growth rates less than 10% per year. Among the age groups, the highest growth rates occurred in the 45-54 and 55-64 age groups (see Table 5); this result is consistent with the predictions of previous research.
growth rates in hospital utilization related to HCV are much higher than the growth rates for overall North Carolina hospital utilization, reported in Table 4.
Table 7 summarizes hospital discharges for the more selective, "HCV and liver related" database subset. Hospital stays included in this analysis are most likely directly attributable to HCV. Hospital discharges attributable to HCV are growing at double-digit (more than 10%) annual rates overall and in most subgroups. The overall rate of growth as measured by the CAGR has slowed somewhat in the past few years, to 12.9% per year. However, in some age groups (45-54 and 55-64), the CAGR is sti1118 to 20 percent. The burden ofHCV hospital visits is heavily concentrated in the 45-54 age group (44% of stays over the entire time period), and it appears to be shifting from younger to older age groups. As the population infected with HCV continues to age, the number of visits in the 25-34 and 35-44 age groups is beginning to decline, as shown in Figure 4. Table 7 also shows that the number of hospital stays is still growing by more than 15% per year for both Medicaid and Medicare recipients. The proportion of stays by gender has not changed over time; men comprise about two-thirds ofHCV and liver-related hospital stays.
Charges for the 35-44 age group have shown slower growth in recent years (6.1% CAGR for 2001-2004), but charges for the 55-64 age group are consistently growing at annual rates exceeding 30%. It can be predicted from Tables 8 and 9 that if hospital charges attributable to HCV continue to grow at these rates (and assuming continued medical price inflation of about 4% per year), the total North Carolina hospital charges for HCV and liver-related stays will be at least $102 million in 2006 ($70.6 x 1.18 x 1.18 x 1.04). This represents a 140% increase compared with the charges incurred in 2001. Based on the age group differences and the growth rates for the 55-64 age group, it seems likely that the Medicaid and Medicare programs will continue to bear a significant burden for HCV and liver-related hospital charges. Tables 7 through 9 can be compared with Table 4; it is clear that North Carolina HCV and liver-related hospital utilization has grown far more rapidly than North Carolina hospital utilization overall.
used in this analysis should identify more HCV-attributable deaths than the reporting system used for death certificates can identify.
As will be discussed further in Sections 7 and 8 of this paper, current research and resources are focusing on the population co-infected with HCV and HIV. For this reason, and for comparison with previous research, the number of hospital stays for patients diagnosed with both HIV/AIDS and HCV and liver-related disease was analyzed. The results appear in Table 11. The number of hospital stays for co-infected patients increased substantially from 1996 to 2004, but these stays remain a relatively small proportion (about 5%) of overall stays. This proportion declined from 1996 through 2004, but is still slightly larger than the national proportion estimate reported by Grant et a!., which was 2 to 3 percent. 5 Slightly different criteria for identifying HIV/ AIDS diagnoses may explain the difference in results.
6.5: Results from North Carolina Medicaid Claims Data. The results from
the North Carolina Medicaid claims database are shown in Tables 12 and 13. In 2005, nearly $32 million was paid from the state Medicaid program for claims with any
diagnosis ofHCV. Trends are difficult to assess because only three years of results were available; therefore, growth rates are given for each one-year growth period. However, it appears that the total paid claim amounts related to HCV grew at rates well above
inflation in 2004 and 2005. The majority of the paid claim amounts were for inpatient hospital visits. Table 13 shows that the number of Medicaid recipients with any
concentrated in the 35-44 and 45-54 age groups, but the proportion in the 35-44 group declined, while the proportions in the 45-54 and 55-64 age groups grew steadily each year; this is consistent with the age group trend patterns seen in the hospital data.
Rather surprisingly, the majority of North Carolina Medicaid recipients with HCV were women; this probably reflects the characteristics of the overall Medicaid population. Recipients diagnosed with HCV represent a fairly small minority of the total North Carolina Medicaid population, which is not surprising since the majority of Medicaid recipients are children, who rarely have HCV disease.
6.6: Limitations and Strengths of Analysis. A limitation to the hospital discharge data analysis is that charges, not actual economic costs, were analyzed. Because hospital inpatient charges may overstate the actual economic costs to society, some researchers advocate using cost-to-charge ratio adjustments, which was not done here (nor was it done in the previous studies by Grant et al and Kim et al.) Cost-to-charge ratios are multipliers that are sometimes applied for each hospital (or by state or region) to approximately convert charges to true, direct hospital costs. However, it is well known that using cost-to-charge ratios still does not guarantee accurate measurement of direct costs. Furthermore, cost-to-charge ratios would only change absolute estimates of hospital charges, and would not significantly affect the measurement of trends.
Therefore, although the charges reported here may be overestimates of the direct hospital costs, the trends are probably fairly accurate.
Another limitation to this analysis is that inpatient hospital charges were the only direct medical costs addressed. Other categories of direct medical costs include
indirect economic costs, such as patients' lost productivity/wages and caregiver costs, were not examined. Other researchers have addressed these categories of costs for HCV, especially in the context of comprehensive cost-effectiveness analyses. However, this analysis is intended to be a descriptive analysis of state-level trends, rather than a
comprehensive cost-effectiveness study. Considering the high expense and low efficacy ofHCV medications, as discussed earlier in this paper, it would be useful to quantify the costs and outcomes ofHCV treatment in North Carolina; this is an area for further research.
A major limitation of this study is that the unit of observation of the inpatient hospital database is hospital stays, not patients. The number of hospital discharges over time is not equivalent to the number of patients, because multiple visits per patient are possible, either within the same year or across multiple years. Because HCV-related conditions can be quite serious and may require long-term treatment, multiple visits per patient are probably quite likely. The data use agreement limits the analysis of the data so that individual patients cannot be identified. Longitudinal analysis, i.e. investigation of patient outcomes over time, was therefore impossible in this study. A patient registry or other primary data source, using individual patient identifiers, would need to be obtained in order to make longitudinal analysis possible.
and charges based on hospital claims, so bias in the data and results is probably minimal. The large number of observations (hospital discharge records) in the database facilitated the reporting of results by age group, gender, and payer status.
In addition, this analysis (in contrast to several previous studies) is not a predictive model based on assumptions about uncertain parameters such as HCV incidence, prevalence, disease progression rates, and disease-state costs; rather, it is a descriptive analysis of trends in actual hospital stays, charges, and Medicaid claims. As such, it provides some indication of recent and current trends in actual costs to society, using minimal assumptions. This analysis helps to answer the question "What is the impact right now?" rather than the question "What might the impact be in the future?"
7. HCV TESTING POLICY IN NORTH CAROLINA AND OTHER STATES
7.1: HCV Testing in Other States. As discussed earlier, HCV testing is
recommended for people considered to be at increased risk of infection. However, there is a variety of guidelines and opinions about which specific populations are at increased risk and should be tested. The few national HCV screening programs that exist have focused on easily identifiable, high-risk populations including prisoners19 and veterans.21 There are many other people at increased risk for HCV who are harder to identify, and who may not have convenient access to HCV screening, counseling, and treatment; these populations include the homeless, former prisoners, people who had blood transfusions before 1992, and current or former injection drug users, including people who
experimented with drugs only briefly or even only once.
shared risk factors for HCV and HIV, and in order to maximize benefits from limited funds, the CDC's National Hepatitis C Prevention Strategy relies upon integrating HCV services into existing public infrastructure for HIV, other STD's, and drug abuse.44 Testing HIV-positive people and others who present at STD clinics for HIV testing may be relatively convenient and inexpensive, compared with reaching out to broader
populations. However, according to CDC estimates, about 1.0 to 1.2 million Americans are living with HIV/AIDS,45 and about 30% of these are co-infected with HCV.46 This equates to about 300,000 to 360,000 co-infected Americans, which is only about 10% of the national population estimated to be chronically infected with HCV. The rates of co-infection with HCV and other STD's are not well known. Therefore, targeting HIV-positive people and other STD patients for HCV testing can probably identify only a small percentage of all people with chronic HCV infections.
Due to the high cost of RNA testing and other follow-up testing, some HCV screening programs provide anti-HCV testing only, without confirming whether positive results are false or whether the infection is resolved or cluonic. Unfortunately, additional testing and follow-up is much more expensive than simple anti-HCV screening, and is therefore more challenging to include in free or reduced-cost testing programs.
Some states, such as Florida and Wisconsin, have used specially designated HCV funds to make HCV testing and other HCV services available for free in many local health departments and other public health clinics.47•48 From a 2004 survey of state HCV
Coordinators, the CDC estimated that 55% of states (22 of 40 states responding) offered any access to HCV testing in publicly funded clinics, such as STD clinics and HIV counseling and testing sites. In addition, 77.5% (31 of 40 states responding) had a registry for tracking cluonic HCV cases49 North Carolina had neither publicly funded HCV testing nor a chronic HCV registry at the time of that survey, and still has neither of these items.
More recently, the National Alliance of State and Territorial AIDS Directors (NASTAD) initiated an assessment of the 52 hepatitis C coordination programs funded by CDC (one coordinator is currently funded for each state, the District of Columbia, and the Indian Health Service). This assessment includes a survey to obtain updated
7.2: HCV Testing Programs in North Carolina. Although free testing for HCV antibodies is not available through local health departments in North Carolina, there are a few free testing programs provided via federal and other grants. The Piedmont HIV Integrated Community Access System (PHI CAS), in collaboration with the Durham County Health Department and the Duke Medical Center, offers a free HCV testing program at the Durham County Health Department. Patients are seen in the Health Department's STD clinic, are assessed, and are offered testing if they have specific risk factors for HCV infection (Beth Stringfield, PHI CAS, oral communication, July 2006). Consistent with the mission of PHI CAS, there is an emphasis on identifYing and providing services for people co-infected with HCV and HIV.50 If continued funds are available, PHI CAS plans to implement HCV testing in Person County as well.
Through the state HIV/STD Branch, one-time funds have been contracted to the Gaston County Health Department to provide free testing for all STD patients and others at risk who are eligible to be screened for HCV. At this time, these are the only two known public facilities or locations at which free HCV screening is available in North Carolina. The North Carolina Viral Hepatitis Task Force is working to identify resources and develop additional programs for HCV testing, education, awareness, and treatment.
The final section of this paper presents conclusions, recommendations for further data collection and analysis, and recommendations for changes to state HCV policy. 8. CONCLUSIONS AND RECOMMENDATIONS
utilization, and costs/charges all show substantial growth rates that cannot be attributed to overall growth in North Carolina hospital utilization. Although annual growth rates for these measures are slightly lower in later years than in the earlier years of the time period stndied, they are still growing in "double digits" (at least 10% CAGR) in nearly all groups, with very high growth rates (more than 30% CAGR) in some population groups. The growth in hospital charges can be attributed mostly to the growth in the number of stays, but is also partly due to recent growth in the average charge per stay.
The trends in hospital utilization measures vary by age group. The burden of HCV hospital stays and charges is now heavily concentrated in the 45-54 age group. The 45-54 and 55-64 age groups are experiencing the highest growth rates in hospital stays and charges directly attributable to HCV. As these "baby boomer" population segments continue to age, new HCV patients are identified, and existing patients continue to experience disease progression, the number of hospital stays and charges for these age groups is almost certain to increase further.
Men continue to experience about two-thirds ofHCV-attributable hospital stays. Medicaid and Medicare continue to bear a substantial burden from HCV, with more than 15% annual growth in hospital visits for people enrolled in these programs through 2004. Deaths associated with HCV-attributable hospital stays increased over the time period analyzed, and about 8% of these stays resulted in death. About 5% of the
Counting all discharges with any HCV diagnosis, HCV was associated with over $200 million in inpatient hospital charges in North Carolina in 2004 (2005 dollars). The North Carolina Medicaid system paid at least $32 million in 2005 for HCV-related claims, of which $25 million was for inpatient hospital visits. Counting only discharges with both HCV and liver-related conditions (very likely due to HCV), HCV was
associated with at least $70 million in inpatient hospital charges statewide. If current trends continue, in 2006, there will be more than $100 million statewide in inpatient hospital charges directly attributable to HCV. Since inpatient hospital costs are only one of many direct and indirect economic cost components, the total economic cost of the disease in North Carolina is clearly even higher. The estimates of inpatient hospital charges presented here can probably be considered a bare-minimum or "lower bound" on the true direct medical costs associated with HCV.
age groups, to the older ( 45-54 and 55-64) age groups. This shift obviously has serious implications for the costs to public programs, especially the Medicare system, over the next decade.
There is no vaccine to prevent HCV. If and when a prophylactic vaccine becomes available, it will not help patients who acquired the infection long ago and who are now experiencing disease progression. Medical treatments and behavioral interventions are available to prevent or delay HCV disease progression. The preferred strategy for controlling the progression of the disease includes testing larger numbers of people in order to identify more of those infected, providing education, counseling, and referral for evaluation, and when appropriate, treating those who test positive with the best available medications.
In North Carolina, there is clearly an opportunity to reduce costs and improve outcomes in the future if more HCV -positive patients are tested and identified early enough to take measures to prevent or delay disease progression. Even individuals who are not candidates for pharmaceutical treatment may need to be tested in order to know their disease status, obtain counseling and additional information, and prevent
8.2: Recommendations for Further Data Collection and Analysis. The
analysis presented in this paper has shown that hospital stays and charges associated with HCV have grown very rapidly for the past several years in North Carolina. There are three additional areas of research that would further augment knowledge about the current burden ofHCV in North Carolina, and would help support the development of state policy and intervention programs. These recommended research topics follow.
1) Obtain and analyze data on the utilization and treatment success rates of
HCV medications in North Carolina. Unfortunately, medications for HCV are
expensive, treatment success rates are relatively low, and side effects of treatment can be significant. Therefore, although HCV treatment has the potential to essentially cure the disease and prevent disease progression, it also has a significant impact on the burden of the disease. The number of patients who have been treated or are now being treated for HCV in North Carolina, the costs of the treatments, success rates, and the funding sources for treatment are all unknown. It is difficult to obtain state-level data on treatment utilization, costs, and outcomes from pharmaceutical firms and their data suppliers. Additional sources of this type of data should therefore be investigated. Sources of this type of information may include large health insurers in North Carolina such as Blue Cross Blue Shield, UNC Health Care, or other private insurers. HIP AA privacy regulations and other barriers may continue to limit the availability of this type of data.
2) Conduct additional data analysis on the burden of HCV in North Carolina
aggregate state-level results, rather than results by county or zip code. Further analysis of state Medicaid records and hospital outpatient and inpatient records would help identify the North Carolina regions and counties that have the largest numbers of hospital visits for HCV and the highest prevalence rates ofHCV, so that prevention, testing, and treatment resources can be directed towards these populations. Data to support this analysis may be available from Solucient or the Cecil B. Sheps Center at UNC. Ideally, the data must be obtained with the zip code included (the zip code was suppressed from the data used for this paper). Additional data to support regional-level research might be available from local health departments throughout the state. A telephone or e-mail survey oflocal health departments in North Carolina would be a good way to identify regions where HCV prevalence is believed to be relatively high and where resources are most sorely needed.
3) Develop a comprehensive cost-effectiveness model of free or reduced-cost
Although the "societal perspective" is preferred in standard cost-effectiveness analysis, 52
using the perspective of the state budget might best support efforts to obtain funding from state legislators and other policymakers.
Published cost-effectiveness studies usually make numerous assumptions about key parameters, and use sensitivity analysis to assess which parameters have the greatest impact on the results. 52 In order to be useful for making decisions about providing regional HCV screening programs, a cost-effectiveness model ofHCV testing should be flexible with regard to assumptions about key parameters, including the prevalence of HCV in the population being tested and the success rates of HCV treatments. Since new treatments may be available in a few years for chronic HCV, a cost-effectiveness model should also consider the possibility of delaying treatment until treatment options improve, as has been recommended by earlier researchers. 53
8.3: Recommendations for Policy Change. The additional data collection and
analysis recommended above would help achieve the goals of further quantifYing the burden ofHCV in North Carolina, and identifying the regions and populations in North Carolina that are in greatest need ofHCV testing and other services. The magnitude and continued consistent growth of the HCV burden suggest that there is also an immediate need for testing programs and for educational and treatment interventions to prevent disease progression. Based on the results presented in this paper, three recommendations are given for North Carolina HCV policy change.
1) HCV testing should be made more widely available to the North Carolina
public at free or reduced cost. The people at greatest risk for chronic HCV disease in
to health care, and therefore, to HCV testing and treatment. Results of previous CDC surveys have shown that compared with other states, North Carolina has less public capacity for HCV screening and follow-up care. Another survey presently underway (by NASTAD) will probably show that North Carolina is still behind most other states in providing HCV testing and other services. Currently North Carolina has only two locations where HCV testing is offered for free through public health departments. Data and evaluations from these "pilot" testing sites should be collected, analyzed, and used to inform the development of additional testing programs at other sites across the state, as soon as funding is available.
2) Free or reduced-cost HCV testing programs should not be strictly limited
3) Develop a surveillance system and patient registry for chronic HCV.
Chronic HCV is not yet reportable in North Carolina, and there is no registry system for the disease. A surveillance system for reporting chronic HCV would improve knowledge about the extent of the disease burden and the regions of the state that are most affected. Improved surveillance could also help reduce transmission and prevent new cases of HCV infection. In addition, available data (such as the hospital inpatient database analyzed for this paper) is based on hospital stays rather than patients; longitudinal analysis of disease progression and outcomes for HCV patients is currently not possible. A statewide HCV patient registry is needed to facilitate keeping track of newly identified chronic HCV patients, increase the likelihood that patients will receive appropriate care, treatment, and follow-up, and improve patient outcomes.
Figure 1: CDC Recommendations for HCV Testing, 2006
Recommendations for Testing Based on Risk for HCV Infection
PERSONS RISK OF TESTING
INFECTION RECOMMENDED?
Injecting drug users High Yes
Recipients of clotting factors made before
1987 High Yes
Hemodialysis patients Intermediate Yes
Recipients of blood and/or solid organs
before 1992 Intermediate Yes
People with undiagnosed liver
problems Intermediate Yes
Infants born to After 12-18 mos.
infected mothers Intermediate old
Healthcarejpublic Only after known
safety workers low exposure
People having sex with
multiple partners low No*
People having sex with an infected steady
partner low No*
*Anyone who wants to get tested should ask their doctor.
Source: Centers for Disease Control and Prevention,
Table 1: Mortality Rates for Hepatitis C, North Carolina and United States, 1999-2003
HCV Deaths and Death Rates 1999
North Carolina HCV Deaths 78
Age-adjusted Death Rate per 100,000 1.0
United States HCV Deaths 3,763
Age-adjusted Death Rate per 100,000 1.4
% of US HCV Deaths in NC 2.1%
Source: CDC Wonder, Compressed Mortality, 1999-2003
http://wonder.cdc.gov
2000 88 1.1 4,225 1.5 2.1%
Year
2001 2002
112 124
1.4 1.5
4,609 4,839
1.6 1.7
2.4% 2.6%
2003