Master Dissertation
Submitted in partial fulfillment of the requirements for the Master degree in
Water Engineering
Presented by
Ngoni Conilius CHIRINDO
Defended on 03/09/2018 Before the Following Committee:
Chair Dr. Latefa Sail Tlemcen University, Algeria Supervisor Dr. Andrew Ako Ako Yaounde Hydrological
Research Centre, Cameroon External Examiner Prof. Thameur Chaibi National Institute for Research in
Rural Engineering, Water and Forestry, Tunisia
Internal Examiner Prof. S. M. Chabane Sari Tlemcen University, Algeria
Academic year: 2017/2018
Development of a Sugarcane Crop Water Use Based Water Budgeting Calibration Tool for Catchment Water Management.
Case Study: Zimbabwe’s South-Eastern Lowveld
DECLARATION OF INDEPENDENT WORK
I, Ngoni Conilius Chirindo, National Identity number: 47-168886 C 47 and student registration number PAUWES/2016/MWE08, do hereby declare that this design project submitted to the Pan African University Institute of Water and Energy Sciences (Inc. Climate Change), for the Master of Science Degree in Water Engineering, is my own independent work; and complies with the code of Academic Integrity, as well as other relevant policies, procedures, rules and regulations of the Pan African University, and has not been submitted before to any institution by myself or any other person in fulfillment of the requirements for the attainment of any qualification. I also declare that all information, material and results from other works presented here, have been fully cited and referenced in accordance with the academic rules and ethics.
SUPERVISOR’S CERTIFICATION
I hereby certify that this master thesis by Ngoni Conilius CHIRINDO, a Water Engineering Master student of Pan African University Institute of Water and Energy Sciences (including climate change) (PAUWES), Tlemcen, Algeria was carried out under my supervision.
ACKNOWLEDGEMENTS
Special thanks go to the African Union Commission (AUC) for such an opportunity they awarded me to do my MSc degree and also for the research grant of US$3000.00 they gave me to undertake this research. I would also like to thank the PAUWES administration for their advice and contributions in the completion of my MSc and this research at large. I would like to acknowledge my supervisor, Dr. Andrew Ako Ako for his guidance and fruitful advice in the completion of this Master Thesis.
I am also humbled by the moral support that my wife Kudzaishe P. Madhuku, family, friends and work mates gave me. They were my source of strength.
Last but not least, I give thanks to the Almighty God for being my guide and helper throughout this project.
DEDICATION
I dedicate this project to my beloved wife and my mother who ever gave me the much needed support.
TABLE OF CONTENTS ACKNOWLEDGEMENTS ... iii DEDICATION ... iv TABLE OF CONTENTS ... v LIST OF FIGURES ... ix LIST OF TABLES ... xi ABBREVIATIONS ... xii ABSTRACT ... xiii RESUME ... xiv DEFINITION OF TERMS ... xv
CHAPTER ONE: INTRODUCTION ... 1
1.0. Introduction ... 1 1.1. Background of Study ... 1 1.2. Objectives ... 3 1.2.1. Main objective ... 3 1.2.2. Specific Objectives ... 4 1.3. Problem Statement ... 4 1.4. Justification of study ... 5
1.5. Research Questions and Working Hypothesis ... 6
1.5.1. Questions ... 6
1.5.2. Hypothesis ... 6
1.6. Conclusion ... 6
2.0. Introduction ... 7
2.1. Importance of Determining Water Needs ... 7
2.2. Sugarcane Crop Water requirement ... 7
2.3. Water Budgeting ... 8
2.3.1. Importance of Water Budgeting ... 11
2.4. Water budgeting Versus Irrigation Scheduling ... 11
2.5. Irrigation scheduling ... 11
2.5.1. Effects of applying excess amount of water... 14
2.6. Water Budgets and Drought Response ... 14
2.7. Overview of Already Existing Water Budgeting/ Management Tools ... 16
2.7.1. Cropwat ... 16
2.7.2. ZIMsched ... 18
2.7.3. ZIMsched 2.0 ... 19
2.7.4. Water Administration System (WAS) ... 27
2.7.5. Water Sense Water Budget Tool ... 29
2.8. Summary of already existing tools versus the newly developed tool ... 34
2.9. Institutional Arrangements for Water Management and Allocation ... 36
2.9.1. Volumetric water allocations and priority-based reservoir and river operating rules (VWA-PRROR) ... 36
2.9.2. Fractional water allocations and capacity sharing (FWACS) ... 37
2.10. Barriers to Implementation of Water Budgets ... 41
2.11. Conclusion ... 41
3.0. Introduction ... 43
3.1. Description of study area ... 43
3.2. Approach ... 44
3.2.1. Crop Evapotranspiration (ETc ) Determination ... 45
3.2.2. Effective Rainfall/ Precipitation Determination ... 47
3.2.3. General formula Used for Irrigation Water Requirement ... 47
3.3. Timeframe and Milestones ... 48
3.3.1. Duration ... 48
3.4. Budget ... 48
3.5. Evaluation ... 49
3.6. Technology Transfer and/ or Commercialization Plan ... 49
3.7. Conclusion ... 50
CHAPTER FOUR: DATA PROCESSING AND ANALYSIS ... 51
4.0. Introduction ... 51
4.1. Satellite Data Processing ... 51
4.1.1. Input Data Gathering ... 51
4.1.2. Input Data Processing ... 52
4.1.3. Evapotranspiration in Instat ... 52
4.2. Meteorological Data Processing ... 55
4.3. Database Processing ... 56
4.4. Reset Button Programming ... 59
4.4.1. VBA Programme for the Reset Button ... 60
CHAPTER FIVE: RESULTS AND RESULTS DISCUSSION ... 66
5.0. Introduction ... 66
5.1. Interface of the Calibration Tool ... 66
5.2. Activation of the VBA project/ Excel Macro-Enabled Workbook ... 67
5.3. Principle of operation of the Tool ... 68
5.3.1. Inputting the Landscape Area ... 68
5.3.2. Inputting the Crop Details in the Calibration Tool ... 69
5.3.3. Month of Operation ... 70
5.3.4. Month of the Year Value ... 72
5.3.5. Irrigation System Option ... 73
5.3.6. Application Efficiency ... 74
5.3.7. Final Step in the Use of the Tool ‘The Reset Button’ ... 75
5.4. Overview of the results ... 76
5.5. Conclusion ... 76
CHAPTER SIX: CONCLUSION AND RECOMMENDATIONS ... 77
6.0. Introduction ... 77 6.1. Conclusion ... 77 6.2. Recommendations ... 78 REFERENCES ... 80 Appendix ... 83 7.0. Appendix 1 ... 83
LIST OF FIGURES
Figure 2.1: Community Based Water Budgeting ... 9
Figure 2.2: Relationship between Irrigation Scheduling and Water Budgeting ... 11
Figure 2.3: WAS Modules ... 27
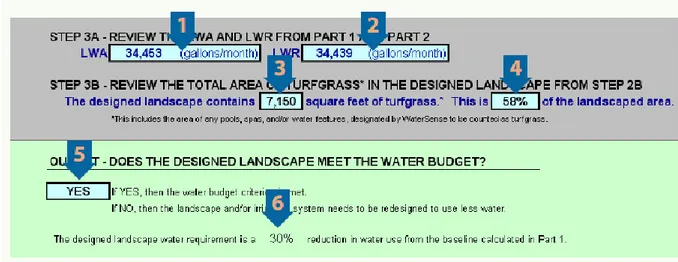
Figure 2.4: Basic information data input on a Water Sense Water Budgeting Tool .. 29
Figure 2.5: Water Budget Data Finder showing peak watering month, evapotranspiration (ETo) value, and rainfall ... 30
Figure 2.6: Window for inputting the area on Water Sense Water Budgeting Tool .. 30
Figure 2.7: Window for output values on Water Sense Water Budgeting Tool ... 31
Figure 2.8: Window for inputting rainfall values on Water Sense Water Budgeting Tool ... 32
Figure 2.9: Window showing how landscape details are inputted on Water Sense Water Budgeting Tool ... 32
Figure 2.10: Final results window on Water Sense Water Budgeting Tool. ... 33
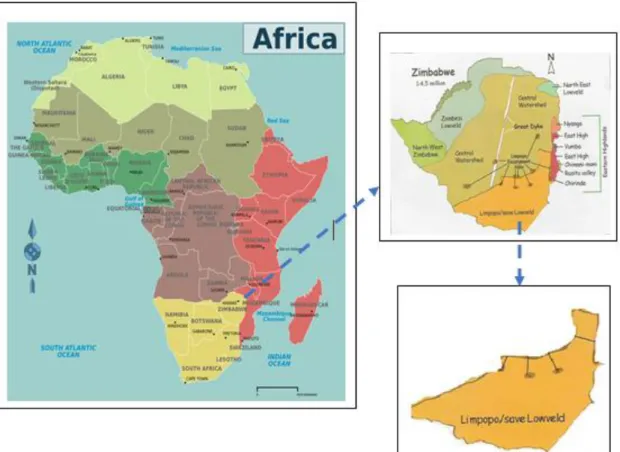
Figure 3.1: Zimbabwe map showing the Limpopo/Save Lowveld ... 44
Figure 3.2: Gantt chart showing thesis duration ... 48
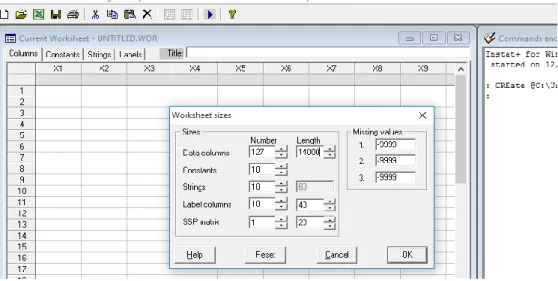
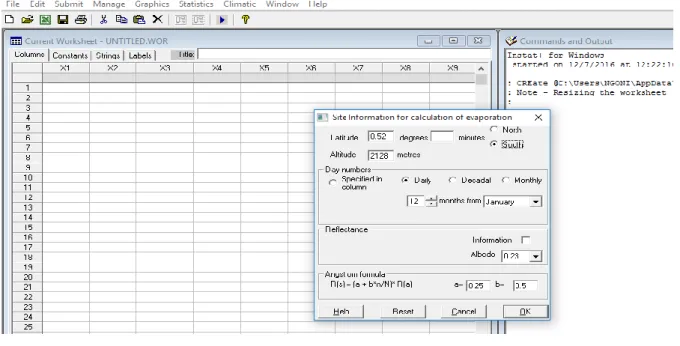
Figure 4.1: Resizing the Instat Worksheet ... 52
Figure 4.2: Location Inputting in Instat ... 53
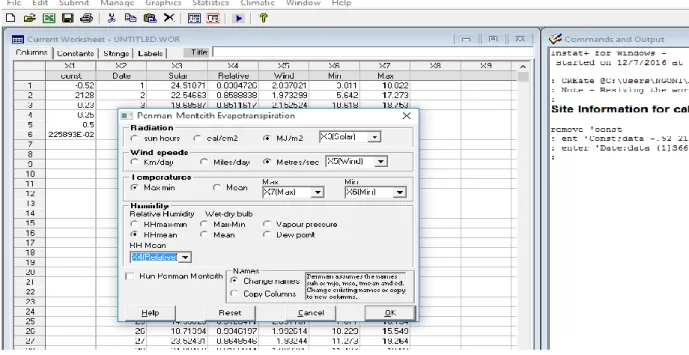
Figure 4.3: Final stage for ETo Calibration ... 54
Figure 4.4: Calibrated ETo ... 54
Figure 4.5: Unlocking the Developer Tab ... 59
Figure 4.6: Developer Tab showing VBA programming Options ... 60
Figure 4.7: Command Button Creation- First Step in Developing a Reset Button .... 60
Figure 4.9: VBA Programming Window ... 62
Figure 4.10: VBA programme for the Reset Button ... 62
Figure 4.11: Saving the VBA programme ... 63
Figure 4.12: Exiting the Design Mode ... 64
Figure 5.1: Interface of the Water Budgeting Tool ... 66
Figure 5.2: Enabling macros in excel ... 67
Figure 5.3: Cell for Inputting the Landscape Area ... 69
Figure 5.4: Process involved in Inputting Crop Type Details ... 70
Figure 5.5: Process involved in inputting the Month of Operation Details ... 71
Figure 5.6: Process involved in inputting the Month of the Year Value ... 72
Figure 5.7: Process involved in inputting the Irrigation System Option ... 73
Figure 5.8: Process involved in inputting the Irrigation System Option ... 74
LIST OF TABLES
Table 2-1: Summary of already existing tools versus the newly developed tool ... 34
Table 3-1: Kc for plant cane ... 46
Table 3-2: Kc values for ratoon cane ... 46
Table 3-3: Costs Incurred During the Course of the Project ... 49
Table 4-1: Collected raw data format ... 51
Table 4-2: Instat plus Calibrated ETo in Excel format ... 55
Table 4-3: ZMSD Monthly averages for the ETo and rainfall ... 56
Table 4-4: Monthly ETo and Eff. Rainfall Quantities ... 56
Table 4-5: Ratoon Crop Database ... 57
Table 4-6: Plant Crop Database ... 58
ABBREVIATIONS
CWU- Crop Water Use
CWM- Catchment Water Management
CWMA- Catchment Water Management Agency
CWR - Crop water requirement
ERF - Effective rainfall
ET – Evapotranspiration
ETo – Reference Evapotranspiration
ETc – Crop Evapotranspiration/ Crop Water
IR - Irrigation requirement
ABSTRACT
Zimbabwe’s Lowveld sugarcane farmers depends on at least 70 % irrigation for their crop production. Small scale sugarcane farmers (Out-growers) in the area are lacking technical capacities and finances to hire consultants to do their water budgeting predictions. They end up withdrawing unallocated water for their irrigation. This is posing a challenge to the supplier who ends up failing to supply water to deserving consumers. Conflict emerges among water users as they compete for the limited water resource.
Many water budgeting tools have been developed over the past years with different goals and approaches being used in the development of these tools. Many of these tools focus on irrigation water management and mainly depend on current weather data as input parameters for their operations. Those that are more into water budget predictions, are either locality based and only consider the pumping capacities and pumping duration as their bases for budgeting and they do not take into account the Crop Water Use (CWU)/ ET crop.
Due to the short comings of the existing tools, it was of paramount importance to develop a sugarcane CWU water budgeting tool for Catchment Water Management (CWM). Meteorological data from local weather stations and Satellite data for the past 14 years from 2003 to 2017 and 30 years from 1987 to 2017 respectively for the Lowveld area, incorporated with some formulas was used in determining CWU database in the calibration tool.
Through evaluation, the development of this tool resulted in 100 % time saving, 60 % improved water management strategies and 30 % efficient and effective utilization of water resources.
RESUME
Les producteurs de canne à sucre Lowveld du Zimbabwe dépendent d'au moins 70% d'irrigation pour leur production agricole. Les petits producteurs de canne à sucre (Out-growers) dans la région manquent de capacités techniques et de moyens financiers pour embaucher des consultants pour faire leurs prédictions sur le budget de l'eau. Ils finissent par retirer l'eau non allouée pour leur irrigation. Cela représente un défi pour le fournisseur qui finit par ne pas fournir de l'eau aux consommateurs méritants. Des conflits apparaissent parmi les utilisateurs d'eau alors qu'ils se font concurrence pour la ressource en eau limitée.
De nombreux outils de budgétisation de l'eau ont été développés au cours des dernières années avec différents objectifs et approches utilisés dans le développement de ces outils. Beaucoup de ces outils se concentrent sur la gestion de l'eau d'irrigation et dépendent principalement des données météorologiques actuelles comme paramètres d'entrée pour leurs opérations. Celles qui sont plus axées sur les prévisions du budget hydrique sont basées sur la localité et ne considèrent que les capacités de pompage et la durée de pompage comme base pour la budgétisation et ne tiennent pas compte de la culture d'utilisation des cultures (CWU) / ET.
En raison des lacunes des outils existants, il était primordial d'élaborer un outil de budgétisation de l'eau de la canne à sucre de la canne à sucre pour la gestion de l'eau du bassin versant (MCG). Les données météorologiques des stations météorologiques locales et des données satellitaires pour les 14 dernières années de 2003 à 2017 et 30 années de 1987 à 2017 pour la zone Lowveld, incorporées avec certaines formules, ont été utilisées pour déterminer la base de données CWU dans l'outil d'étalonnage.
Grâce à l'évaluation, le développement de cet outil a permis de gagner 100 % de temps, d'améliorer de 60 % les stratégies de gestion de l'eau et d'utiliser efficacement et à 30 % les ressources en eau.
DEFINITION OF TERMS
Irrigation- it is the application of controlled amounts of water to plants at needed intervals
Tool – A piece of software designed to do a particular task
Crop Water Use (ET crop) - is defined as the depth of water needed to meet the water loss through evapotranspiration.
Budgeting- an estimate of water for a given period in the future
Calibration- the action/ process of configuring an instrument to provide results for a sample within an acceptable range.
CHAPTER ONE: INTRODUCTION 1.0. Introduction
This chapter serves to introduce and state the focus of the study beginning with the background information concerning the problem leading to the need to develop a sugarcane crop water use based water budgeting calibration tool for Catchment Water Management (CWM). The Objectives, Problem statement, Justification of study, Research Questions and Working Hypothesis are also going to be found in this Chapter One.
1.1. Background of Study
Sugarcane is a high water-demanding crop (Eagri.org, 2018), with an average of 20
megalitres of water/ha (Silva et al., 2013) which is equivalent to 1 500 mm depth. Zimbabwe’s Lowveld sugarcane farmers depends on at least 70 % irrigation and at most 30 % rainfall water to meet up the 2 000 mm crop requirement (Maponga, 2016). The irrigation water is stored and managed by the Catchment Water Management Agency (CWMA) under the Zimbabwe Water Authority (ZINWA) who supplies water to the consumers based on needs.
Cooperation between the water consumer and supplier is therefore of utmost importance and any misjudgement on the required water from the consumer side has a great impact on both the consumer and suppliers. To the consumer side, inaccuracies on budgets induces pressure on the water resource use and subsequent stimulation of water stress and yield losses on sugarcane (Msibi et al.,
2014). To the supplier side, failure of CWMA to have all consumer’s advance
monthly or yearly total water needs results in them failing to reserve enough water in reservoirs as in some cases water is released when consumers are not in need of it resulting in water being lost to the oceans.
In the case of bigger institutions in the South-Eastern Lowveld, consumer to supplier cooperation is better unlike with small scale farmers (Out-growers) who in most cases withdraw unallocated water disadvantaging a few individuals who requested their share which leads to conflict (Svubure et al., 2010). Though with many
shortcomings, these bigger institutions normally depends on billed water for the previous years to predict the water needs for the coming year.
Zimbabwe’s Lowveld small scale sugarcane farmers are lacking technical capacities and finances to hire consultants to do their water budgeting. They end up withdrawing water for their irrigation as long as they see canals or rivers flowing. This is posing a challenge to the supplier who ends up failing to provide water to deserving consumers especially in times of critical water need. In the case of established Sugarcane Plantation Water Managers, the time that is supposed to be utilized in doing other beneficial activities in their respective Organizations is being wasted in doing water budgets also.
Uncertain water availability and a climate characterised by recurring droughts, provides strong motivation for the sugar industry in southern Africa to strive for continuous improvement in water management (Lecler, 2004). For example, the sugar industry in Zimbabwe which is totally reliant on irrigation, nearly collapsed as a result of crippling water shortages following the 1991/2 drought (Lecler, 2004). Concern over water for irrigation is growing in many countries where water supplies are limited and communities are becoming more sensible to the impact of irrigation on the environment and on the sustainability of their livelihoods (Inman-Bamber, 2004).
It is of significance to improve estimates of crop water use in order to advance irrigation design limitations and scheduling. Accurate estimates of crop water use are required to determine irrigation allocations and to improve management of both surface and underground water storages (Inman-bamber and Mcglinchey, 2003). Matching water supply and demand on a daily or weekly or monthly basis is essential for productivity and sustainability in any irrigation scheme (Inman-bamber and Mcglinchey, 2003). To help ensure the long term viability of irrigated industries, increased insight into the performance of the various water management and irrigation systems is needed, together with the development and adoption of strategies, tools and guidelines to improve performance (Lecler, 2004).
Many water budgeting/ management tools have been developed over the past years. These include ZIMsched (Lecler, 2000), ZIMsched 2.0 (Lecler, 2003) and Water Administration Systems (WAS) which was developed in 2006 (Benade, 2017). ZIMsched and ZIMsched 2.0 are currently popular amongst sugarcane farmers in the Zimbabwe’s Lowveld. Different goals and approaches have been adopted in the development of these tools with many of them focusing on the irrigation water management or irrigation scheduling and mainly depend on daily weather data as their main input parameters for their operations. Those that are more into water budget predictions only consider the pumping capacities and pumping duration as their bases for budgeting.
Contrary to the already developed tools, the sugarcane CWU water budgeting calibration tool for CWM in Zimbabwe’s Lowveld makes use of historical climatic database which makes it easier for a farmer who does not have access to either daily, weekly, monthly, yearly or historical weather data to use in the tool to do their water budget predictions. The tool makes use of the crop water requirements as the bases to predict what should be supplied by the CWM. This proposed tool act as an updated version of the already developed tools as it will have a provision to bypass the database in the event that current data needs to be used in case unpredicted rainfall is received and an immediate water budget is required or irrigation scheduling needs to be done.
Due to the stated problems and opportunities cited above, it was of paramount importance to develop a sugarcane CWU water budgeting calibration tool for Catchment water management to save time, improve on water management strategies and utilize water resources efficiently and effectively.
1.2. Objectives 1.2.1. Main objective
To develop a sugarcane crop water use based water budgeting calibration tool for Catchment Water Management (CWM).
1.2.2. Specific Objectives
i. To create a climatic database based on historical data for the Zimbabwe’s Lowveld.
ii. To compute and create a database of crop water demands based on the climatic data.
iii. To develop a water budgeting tool based on climatic database to compute daily, monthly and yearly water budgeting (demand).
iv. To use water judiciously with a view to optimizing benefits in a context of climate variability, erratic rainfall and possible drought.
1.3. Problem Statement
Zimbabwe’s small scale sugarcane farmers lack technical capacities and financial resources to hire consultants to do their water budgeting predictions. They end up withdrawing water for their irrigation as long as they see supply canals or rivers flowing. This poses a challenge to the CWMA who end up failing to supply water to deserving consumers especially in times of critical water need. As a result of this water shortage, conflict is arising between farmers resulting in compromising their social relationships (Svubure et al., 2010).
This lack of cooperation between the water consumer and supplier is resulting in adverse impacts to both the water consumer and supplier. To the consumer side, inaccuracies on budgets induces pressure on the water resource use and subsequent stimulation of water stress and yield losses on sugarcane (Msibi et al., 2014). To the supplier side, failure of CWMA to have all consumer’s advance daily, weekly, monthly or yearly total water needs results in them failing to reserve enough water in reservoirs as in some cases water is released when consumers are not in need of it resulting in water being lost to the oceans.
Already existing water budgeting tools have different goals and approaches with many of them focusing on the irrigation water management or irrigation scheduling and mainly depend on current weather data as their main input parameters for their operations. Those that are more into water budget predictions are either site specific
or only consider the pumping capacities and pumping duration as their bases for budgeting.
Due to the cited problems above, it was of paramount importance to carry this design to save time in doing water budgets, improve on water management strategies and utilize water resources efficiently and effectively. This design therefore aimed at developing a sugarcane CWU water budgeting calibration tool for CWM in Zimbabwe’s South-Eastern Lowveld.
1.4. Justification of study
Majority of the existing water budgeting tools exist in the form of irrigation scheduling or irrigation water management tools which do not compute or predict the future total water needs. These tools depend on daily weather data which makes them not fit to compute the future water budgeting predictions unlike the sugarcane CWU water budgeting tool which depends on historical climatic data. This developed tool makes it easier for the remotely located farmers who do not have access to daily climatic data to do their own budgets. Those that go further in doing the water budgeting are either locality based, expensive to acquire, require many input data or they do not cater much for the crop water needs as they depend on the pump flow rates and pumping durations for their budgeting.
Apart from focusing only on addressing the short-comings of the already existing water budgeting tools, the developed sugarcane CWU water budgeting tool incorporates the basic functions of the already existing tools making it an updated version of the existing tools. It also takes into account the effects of climate change since historical climatic data was used. This tool also helps Sugarcane Plantation Water Managers in doing their water budgeting predictions in no time which results in them diverting effort to other duties in their respective Organisations thereby increasing the Organisations’ outputs.
To the CWMA, this developed water budgeting tool cements cooperation between them and the consumers as it helps in making the CWMA a very important stakeholder who can be able to guide farmers on whether or not they can expand based on the availability of water in the storage reserves. Last but not least, the
developed water budgeting tool can be used to measure if the crop is being over or under irrigated through measuring the actual water applied against the predicted from the budgeting tool.
1.5. Research Questions and Working Hypothesis 1.5.1. Questions
1. How is the tool helping in saving time?
2. How is the tool helping in improving water management strategies?
3. How is the tool helping in utilizing water resources efficiently and effectively? 4. How is the tool different from already existing budgeting tools?
5. How is the tool combating conflict among water users?
1.5.2. Hypothesis
Failure by farmers to predict their future water needs has a great impact in managing water at Catchment level.
1.6. Conclusion
In Zimbabwe, small holder sugarcane farmers are financially and technologically constrained so they do not have the capacity to do their water budgets or hire consultants to do their water budgeting needs. Those that have the capacity to do their water budgeting needs, they take a long time to do so resulting in loss of time which is supposed to be directed to other productive activities. This study seeks to develop a sugarcane Crop Water Use (CWU) water budgeting tool for Catchment Water Management (CWM). This development result in time saving, improved water management strategies, efficient and effective utilization of water resources.
CHAPTER TWO: LITERATURE REVIEW 2.0. Introduction
This chapter provides a comprehensive review of literature related to the problem under investigation. This among other things include: the importance of the crop under study, already existing water management tools and relevant information that the researcher came across that is in relation to achieving the above stated objectives.
2.1. Importance of Determining Water Needs
All plants need water to grow and produce good yields. When plants are water stressed they close their stomata (the small holes in the leaf surface) and cannot photosynthesise effectively. Best growth can be achieved only if plants have a suitable balance of water and air in their root zones (Lecler, 2000). Some stages in the growth of a crop are particularly sensitive to moisture stress.
Water shortages that are sufficient to hinder crop growth can occur without producing obvious wilting of foliage, while waterlogging can cause large yield reductions too (Inman-Bamber and Smith, 2005). The grower must therefore rely on some other methods of determining the water needs of the crop to avoid production or quality losses. This requires an understanding of the movement and storage of water in the root zone of the crop and the rate of water use by the crop (Inman-Bamber and Smith, 2005).
2.2. Sugarcane Crop Water requirement
Sugarcane is a high water-demanding crop (Eagri.org, 2018), with an average of 20 megalitres of water/ha (Silva et al., 2013) which is equivalent to 2 000 mm depth. Water requirement is the total amount of water needed for raising a crop successfully (Shrivastava et al., 2011). In the case of all crops, it comprises the quantity of water for meeting the losses during application of water, water needed for land preparation as pre-planting irrigation and the needs of evapotranspiration and metabolic
activities. Water loss from the soil takes place through surface evaporation, transpiration by plants and deep percolation beyond the root zone.
Under field conditions, water requirements are met effectively by rainfall, contribution from groundwater (if the water table is within the reach of the root system) and irrigation (Shrivastava et al., 2011). It varies from place to place depending on weather conditions, texture of soil, and growth and development stage of the crop.
It is in the interests of irrigators, environmental managers and the community in general to ensure that crop production remains profitable while water is used more sparingly and drainage and runoff are reduced to a minimum (Inman-Bamber and Smith, 2005).
2.3. Water Budgeting
A water budget is a plan for managing water use and saving. It tracks planned water use versus actual water use. Watershed Organisation Trust (2017) conceptualizes Water Budgeting as being geared towards ensuring optimum and most efficient use of water. This involves gaining an understanding of water availability, community’s existing needs and requirements of water, crop-planning based on water availability, optimizing irrigation, equitable sharing of excess water, and considered decisions on groundwater withdrawals (See Figure 2-1 below for further illustration).
Source: (Water Organisation Trust, 2017) Figure 2-1: Community Based Water Budgeting
This kind of integrated approach and exercises help the community understand the implications of the different patterns of water use that are prevalent in their area. By obtaining community level water availability data (from the rainfall data, etc), people are able to assess water available at their disposal for the coming months, plan judicious uses of water and decide on the crops accordingly, after taking into consideration the needs of households and livestock.
This consideration of various local claims on water resources in the community provide a strong basis for making decisions regarding the different and appropriate cropping patterns, area to be taken for cultivation, the method of application of irrigation water, imposition of water use charges (if any), that arrives at not only equitable sharing of water but also optimizing output per drop of water (Water Organisation Trust, 2017).
According to Swanson and Fipps (2013), water budgeting is usually an estimate of the amount of water to allocate to landscape irrigation used for the determination of:
Maximum applied water allowance which is set by a regulatory agent as
Estimate applied water budgets for a worst case scenario (zero rain), expected use basis (normal rainfall) and maximum water conservation
Water use tracking to compare actual monthly water use ton one or more of the
above
Also Mayer et al. (2008) defines water budget as the volumetric allotments of water to customers based on customer-specific characteristics and conservative resource standards. A water budget helps in managing costs and improves site maintenance and efficiency. Mayer et al. (2008) further explains water budgets in respect to how other stakeholders define it like where water providers tend to define water budgets in more specific terms so that their customers can easily understand how the budget (or allocation as it is often called) applies, for example, the city of Boulder, Colombia which defines the concept for its customers as follows: “A water budget is the amount of water you are expected to need for a specific month. Each customer’s water budget will be different based on their water needs. Water budgets may vary monthly based on seasonal outdoor watering needs.”
Water-Budgeting exercise brings to light water availability within a village. Agro-advisories help in better planning and making better crop decisions (Water Organisation Trust, 2017).
A landscape and crop water use based water budget is the most common form of a water budget. This water budget is typically a volume of water that is calculated from two parameters which are the landscape size (usually in Hectares) and the water requirement of plants in that geographic area, which is usually represented by the evapotranspiration (ET) rate.
Unlike the focus of this thesis which is based on Crop Water Use, indoor water budgets are typically a fixed volume provided each month based on the historical use of the customer class or a calculated volume based on the anticipated needs of the customer.
Water budgeting may be for an irrigation system planned by irrigation engineers; may be for a canal or for an area (block) or may be for a farm according to the need and plan by responsible persons who plan the irrigation efficiency.
2.3.1. Importance of Water Budgeting
To reduce excess irrigation and losses caused thereby
Efficient utilization of available water and bringing more area under irrigation.
To increase cropping intensity of a region / farm
To increase the productivity of a region / farm.
To avoid run off losses
To tide over some dry-spells
2.4. Water budgeting Versus Irrigation Scheduling
Water budgeting calculations can be simple or complicated as is needed and also are usually based on a monthly or annual analysis whereas irrigation scheduling calculations can be complicated and are usually based on running a daily balance on ET, soil, moisture levels and other factors (Swanson and Fipps, 2013).
In general, Irrigation scheduling is the forerunner to water budgeting (Swanson and Fipps, 2013), see Figure 2-2 below.
Source: (Swanson and Fipps, 2013)
Figure 2-2: Relationship between Irrigation Scheduling and Water Budgeting
2.5. Irrigation scheduling
Irrigation scheduling is defined as the frequency with which water is applied to the crops based on needs and soil nature. Irrigation scheduling is nothing but the number of irrigations and their frequency required to meet the crop water requirement (Eagri.org, 2018).
It is a daily or weekly detailed water balance analysis to determine the amount of water needed to optimize plant growth and quality, maintain plants/ landscapes at a desired level and ensure survival of plants. Irrigation scheduling may also be defined as scientific management techniques of allocating irrigation water based on the individual crop water requirement (ETc) under different soil and climatic condition,
with an aim to achieve maximum crop production per unit of water applied over a unit area in unit time (Allen et al., 1998). Last but not least, irrigation scheduling as according to the Author, is a decision making process repeated many times in each month or year involving when to irrigate and how much of water to apply?
However, Irrigation scheduling has its own importance according to the nature of the work as stated below (Eagri.org, 2018).
For irrigation Engineers: Irrigation scheduling is important to effectively and efficiently cover more area with available quantity of water.
For soil scientists: It is important that the field should not be over irrigated or under irrigated as both will spoil the chemical and physical equilibrium of the soil.
For Agronomists: It is very much important to get higher yield per unit quantity of water in normal situations and to protect the crop to get as much as possible yield under drought situation by means on supplying water in optimum ratio and minimizing all field losses.
Mathematically irrigation scheduling or irrigation requirement is shown in Equation 2-1 (Eagri.org, 202-18):
Irrigation requirement (IR) = Crop water requirement (CWR) – Effective rainfall (ERF). It can be expressed either in mm/day/ or mm/month Equation 2-1
Practical considerations in irrigation scheduling
If the crop water requirement of a particular crop is 5 mm per day, it means every day we have to give 5 mm of water to the crop to compensate for the water lost through ET. Practically it is not possible since it is time consuming and laborious. Hence, it is necessary to schedule the water supply by means of sometime intervals
and quantity (Swanson and Fipps, 2013). For example the water requirement of 5 mm/ day can be scheduled as 20 mm for every 4 days or 30 mm/for every 6 days or 35 mm/for every 7 days depending upon the soil type and climatic conditions prevailing in that particular place. While doing so we must be very cautions that the interval should not allow the crop to suffer from water stress (Eagri.org, 2018).
Before scheduling irrigation in a farm or field or a command, the following factors should be taken care for efficient scheduling (Eagri.org, 2018).
Water Delivery System: It consists of Well and river or canal irrigation. Under well irrigation, the individual’s decision is final whereas under river irrigation or canal irrigation, it is a public distribution system where scheduling is arranged based on the decision made by public and is based on the availability of resource (Eagri.org, 2018).
Crop factors (Kc): When crops are young and small, actual ET is only about 1/3 of
ETo because the small plants do not transpire much and soil surfaces typically dry
out quite less between irrigations (there is very little evaporation off a dry soil surface) (Asi.ucdavis.edu, 2018). When a crop is full sized and still green, actual ET will be closer to ETo and is often actually slightly greater than ETo. The “Crop
Coefficient” (Kc) quantifies the ratio between actual ET and ETo. Kc tends to increase
with the size of the plant (in the case of annual crops) or the amount of foliage (in the case of deciduous perennials) (Asi.ucdavis.edu, 2018).
Methods of Irrigation Used: Include Furrow Irrigation method which allows for less infiltration due to less wetting surface which needs less water and short interval in irrigation frequency, Flooding Irrigation method which allows for more infiltration through more wetting surface area which in turn needs more water and long interval in irrigation frequency, Basin Irrigation method which allows more infiltration through more wetting surface area which in turn needs more water and long interval in irrigation frequency, Sprinkler Irrigation method which needs less water and more frequency, Drip Irrigation method which needs less water and more frequency and Centre Pivot Irrigation method which needs less water and more frequency (Eagri.org, 2018).
Soil Type: An example of two soils is elaborated. Under clay soils, long frequency of irrigation and more quantity of water is required and under sandy soils, short frequency of irrigation and less quantity of water is required.
Salinity Issues: To maintain favorable salt balance, excess water application may be required to leach the excess salts through deep percolation rather than ET requirement of the crop.
Irrigation Interval: The extension of irrigation interval does not always save water. The interval has to be optimized based on the agro climatic situation of the area.
Minimum spreadable depth: We cannot reduce the depth based on the water requirement of the crop alone. The depth should be fixed based on the soil type, rooting nature of the crop and irrigation method used. The minimum depth should be so as to achieve uniformity of application and to get uniform distribution over the entire field.
2.5.1. Effects of applying excess amount of water
It wastes water below root zone and also causes erosion through runoff
It results in leaching of fertilizer nutrients resulting in the pollution of ground water
It causes water stagnation resulting in poor aeration and salinity
Ultimately it damages the crops
2.6. Water Budgets and Drought Response
Water budgets and water budget rate structures offer water utilities powerful tools for reducing demand during drought and for monitoring customer compliance with drought restrictions (Mayer et al., 2008). Unlike nowadays, historically, drought has been considered an unpredictable natural disaster. In response to drought, Water System Managers have usually relied on foreseeable response mechanisms.
Water managers have viewed droughts as low-water supply events of unknowable and uncontrollable duration (Mayer et al., 2008). In response, water utilities typically invoke some form of water use restrictions on customers that limit outdoor use, often using somewhat arbitrary baselines such as the previous year’s use. The strategy for
drought management has been expanded in recent years to put more emphasis on drought planning instead of mere drought response (Billingsley, 2002). Drought management plans may vary from place to place, but progressive drought plans generally include four main elements which are listed below (Inman-Bamber, 2004). Each of the four elements contains sub-elements that must be taken into account in order to formulate a successful drought response plan:
An analysis of how water supplies are likely to vary for a range of droughts;
An understanding of local water requirements as well as the ability to reduce them;
Established measures for reducing demands in an equitable manner;
Creation of a modern system designed for flexibility to match the conditions of the
drought.
A water budget rate structure is a sword that cuts both ways during drought (Inman-Bamber, 2004). Initially, it establishes an empirical and quantifiable limit to the amount of water that a customer is entitled to use at a given price from a given tap. Also, it supposedly reserves a volume of water for the customer to use as he/ she sees fit. Water budgets have the potential to protect the utility from overuse and to protect the customer from having his or her water allocated to other uses or micromanaged by the utility. In time of shortages, water budgets allow a water provider to quickly and easily identify excess use and even penalize it if necessary. By summing all water budgets, utilities can quickly understand the amount of water likely to be required to meet customer demands in any given month. During a drought, water budgets have the potential to assist water utilities in more fairly apportioning demand reductions among customers with different needs and among different customer classes (Mayer et al., 2008). This is because the reference point for reductions is based on the water required by each customer in normal times. Archeologically, when customers are asked to reduce their use from the previous year, justified complaints arise from those who are already conserving and don’t have as much room for additional limitations.
The water budget rate structure, along with its billing system, informs all customers on a regular basis of the required use reductions. The water bill can show customers how much water they are allocated during a drought. This information can be developed well before a drought occurs as part of the budgeting process. This is a far more reliable and effective way to implement drought-related conservation because it is preplanned rather than improvised (Mayer et al., 2008).
The billing system is already in place, and the bills can provide the public with the information needed to respond to the drought. Another way that water budget rate structures aid with drought plan implementation is in the enforcement of mandatory demand limitation.
In each billing period, a simple query of the billing database can tell the utility which customers have complied with drought restrictions and remained within budget and those who have not. If the higher water rates being charged are not sufficient to elicit cooperation, then additional fines and penalties can be considered (Mayer et al., 2008).
This is a highly reliable system. Unlike the “water cop” approach in which customers are ticketed if they happen to be observed violating the drought restrictions, a water budget drought enforcement program automatically identifies every customer who is not complying. This enables fair and uniform enforcement. Water enforcement patrols are costly and can only catch violators “in the act” of violating a watering restriction. A water budget, however, provides a regular and automatic check on which customers are in or out of compliance with drought response (Mayer et al., 2008).
2.7. Overview of Already Existing Water Budgeting/ Management Tools 2.7.1. Cropwat
Cropwat is a pilot initiative that helps the farmers make decisions about when and how much to irrigate their fields based on the crops planted (Water Organisation Trust, 2017).
Cropwat is a decision support tool developed by the Land and Water Development Division of FAO (FAO, 2018). Cropwat for Windows is a computer program based on the previous Disk Operating System (DOS) versions for the calculation of crop water requirements and irrigation requirements based on soil, climate and crop data. In addition, the program allows the development of irrigation schedules for different management conditions and the calculation of scheme water supply for varying crop patterns (FAO, 2018). Cropwat can also be used to evaluate farmers’ irrigation practices and to estimate crop performance under both rain fed and irrigated conditions.
All calculation procedures used in Cropwat are based on the two FAO publications of the Irrigation and Drainage Series, namely, No. 56 "Crop Evapotranspiration - Guidelines for computing crop water requirements” and No. 33 titled "Yield response to water" (FAO, 2018).
As a starting point, and only to be used when local data are not available, Cropwat includes standard crop and soil data. When local data are available, these data files can be easily modified or new ones can be created. Likewise, if local climatic data are not available, these can be obtained for over 5,000 stations worldwide from Climwat, the associated climatic database (FAO, 2018).
The development of irrigation schedules in Cropwat is based on a daily soil-water balance using various user-defined options for water supply and irrigation management conditions. Scheme water supply is calculated according to the cropping pattern defined by the user, which can include up to 20 crops (FAO, 2018). Apart from a completely redesigned user interface, Cropwat for Windows includes a host of updated and new features that includes (FAO, 2018):
Monthly, decade and daily input of climatic data for calculation of reference evapotranspiration (ETo)
Backward compatibility to allow use of data from Climwat database possibility
Daily calculation of crop water requirements based on updated calculation algorithms including adjustment of crop-coefficient values calculation of crop water requirements and irrigation scheduling for paddy & upland rice
Using a newly developed procedure to calculate water requirements including
the land preparation period interactive user adjustable irrigation schedules daily soil water balance output tables easy saving and retrieval of sessions and of user-defined irrigation schedules graphical presentations of input data
Crop water requirements and irrigation schedules easy import/export of data and graphics through clipboard or ASCII text files extensive printing routines, supporting all windows-based printers context-sensitive help system
With all the information and how useful is the Cropwat software, a gap was observed. Cropwat is not a user friendly software and requires real time weather data to compute the daily water needs. It is an irrigation scheduling software hence it does not compute or predict the water quantities required by the crop in the coming future.
2.7.2. ZIMsched
According to Lecler (2000), ZIMsched is a robust, scientifically sound and yet simple irrigation management and yield forecasting tool. Spreadsheets were selected as the basis for developing ZIMsched because they are familiar to many people and have very powerful in-built functionality. Use of ZIMsched irrigation scheduling tool was shown to have potential to facilitate up to 20 % savings in annual irrigation water requirements in many cases (Griffiths and Lecler, 2001).
The irrigation management tool has been accepted by farmers due to its simplicity, less time-consuming and easy to operate. When using ZIMsched for determination of irrigation water applications, a user simply enters recorded daily values for maximum and minimum temperature, A-pan evaporation, Total Available Moisture (TAM) of the soil for the field in question, the saturated drainage coefficient, rainfall and irrigation water applications and observes changes to the estimated soil water status and the date when the estimated soil water is expected to reach a level at which an irrigation water application is needed (Lecler, 2000).
ZIMsched concepts and algorithms which are used to account for the major components of the water budget and the crop yield estimates include evaporation which takes into account crop coefficient, Atmospheric Evaporative Demand (AED), rooting characteristics and Evaporation Under Conditions of Soil Water Stress, Surface Runoff, drainage, effective rainfall and Crop Yield Estimates parameters. Though ZIMsched is an irrigation management tool and mainly depends on daily climatic data, some of its concepts and algorithms forms the bases for the development of sugarcane CWU water budgeting tool for CWM in Zimbabwe’s Lowveld which will be making use of historical climatic database.
2.7.3. ZIMsched 2.0
The spreadsheet-based irrigation scheduling and crop yield forecasting tool ZIMsched (Lecler, 2000), was refined to a deterministic crop and irrigation systems simulation model, ZIMsched 2.0 (Lecler, 2003). The refinements to the ZIMsched 2.0 model were developed in order to estimate how water management, different irrigation system characteristics and the infield measures of irrigation systems performance indices derived by the Mobile Irrigation Performance Unit (MIPU) impacted on potential crop yields, irrigation water requirements and water losses (Lecler, 2003). The main refinements to the original ZIMsched model developed by Lecler (2000) and their validity is described below.
2.7.3.1. Evaporation from the soil and plant (transpiration)
In ZIMsched 2.0, evaporation from the soil and the crop were determined separately, based largely on the algorithms described in the Food and Agriculture Organisation of the United Nations (FAO) Irrigation and Drainage Paper No. 56, by Allen et al., (1998) (Lecler, 2003). According to Lecler (2003), it was very important to separate the processes because prior to the development of significant canopy cover, water losses are dominated by evaporation from the soil surface. This evaporative loss can be very variable because different types of irrigation systems wet different fractions of the soil and there are also variations in wetting frequencies. Effective early season water losses and associated crop coefficients can thus vary significantly, depending on the type of irrigation system and its operation (Lecler, 2003).
The main modification to the algorithms given in FAO 56 (Allen et al., 1998) involved the incorporation of a relationship between the rate of canopy development and thermal time (Lecler, 2000), and small refinements to the procedures used to calculate the soil surface water evaporation coefficient (Ke). The rate of canopy
development is mainly dependent on temperature and therefore, the concept of relating canopy development to thermal time was superior to relating it to calendar days. This is because variations in the rate of canopy development that are associated with different planting/ ratooning times (early, mid, late season), and seasonal temperature variations can be automatically accounted for (Lecler, 2003).
The FAO 56 coefficient, Ke, describes the potential evaporation of water from the soil
surface, which can be assumed to take place in two stages (Allen et al., 1998). In the
first stage, when the topsoil is wet following irrigation or rainfall, Ke is maximal. In the
second stage, after a certain amount of water has evaporated, the soil surface is drier and Ke reduces, eventually reaching zero when there is minimal water near the soil surface for evaporation (Allen et al., 1998).
In FAO 56, the effects of shading are accounted for through the fraction of the soil surface covered by vegetation, fc (Allen et al., 1998). In ZIMsched 2.0, fc is
determined using thermal time (TT), as given in Equation 2-2 (Lecler, 2003):
fc = Grdini for TTA < 340 Equation 2-2
fc = max (Grdini , min (0.99, ((TT-340)/(1000-340))0.99) for TTA > 340
Where
Grdini = initial ground cover, e.g. due to surface mulching
TTA = accumulated thermal time (degree days)
= (Tmax + Tmin)/2 - 12ºC
Tmax = daily maximum temperature (ºC)
Where ‘max’ and ‘min’ select the maximum or minimum of the terms in brackets which are separated by commas. The numerical values ‘340’ and ‘1000’ were based on analysis of leaf area index (LAI) versus thermal time (unpublished data) (Lecler, 2003).
Determination of Ke requires a daily water balance computation in order to calculate
the cumulative depletion, De, for the surface layer from a wet condition. In ZIMsched
2.0, the depth of the surface layer was taken as 0.1 m (Lecler, 2003). The daily soil
water balance equation for the exposed and wetted soil fraction, few, of the surface
layer (Allen et al., 1998) is as shown in Equation 2-3 below:
De, i = De, i-1 - (Pi - ROi) - Ii/fw + Ei/few + Tew,i + DPe,i Equation 2-3 Where
De, i-1 = cumulative depth of evaporation following complete wetting from the
exposed and wetted fraction of the topsoil at the end of day i-1 (mm)
De i = cumulative depth of evaporation following complete wetting from the
exposed and wetted fraction of the topsoil at the end of day i (mm)
Pi = rainfall on day i (mm)
ROi = stormflow/ runoff from the soil surface on day i (mm)
Ii = irrigation depth on day i that infiltrates the soil (mm)
Ei = evaporation from the soil surface on day i (mm)
Tew ,i = depth of transpiration from the exposed and wetted soil surface layer
on
day i (mm)
exceeds field capacity (mm) (Note: for the determination of Ke, DPe, i
is always assumed equal to zero as although the surface layer may be draining, in such a state the surface will likely be wet and evaporation from the surface uninhibited)
fw = fraction of the soil surface wetted by irrigation (0.01 - 1)
few = exposed and wetted soil fraction (0.01 - 1)
With limits 0. De, i .TEW
TEW = 1000(2dul - 0.52pwp) Ze
TEW = total evaporable water from the top soil (mm)
2dul = soil water content at the drained upper limit (field capacity) (m3/m3)
2pwp = soil water content at permanent wilting point (m3/m3)
Ze = depth of the surface soil layer that is subject to drying by way of
evaporation, taken as 0.1 m in ZIMsched 2.0.
Use of Equation 2-4 is simplified in FAO 56 where it is assumed that all water infiltrates, i.e. zero runoff (RO) and that transpiration from the surface layer that contributes to Ei is negligible.
In ZIMsched 2.0, however:
Stormflow/ RO is not assumed to be zero, but is calculated using the modified SCS stormflow equation (Schulze, 1995).
Transpiration, (Tew), from the soil layer contributing to Ei is also not assumed to
be zero. The proportion of the actual transpiration for a day that is extracted from the topsoil layer is given in Equation 2-5 below:
FT, i = max (0, 0.1/(Rfac . Sdep).(TAM10 - De, i-1)/TAM10)
Where
FT, i = fraction of actual transpiration on day i that is extracted from the topsoil
layer
Rfac = proportion of total soil depth that is penetrated by roots
= 0.4 for TTA < 340
= min (1, 0.6(TTA-340)/(980-340) + 0.4) for TTA .340
Note: it is assumed that maximum rooting depth coincides with the development of full canopy cover (Jensen et al., 1990)
TTA = accumulated thermal time (degree days) Sdep = total soil depth (m)
TAM10 = Total available water in the topsoil layer of 0.1 m, viz. (2dul - 2pwp)
0.1
2dul = soil water content at the drained upper limit (field capacity) (m3/m3)
2pwp = soil water content at permanent wilting point (m3/m3)
De, i-1 = cumulative depth of evaporation following complete wetting from the
exposed and wetted fraction of the topsoil at the end of day i-1 (mm) Thus, based mainly on the algorithms given in FAO 56, the evaporation losses associated with different types of irrigation systems, the effects of planting/ratooning in different months and the effects of hot or cold intra-seasonal conditions on the rate of canopy development and associated water use were accounted for in ZIMsched 2.0 (Lecler, 2003).
2.7.3.2. Atmospheric evaporative demand (AED)
ZIMsched 2.0 uses the evaporation measured using a class A-pan to represent AED. In Zimbabwe, most of the research involving sugarcane crop water use has been undertaken using the evaporation from A-pans as the reference evaporation. Nevertheless, the correlation between the evaporation from an A-pan and the evaporation from a cropped surface can be markedly different in summer and winter, and also under adjective conditions or when there are wide variations in wind and humidity (Allen et al., 1998).
For this reason, relationships between:
the FAO Penman-Monteith reference evaporation,
evaporation from a class A-pan, and
evaporation from a relatively simple atmometer device that may better represent
a plant,
were investigated for possible incorporation into ZIMsched 2.0. However, Griffiths and Lecler (2001) showed that there was very little difference between using A-pan data with appropriate pan factors and the Penman-Monteith equation with data from an automatic weather station (AWS), especially when the data is averaged over a five day period, which is equivalent to a typical irrigation cycle. As the data from the AWS were only collected beginning in 1998, A-pan data were used as the default option in ZIMsched 2.0.
2.7.3.3. Rooting characteristics
In ZIMsched 2.0, the root zone which delimits the volume of soil from which water is available to the crop is dynamic in order to account for root growth (Lecler, 2003). The depth of the zone from which water uptake can occur, Rz, is calculated by
assuming that maximum rooting depth coincides with the development of full canopy, which in ZIMsched 2.0 is predicted from a relationship with TT as shown in Equation 2-4 below (Lecler, 2003):
Where
Rfac = proportion of total soil depth that is penetrated by roots
= 0.4 for TTA < 340
= min (1, 0.6 (TT-340)/(980-340) + 0.4) for TTA . 340
TTA = accumulated thermal time
2.7.3.4. Transpiration under conditions of soil water stress, runoff, drainage and effective rainfall
The procedures used in ZIMsched 2.0 for the calculation of:
Transpiration if the soils are too wet or too dry,
Surface runoff (or stormflow),
Drainage or deep percolation, and
Effective rainfall,
were unchanged from the algorithms used in the original crop yield and irrigation
scheduling tool, ZIMsched.These procedures are described by Lecler (2000).
ZIMsched 2.0 was developed to help ensure the long term viability of the sugarcane industry by increasing insight into the performance of the various water management and irrigation systems together with the development and adoption of strategies to improve performance (Lecler, 2003).
2.7.3.5. Irrigation systems uniformity
To account for the effects of irrigation uniformity on systems performance, the water
budget and yield estimate in ZIMsched 2.0was based on the average of three equal
areas each receiving different amounts of water at each irrigation application (Lecler, 2003). The simulated amount of water on each of the three areas was varied, dependent on the uniformity measure of the irrigation system.
One third of the area was simulated to receive the mean irrigation water application, one third received the mean water application plus a percentage (D %) of the mean and one third received the mean minus a percentage (D %) of the mean (Lecler, 2003).
Assuming normally distributed irrigation water applications, Equations 5, 6 and 2-7 were derived to relate the percentage deviation (D %) corresponding to a given coefficient of uniformity (CU), statistical uniformity (SU) or distribution uniformity (DU) respectively (Lecler, 2003). For example, if the mean application for a furrow irrigation event is 50 mm, and the DU was equal to 60, one third of the area would receive an average of 50 mm, one third would receive an average of 69 mm and one third would receive an average of 31 mm at each irrigation water application (Lecler, 2003).
D% = 96.48 - 96.50. (DU/100) Equation 2-5
D% = 122.49 - 122.49. (SU/100) Equation 2-6
D% = 149.97 - 149.96. (CU/100) Equation 2-7
Where
D% = percentage of mean application to be added and subtracted from the mean to determine irrigation application amounts
DU = Distribution Uniformity SU = Statistical Uniformity
CU = Christiansen’s Coefficient of Uniformity
Since the ZIMsched 2.0 was developed to improve the accuracy of ZIMsched, it still did not cover the future water budget predictions which is the main focus for this study.
2.7.4. Water Administration System (WAS)
According to Benade (2017), the Water Administration System (WAS) which was developed in 2006 is an integrated management tool for irrigation schemes that delivers water on demand through canal networks, pipelines and rivers. WAS is used for water distribution management and for the calculation of canal and dam operating procedures for a given down-stream demand.
WAS program is currently in use at all the major irrigation schemes and a number of smaller irrigation boards throughout South Africa (Benade, 2017). The main benefits of using the WAS information system according to Benade (2017) are as follows: minimizing of water distribution losses, improved control of water orders, releases, distribution and usage per Farmer, management of date and time related flow data collected from electronic loggers or mechanical chart recorders, integrates with the Zednet platform on the Internet which is used to automate the import of data from multiple measuring stations into the WAS database, availability of an extensive list of water reports on a farm and scheme level, increased productivity of scheme management personnel, reliance on an integrated accounting system that improves debit management and Improvement of the overall water management on irrigation schemes.
The program makes use of nine modules, as shown in Figure 2-3 below, which are
fully integrated, making it possible to cross-reference relevant data and information.
Source: (Benade, 2017) Figure 2-3: WAS Modules
These modules can be implemented partially or as a whole, depending on the requirements of the user. The WAS program saves all information in a Firebird (SQL) database that can be installed on a single PC or on a server for use over a network. This makes it possible for the manager, accounts personnel and water office personnel to access the database from PC's in their own offices. What makes the WAS program unique is the fact that it is an integrated system that includes the water allocations, water use, water distribution, water measurement, crop water use, billing information and a bulk SMS system (Benade, 2017).
Of all these nine modules, the researchers’ interest in this project proposal is the water order, water release and crop water use modules. The water order module is based on flow rate and duration, the Water release module links with the Water administration and Water order modules and lastly the crop water use module which is used to calculate the water required for a specified period for all planted crops is based on the plant date, area planted and the crop water use information. The information needed is the Days After Planting (DAP) and the corresponding water use per day (mm/day) apart from the plant date and area planted in the crop water use module (Benade, 2017).
With all the information pertaining to how these modules operate, a gap was observed on these three modules. In irrigation design, the crop water needs determine the water discharge but in this case, the water order module is being defined by the pump flow rate and pumping duration. This makes the water order module more biased towards the billing purposes only not for the supply of adequate crop water needs as the water supply is determined by the abstraction capacity therefore there is no room for expansion to meet the crop water needs for increased production. In the case of the crop water use module, that one is more biased towards irrigation crop water needs as only the date after planting which defines the crop factors and daily water use are used.
2.7.5. Water Sense Water Budget Tool
Water Sense created the Water Budget Tool as one option to help builders, landscape professionals, and Water Sense irrigation partners meet the criteria for the 2009 Water Sense Single-Family New Home Specification (WaterSense, 2010). According to WaterSense (2010), the water budget tool is comprised of three sections (Part 1, Part 2, and Part 3), each on its own worksheet and works as follows:
Part 1: Baseline & LWA- Collects basic information and calculates the landscape water allowance (LWA).
Basic Information
A. Fill in the information for the landscape in the white boxes at the top of the sheet as shown in Figure 2-4 below:
Source: (WaterSense, 2010)
Figure 2-4: Basic information data input on a Water Sense Water Budgeting Tool
B. To get the peak watering month, evapotranspiration (ETo) value, and rainfall, One
has to visit the Water Budget Data Finder on the Water Sense website. Enter the zip code where the landscape is located and click the “Go” icon. The tool will give you three pieces of information: peak watering month, evapotranspiration (ETo)
value, and rainfall as shown in Figure 2-5 below. Enter the peak month (June in the example) in the water budget tool in the white box labeled “peak watering
month.” Record and save the other pieces of information (ETo and Rainfall) as
you will need these later in the tool.
Source: (WaterSense, 2010)
Figure 2-5: Water Budget Data Finder showing peak watering month, evapotranspiration (ETo) value, and rainfall
C. The drop down menu is used to select whether or not an irrigation system is installed on this site.
This information will populate automatically throughout the tool, and you will not have to enter it again. Now, proceed through the following steps.
Step 1
Step 1A: Determine and input the area of the landscape as shown in Figure 2-6 below:
Source: (WaterSense, 2010)