Study of the Unmet Needs of Adults with
Disabilities in Massachusetts, 2007
Office on Health and Disability
Division of Health Promotion and Disease Prevention Bureau of Community Health Access and Promotion
Massachusetts Department of Public Health
Deval Patrick, Governor Tim Murray, Lieutenant Governor
JudyAnn Bigby, Secretary, Executive Office of Health and Human Services John Auerbach, Commissioner, Department of Public Health
ii
Acknowledgements
This document was prepared by the Massachusetts Department of Public Health and the Center for Survey Research, University of Massachusetts Boston.
Project staff from the Center for Survey Research, University of Massachusetts Boston included: Karen Bogen, PhD
Nelly Oliver, MA Mary Ellen Colten, PhD
Project staff from the Office on Health and Disability, Bureau of Community Health Access and Promotion, Massachusetts Department of Public Health included:
Monika Mitra, PhD Anita Albright, MA
We wish to express our gratitude to the residents of Massachusetts who participated in this survey, and to the Disability Policy Consortium (DPC) and the Home and Community Based Services Committee of the DPC who helped design and develop this study.
The following people provided invaluable input and guidance: Cynthia Boddie-Willis, Director, Division of Health Promotion and Disease Prevention; Susan Keyes, Senior Research Analyst, Health Survey Program; and Stewart Landers, Interim Director, Bureau of Community Health Access and Promotion.
Funding for this project was provided bythe Massachusetts State Legislature. The information provided in this material was also supported by Grant/Cooperative Agreement Number
U59/CCU103370-17 from the Centers for Disease Control and Prevention (CDC), National Center on Birth Defects and Developmental Disabilities. The contents are solely the responsibility of the authors and do not necessarily represent the official views of CDC.
To obtain additional copies of this report, contact: Monika Mitra, Epidemiologist
Office on Health and Disability
Massachusetts Department of Public Health 250 Washington Street, 4th Floor
Boston, MA 02108-4619 Phone: (617) 624-5592 TTY: (617) 624-5992
Table of Contents
Executive Summary………. iv Introduction and background….……….. 1 Findings……… Description of Interview Participants ..……… Demographics……… Employment….. ……….. Health Insurance……...……… Disability Status ……….. General Health……….. 2 2 2 3 4 4 5 Unmet Needs ………...
ADLs and IADLs ..………. Assistive Technology ………. Adapting Environment ………... Home Care ……….. Home-Delivered Meals ..……… Case Management ……….. Information ………. Recreation and Exercise .……… Transportation ………. Access to Care ………. Hospital, Nursing Home, Rehabilitation …. Physical and Occupational Therapy ……… Prescription Drugs ………... Work Accommodations ………... 5 6 7 7 8 11 11 11 12 12 13 14 14 14 14 Appendix A: Methodology………..………… 15 Appendix B: Survey Questions. ……… 20
iv
Executive Summary
Introduction and Background
The Massachusetts State Legislature made funding available for the Massachusetts Department of Public Health (MDPH) to support research activities to determine the need for home and community-based services and to create an economic profile of adults with neurological and physical disabilities and their families. MDPH contracted with the Center for Survey Research, University of Massachusetts Boston (CSR), to conduct the study. In a unique effort to look at an underserved group, this study is designed to consider the unmet needs of adults age 18-59 years with disabilities.
The MDPH and CSR agreed that for this study, using a sub-sample of a statewide random digit dial sample representative of Massachusetts households would be the most efficient and cost effective design. The Massachusetts Behavioral Risk Factor Surveillance Systems (BRFSS), the sample from which this study was taken, is described in detail in Appendix A, along with a detailed description of the survey methodology and the exact criteria for selection into the study.
An important caveat regarding the sample is to understand that it very likely under-represents the population of adults with disabilities in the state and, thus, understates the full set of potential needs of this group. This data collection effort was designed as an initial attempt to survey this population, an exploration of what we could learn about the unmet needs of persons with disabilities. This report represents CSR’s perspective on what the data tell us about the unmet needs of adults with disabilities in Massachusetts. This report is based on 571 interviews and presents the main quantitative findings from weighted frequencies of the survey data.
Description of Interview Participants Demographics
• There were more female survey respondents (60%) than male (40%). The average age of respondents was nearly 45 years, and most respondents (90%) identified themselves as White. In general, the survey participants had some college or higher education (71%). Over three-fourths of respondents (78%) lived with at least one other adult, and about 40% had a child, age 17 years or younger, living with them.
Employment
• Half of the survey respondents (51%) reported working at a job for pay.
• For the half who was not working for pay, over 80% said that they were not working or stopped working because of their health condition or disability.
Health Insurance
• Almost all respondents (98%) reported having some type of health insurance. • Over half (57%) reported having private health insurance only.
Disability Status
• Most respondents were not new to their health condition or disability – nearly half (48%) estimated that they had had their condition for more than five years. Nine of ten respondents reported that their health condition or disability began after age 18.
• The survey contained a number of questions about respondents’ difficulties with Activities of Daily Living (ADLs) and Instrumental Activities of Daily Living (IADLs). The greatest number of reports of difficulty, and the activities for which they were most likely to report receiving help, were typically the IADLs, including heavy housework and shopping. The fewest reports of difficulty were for eating and using the toilet.
• On average, respondents reported having difficulty with less than one ADL and about one and a half IADLs, for a combined average of about two ADLs/IADLs.
• While all respondents met the survey’s definition of having a disability, only three-fourths (74%) described themselves as having a disability of some kind, when asked in a direct question.
General Health
• Over one-third of respondents (37%) described their health as fair or poor, with just one quarter reporting excellent or very good health.
Unmet Needs ADLs and IADLs
• Housework is the area in which the most respondents reported needing help or more help. About half of those having difficulty with heavy housework reported needing more help, and over half of those having difficulty with light housework also reported needing more help. • There appear also to be unmet needs for other IADLs, including shopping, meal preparation,
and managing money.
• Respondents had lower reported need for more help with most of the ADLs, the exceptions being the two ADLs related to mobility (walking and getting in or out of bed or chairs). Assistive Technology
• About 11% of respondents said that there is equipment that they need for their health condition or disability that they do not have, and nearly nine out of ten of them (89%) said that the reason they were not able to get the equipment they needed was the cost or that insurance would not cover it.
• Approximate out-of-pocket expenses in the past 12 months for equipment ranged from zero to $7500, with a mean of about $513.
• When asked how difficult it was to afford these expenses, about two in five said it was very or somewhat difficult (41%).
vi Adapting Environment
• About 13% of respondents reported ever needing some adaptation to their homes, and about half of them (45%) reported currently needing the adaptations (or more of them) to be done. Most (89%) respondents needing work done reported cost as a factor.
• About three-fourths of those needing adaptations said they would like more information about how to pay for them.
Home Care
• Three of five respondents (about 61%) reported that they receive no in-home help at all. • For those who receive in-home assistance, informal care was reported much more frequently
than formal care from an agency or paid care or professional nursing care. About 32% of respondents receive informal care only, about 2% receive formal care only, and about 6% receive both kinds of care.
• Respondents who reported receiving informal care in their homes from family or friends who live with them received about 17 hours of this kind of help per week in a typical week. Respondents who reported receiving informal care from people who do not live with them received about 11 hours of this kind of care per week in a typical week.
• The respondents who reported receiving formal care from an agency, paid person, personal care assistant or attendant, or a volunteer reported receiving about 11 hours of this kind of care per week in a typical week.
• About 7% of respondents receiving no in-home care said that they need help with health care, personal care, or tasks of daily living.
• One-third of the respondents who already receive some help at home said that they could use more help.
• Most respondents who currently receive in-home help of some kind did not spend anything for that care (79%), but respondents who did spend something reported spending on average $298 for that care in the past 12 months. About 58% of those who did have out-of-pocket care expenses reported that this spending was very or somewhat difficult.
Case Management
• There appears to be a fairly high need for case management kinds of services, including help finding services (20%), help keeping track of services (20%), advice about eligibility for public benefit programs (18%), and help finding caregivers to help at home (15%).
Access to Care
• About 20% of respondents said that they did not see a primary care provider when they needed to in the past 12 months, and about 20% said they did not see a medical specialist when they needed to in the past 12 months. About 19% said they did not see a mental health worker when they needed to in the past 12 months.
• Eight percent of respondents reported that their health condition or disability resulted in problems getting the health care they needed in the past 12 months. About one-third of them (35%) said that the provider was not knowledgeable about the disability. About one-fourth of them (26%) said that the equipment at the health care facility was not accessible, and 12% said that the site itself was not physically accessible. Approximately 17% said the provider could not communicate with them.
Hospital, Nursing Home, Rehabilitation
• One-third of all respondents (33%) were hospitalized for at least one night in the past 12 months.
• About 6% of respondents said they or their doctor thought they needed hospitalization in the past 12 months, but they were not hospitalized.
Physical and Occupational Therapy
• About one-third of respondents (34%) saw a physical or occupational therapist in the past 12 months; however, about one-fourth of them (26%) said that they did not get as much therapy as they needed.
• About 8% of respondents said they did not get needed physical or occupational therapy. Prescription Drugs
• Almost nine of ten respondents (87%) reported taking prescription medication. About 13% of respondents reported that there is a medication that they need but do not get.
• On average, respondents spent nearly $5500 out of pocket in the past 12 months for their medications, with over 60% of them spending in excess of $1000 per year.
• While about half of respondents said that it was not difficult at all to afford out-of-pocket payments for prescriptions, about 30% said it was very or somewhat difficult.
Work Accommodations
• About half of the survey respondents were employed for pay at the time of survey administration. Of those, nearly one-third (33%) reported that their health condition or disability made it very or somewhat difficult to work in their job.
• About one-third of the currently employed (33%) reported that they had needed their employer to make accommodations because of their health condition or disability. Among those needing any accommodation, about three-fourths (75%) reported that their employer had done most or all of what they could do. About one in ten said their employer had done none of what they could do.
Other Needs: Home-Delivered Meals, Information, Transportation
• Fewer than 1% of respondents reported that they received home-delivered meals. Among the majority that did not receive home-delivered meals, about 5% said that they felt like they need them.
• About one-third of respondents (34%) reported that they wanted to get information about services for people with a health problem or disability but did not know where to get it. One-fourth of respondents (25%) said that they wanted information about legal rights for people with their health problem or disability but did not know where to get it.
• About 17% of respondents reported having had a transportation problem getting where they needed to go in the past 12 months. Most of that group (77%) said it has been very or somewhat difficult getting where they would like to go.
Introduction and Background
The Massachusetts State Legislature made funding available for the Massachusetts Department of Public Health (MDPH) to support research activities to determine the need for home and community-based services and to create an economic profile of adults with neurological and physical disabilities and their families.1
MDPH contracted with the Center for Survey Research, University of Massachusetts Boston (CSR), to conduct the study. MDPH and CSR, in collaboration with the Disability Policy Consortium (DPC) and the Home and Community-Based Services Committee of the DPC, designed and developed the study. The objective of the study was to examine the unmet needs for home and community-based services for people with disabilities who fall in the age gap between children (under age 18) and older adults (age 60 and over), two groups who are known to have more coverage. In a unique effort to look at this underserved group, this study was designed to consider the unmet needs of adults age 18-59 years with disabilities.
The funding for this initial study was not sufficient to conduct a stand-alone data collection that is fully representative of the state population of adults age 18-59 with disabilities. The costs to screen for and identify such a sample are prohibitive. Therefore, we considered a number of options for studying this population, including sampling from lists of members of different disability organizations, such as the Multiple Sclerosis Society, the Parkinson's Association, and the Spinal Cord Injury Association. The MDPH and CSR agreed that for this study, using a sub-sample of a statewide random digit dial sub-sample representative of Massachusetts households would be the most efficient and cost effective design. The Massachusetts Behavioral Risk Factor Surveillance System (BRFSS), the sample from which this study was taken, is described in detail in Appendix A, along with a detailed description of the survey methodology.
An important caveat regarding the sample is to understand that it very likely under-represents the population of adults with disabilities in the state and, thus, understates the full set of potential needs of the group. Individuals with the most severe limitations were not included in this study because the BRFSS does not include individuals living in institutions. In addition, the BRFSS methodology precludes anyone from assisting the selected respondent in completing the
interview if the selected adult had difficulty in participating for any reason. Other limitations of the BRFSS methodology are described in Appendix A.
This data collection effort was designed as an initial attempt to survey this population, an exploration of what we could learn about the unmet needs of persons with disabilities. The goal was to do a baseline data collection on this topic with the expectation that the findings would suggest areas for further study in a more intensive data collection effort. This report is the culmination of the project and represents CSR’s perspective on what the data tell us about the unmet needs of adults with disabilities in Massachusetts.2 The report presents the main quantitative findings of the survey.
1
Following is what the 2006 state legislation made available: “Provided further, that $120,000 shall be expended for a study for home and community based services and an economic profile of individuals and families with neurologically and physically disabled adults under 65; and provided further, that said study shall be one-time in nature and shall not result in any annualization in fiscal year 2007.”
2
There is a separate report about the caregivers’ outlook about the unmet needs of the people they care for as well as their unmet needs as caregivers.
Findings
This report is based on 571 interview participants. Survey participants were Massachusetts adults, age 18-59, who reported in the BRFSS that they had a health condition or disability that limited their activities or required them to use special equipment and agreed to be contacted for a follow-up survey. The study also included respondents who self-identified as having physical, mental, emotional or communication-related disabilities. Only respondents who answered the BRFSS in English were eligible for inclusion. The exact criteria for selection into the study are described in Appendix A. The first part of this report describes their health, the extent and nature of the disability, health insurance, employment, and demographics. The second part of the Findings section is more specific to the questions this survey was designed to address: the needs that adults with disabilities have that are not sufficiently covered. All of the results reported here are based on weighted data, described in the weighting section of Appendix A. Description of Interview Participants
As was expected, the adults with disabilities who were interviewed varied widely in terms of their health status, type of disability, severity of disability, and demographics. As such, there does not appear to be a “typical” respondent, but there are some patterns that emerge, which are covered in the following narrative.
Demographics
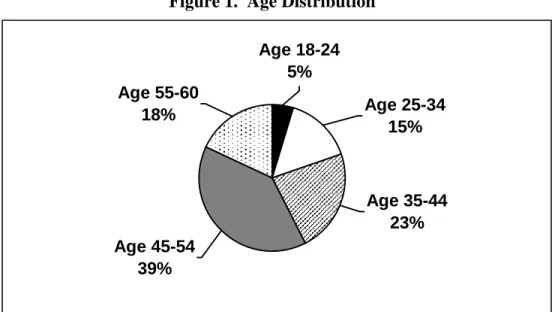
There were more female survey respondents (60%) than male (40%), consistent with other data collections and known survey literature. Over half of respondents (55%) were currently married. To be eligible for this survey, respondents needed to be 18-59 years old at the time of the BRFSS administration (a few had turned 60 by the time of the current interview). Given the disability eligibility criteria, it is not surprising that the ages tended towards the higher end of the age range. The average age of respondents was nearly 45 years, with fewer respondents in the younger age groups. The following chart shows the age group distribution.
Figure 1. Age Distribution
Age 18-24 5% Age 45-54 39% Age 55-60 18% Age 25-34 15% Age 35-44 23%
Most respondents (89%) identified themselves as non-Hispanic White, with a small number reporting Hispanic (3%), non-Hispanic Black (3%), Asian (3%), American Indian or Alaska Native (3%), or something else (4%). (Respondents could report more than one race, which is why the percentages total to more than 100.)
In general, the survey participants had some college or higher education (71%). Only 6% reported less than a high school diploma, and another 22% reported that a high school diploma was their highest degree.
Income was fairly evenly distributed among the groups shown in this chart. Figure 2. Household Income Distribution
15 29 26 24 6 0 5 10 15 20 25 30 35 2006 Family Income Per cen tag e
Less than $30K $30-60K $60-90K More than $90K Missing
Most survey respondents (66%) lived in houses and the rest lived in apartments or
condominiums. Over three-fourths (78%) lived with at least one other adult, and about 40% had a child, age 17 or younger, living with them. Table 1 summarizes respondents’ living situations.
Table 1. Living Situations % (n=570) Live with adults only 45.3 Live with children and adults 32.7
Live alone 14.2
Live with children only 7.9 Employment
Half of the survey respondents (51%) reported working at a job for pay, but the remaining respondents, all of working age, were not currently working for pay. Those who were working reported working an average of 37.5 hours per week, ranging from just 3 hours per week to as many as 85 hours per week, with most reporting a 40-hour work week. For the half who were not working for pay, over 80% said that they were not working or stopped working because of their health condition or disability (in whole or in part).
Health Insurance
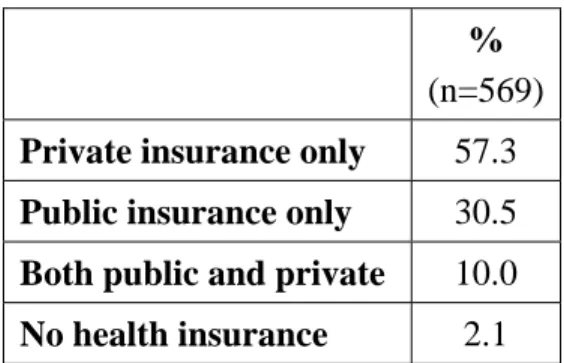
Almost all (98%) survey respondents reported having some type of health insurance. Table 2 summarizes the health insurance status of respondents. Over half (57%) reported having private health insurance only. Two of five respondents reported coverage under some kind of
government program – CommonHealth, MassHealth, Medicaid, Medicare, veterans’ coverage, or some other government program. About one-fourth of those covered by a government program also had private insurance or a medigap plan.
Table 2. Health Insurance Coverage % (n=569) Private insurance only 57.3 Public insurance only 30.5 Both public and private 10.0 No health insurance 2.1 Disability Status
While all respondents met the survey’s definition of having a disability, only three-fourths of them (74%) described themselves as having a disability of some kind, when asked in a direct question. Over 90 percent of respondents said that they were limited because of a physical, mental, or emotional problem, over one-fourth (28%) reported using special equipment, and nearly four in ten (39%) reported having trouble learning, remembering, or concentrating. Most respondents were not new to their health condition or disability – nearly half (48%) reported having had their condition for more than five years. Nine of ten respondents reported having had their health condition or disability since age 18 years. About 4% reported having had their disability since birth, and 7 reported that their condition began between birth and age 17 years. The majority of respondents can be described as having an adult-onset disability.
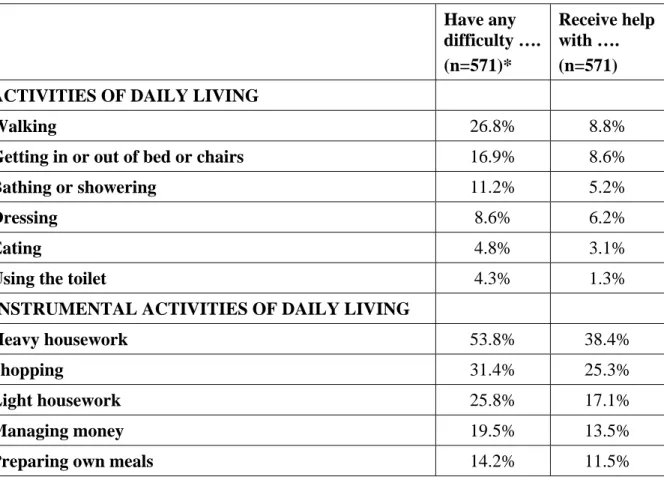
The survey contained a number of questions about respondents’ difficulties with Activities of Daily Living (ADLs, including bathing and showering, dressing, eating, getting in or out of bed or chairs, walking, and using the toilet) and Instrumental Activities of Daily Living (IADLs, including doing light housework such as light cleaning, straightening up and washing dishes, doing heavy housework, preparing meals, shopping, and managing money). As shown in Table 3, the fewest reports were for having difficulty eating and using the toilet. The greatest number of reports, and the activities for which they were most likely to report receiving help, were typically the IADLs, including heavy housework and shopping. More than half of respondents reported having difficulty doing heavy housework and over one-third reported receiving help. On average, respondents reported having difficulty with less than one ADL and about one and a half IADLs, for a combined total of about two ADLs/IADLs.
General Health
Over one-third of respondents (37%) described their health as fair or poor, with just one quarter reporting excellent or very good health. About one in five (21%) reported that their health limited their social activities most or all of the time in the past month, and another two in five (44%) reported that their health limited their social activities some of the time in the past month.
Table 3. ADLs and IADLs – having difficulty and receiving help (based on full sample) Have any difficulty …. (n=571)* Receive help with …. (n=571) ACTIVITIES OF DAILY LIVING
Walking 26.8% 8.8%
Getting in or out of bed or chairs 16.9% 8.6%
Bathing or showering 11.2% 5.2%
Dressing 8.6% 6.2%
Eating 4.8% 3.1%
Using the toilet 4.3% 1.3%
INSTRUMENTAL ACTIVITIES OF DAILY LIVING
Heavy housework 53.8% 38.4%
Shopping 31.4% 25.3%
Light housework 25.8% 17.1%
Managing money 19.5% 13.5%
Preparing own meals 14.2% 11.5%
* The number of unweighted cases varies from 568-571, depending on the number of missing cases.
Unmet Needs
The goal of the study was to describe and quantify possible unmet needs of adults with
disabilities. The survey measured unmet needs in a number of ways, including questions about specific activities for which the person might need help as well as general questions about needing help or more help.
ADLs and IADLs
Table 4 shows the percentage of respondents who said that they needed more help with ADLs and IADLs.3 The first column shows the percentage of those having difficulty with that ADL or IADL who reported needing more help. The second column is based on the full sample, which gives an indication of the magnitude for the population as a whole, not just for those having difficulty with that particular activity.
Table 4. ADLs and IADLs – need more help
Need more help with …. Based on those having difficulty* Based on the full sample (n=571) ACTIVITIES OF DAILY LIVING
Getting in or out of bed or chairs 33.2% 5.6%
Using the toilet 32.1% 1.3%
Walking 28.5% 7.6%
Bathing or showering 27.4% 3.1%
Dressing 14.1% 1.1%
Eating 3.3% 0.1%
INSTRUMENTAL ACTIVITIES OF DAILY LIVING
Light housework 52.5% 13.6%
Heavy housework 50.8% 27.3%
Preparing own meals 49.1% 7.1%
Shopping 36.9% 11.6%
Managing money 34.6% 6.7%
* The number of unweighted cases varies depending on how many respondents reported that they had difficulty with a particular ADL/IADL. The numbers vary from 21 (for help eating) to 354 (for heavy housework).
Housework was the area in which the most respondents reported needing more help. About half of those having difficulty with heavy housework, such as washing floors or windows, reported needing more help, representing over one-fourth of respondents in the full sample. Likewise, over half of those having difficulty with light housework, such as washing dishes or
straightening up, reported needing more help with that, but that represents a lower percentage of
3
Respondents who said they had difficulty with an activity and already received some help were asked if they needed “more help than they currently receive”; those who reported having difficulty with an activity but did not
the full sample (about 14%). Respondents had lower reported need for more help with most of the ADLs, the exceptions being the two ADLs related to mobility (walking and getting in or out of bed or chairs).
Assistive Technology
Based on a number of specific questions about equipment use, about two-thirds of respondents (68%) did not report using any special equipment for their health problem or disability.4 Among respondents who reported not using any special equipment, 8% reported that there was special equipment that they needed for their health condition or disability but did not have. Among the one-third of respondents who already reported using equipment for their health condition or disability, 18% reported that there was any additional equipment they needed. In total, about 11% of respondents overall said that there is equipment that they need but do not have. When asked what equipment they needed, respondents reported a variety of things ranging from hold bars in the bathroom, shower stools, and orthotics to things that are very expensive and harder to obtain such as scooters, stair lifts, adapted computers, and adjustable beds.
Respondents who reported using a wheelchair, scooter, or accessible vehicle were asked about equipment repairs in the past 12 months that may have left them without a way to get around. Over two-thirds of the respondents who reported needing a repair in the past 12 months (70%) said that during the time of the repair, they were without a way of getting around. However, not very many respondents reported needing repairs, so the number reporting that they were without a way of getting around is actually a small percentage of the population of adult disabled (about 1% of the sample as a whole).
Respondents who reported needing equipment they did not have for their health condition or disability were asked why they were not able to get the equipment they needed. Nearly nine out of ten (89%) reported equipment cost or noncoverage of the equipment by their insurance as barriers. Other reasons for inability to obtain needed equipment included lack of knowledge about where to get the equipment, unavailability of the equipment in their community, or their own lack of effort to obtain the equipment.
Respondents who used equipment for their health condition or disability were asked their approximate out-of-pocket expenses for the equipment during the past 12 months. Reported costs ranged from zero to $7500, with a mean of about $513, including the half of respondents who said they had no out-of-pocket equipment expenses in the past year. When asked how difficult it was to afford these expenses (if they had any), about two in five said very or
somewhat difficult (41%) and about three in five (59%) said a little difficult or not difficult at all. Adapting Environment
About 13% of respondents reported ever needing some adaptation to their homes, and about half of them (45%) reported currently needing the adaptations (or more of them) to be done.
Respondents reported a number of reasons why the adaptations have not been done, including cost (89% of respondents needing work done), living in a rental unit that cannot be changed
4
The number of reports is somewhat different when respondents were asked the single screener question about equipment use. That rate was closer to three-fourths than two-thirds.
(15%), or inability to adapt the structure (20%). Among those needing some adaptation, about three-fourths (74%) reported that they would like more information about how to pay for
adaptations. These percentages, based on just those who said they ever needed some adaptations to their home, represent a fairly small percentage of the total pool of respondents. Specifically, of the total sample, about 6% of respondents said that they currently need some adaptation to their home, 5% of the total sample said they have not had the adaptation done because of the cost, and about 4% said they would like more information about how to pay for adaptations. Home Care
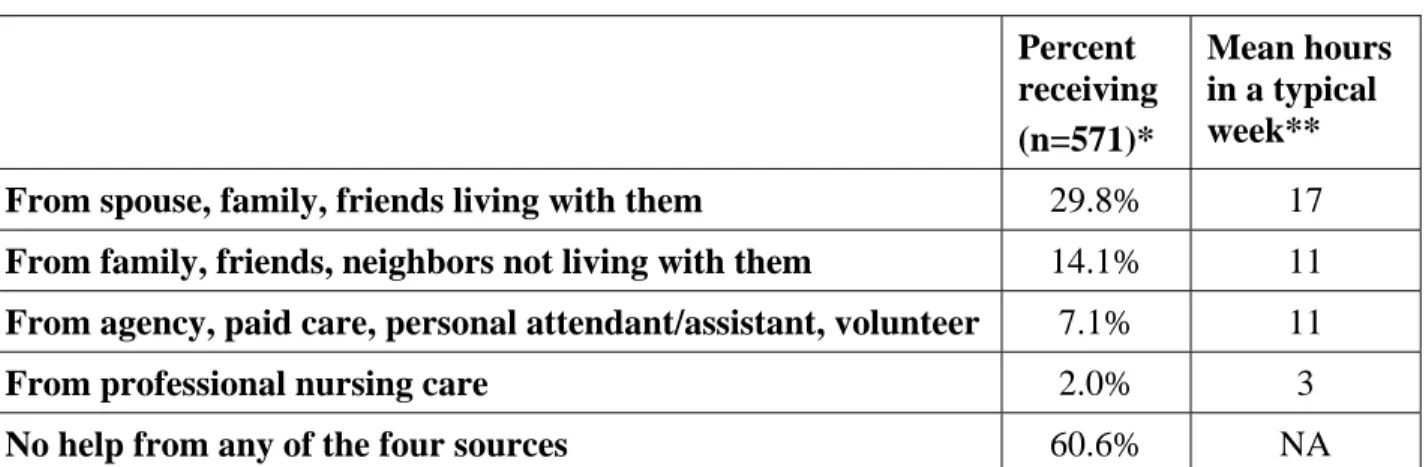
As shown in Table 5, the survey contained questions about four different sources of in-home help. The first two kinds of care – from spouse, family, or friends living with them and from family, friends, neighbors not living with them – are considered informal care, and the other two types are formal care. As shown in Table 6, informal care is reported much more frequently than formal care. Within the informal care group, Table 7 shows that most of that care comes from others living in the household with the respondent.
Table 5 shows the percentage of respondents who receive each of the four different kinds of in-home help and how many hours per week each was received. Nearly three in ten respondents (about 30%) reported receiving informal care in their homes from spouse, family, or friends who live with them. Respondents received about 17 hours of this kind of help per week in a typical week, with most reporting more than five hours per week. About 14% of respondents reported receiving informal care from family, friends, or neighbors who do not live with them.
Respondents received about 11 hours of this kind of care per week in a typical week, with about one-fourth reporting an hour or less and two in five reporting more than five hours per week. Approximately 7% of respondents reported that they received formal care from an agency, paid person, personal care assistant or attendant, or a volunteer. They reported receiving an average of 11 hours of this kind of care per week in a typical week, with slightly more than half reporting fewer than five hours per week. Very few respondents (2%) received professional nursing care in their homes, with most of them (80%) reporting an hour or less of nursing care per week.
Table 5. In-home care by source of care given Percent receiving (n=571)* Mean hours in a typical week**
From spouse, family, friends living with them 29.8% 17 From family, friends, neighbors not living with them 14.1% 11 From agency, paid care, personal attendant/assistant, volunteer 7.1% 11
From professional nursing care 2.0% 3
No help from any of the four sources 60.6% NA
* The number of unweighted cases varies from 570-571, depending on the number of missing cases.
** The number of unweighted cases varies depending on how many respondents reported
receiving each type of care. The numbers vary from 12 (for professional nursing care) to 161 (for spouse, family friends living with them).
Table 6. In-home care – formal versus informal Percent receiving
(n=570)
Formal care only 2.3%
Informal care only 31.5% Both formal and informal care 5.6% No help from any of the four sources 60.6%
Table 7. In-home care – informal
Percent receiving
(n=570) Informal care from only those living with them 23.0% Informal care from only those not living with them 7.2% Informal care from both those living with them
and those not living with them 6.8%
Three of five respondents reported that they receive no help from any of the four sources. They were asked about possible unmet needs, and about 7% (representing about 4% of all
respondents) said that they need help with health care, personal care, or tasks of daily living. Table 8 shows percentages of persons currently not receiving help who reported needing in home care, followed in the second column by the numbers based on the full sample.
Table 8. In home care needed by people currently not receiving care Not receiving
help but need in home care (n=34)
Based on the full sample
(n=571) A few times a month or less 40.2% 1.6%
1-2 hours per week 22.2% 1%
3-5 hours per week 30.8% 1%
More than 5 hours per week 6.8% <1%
Respondents who already receive some help at home were asked if they get all the help they need or if they need more. One third (37%) of those currently receiving some help said that they could use more help (approximately 14% of the full sample). This group reported needing more hours of help than the group currently not receiving help at all, as shown in Table 9.
Table 9. In home care needed by people currently receiving care Receiving help
but need more in home care (n=85)
Based on the full sample
(n=571) 1-2 hours per week 7.4% 1%
3-5 hours per week 28.7 4%
6-10 hours per week 27.4 4%
More than 10 hours per week 36.4 5%
Respondents were asked why they were not getting the help they needed. For most respondents not getting any help but needing it, the reason they were not getting the help they needed was cost or noncoverage by insurance (75%). Half of respondents in this group (who were about 4% of the total sample) also reported that the quality of care available (57%) and not knowing where to look (53%) were barriers. For respondents getting some in-home help, the reported reasons for not getting the help they needed were similar: cost or non-coverage by insurance (78%), quality of care available (29%), not knowing where to look (57%), and not being able to find help (31%).
Most respondents who were receiving in-home help of some kind did not spend anything for that care (79%). Respondents who did spend something reported spending on average $298 for that
care in the past 12 months. About 58% of those who did have out-of-pocket care expenses reported that this spending was very or somewhat difficult.
Home-Delivered Meals
Fewer than 1% of respondents reported that they received home-delivered meals. Among the majority who did not receive them, about 5% reported that they feel like they need them. Those who felt like they needed them reported needing an average of 6 meals per week, with most reporting that they needed either just a couple (27%) or at least seven meals per week (28%). Over three-fourths of respondents who would like home-delivered meals (79%) reported that the reason they did not receive them is that they did not know how to arrange it. About one third (35%) reported that cost is the reason they were not currently receiving home-delivered meals. Case Management
The survey contained a number of questions regarding unmet needs for case management. This is a difficult area to measure, as there does not seem to be consistent terminology in use by potential recipients, and case management is a term used in many social service contexts. Respondents were not asked directly about case management, but instead were asked about several specific kinds of assistance or services that can be components of case management. If the respondent did not receive that service in the past 12 months, he/she was asked if they felt like they needed that help. Table 10 shows the percentage of respondents in the full sample who said that they needed different kinds of specific help from a case manager.
Table 10. Percent who needed case management services in the past 12 months
Felt like needed …. %
(n=571) Help keeping track of services 19.6%
Help finding services 19.5%
Advice about eligibility for public benefit programs 18.3% Help finding caregivers to help at home 15.2% Information
One possible area of unmet need is for information about services; that is, adults with health problems or disabilities may not know where to get the information they need about different possible options. In a number of places in the survey, lack of information was offered as a possible reason for a specific unmet need. In addition, the survey contained some general questions about accessing information and the need for additional information. About 13% of respondents reported having received information about services in the past 12 months from a social worker or case manager. About 11% reported receiving such information from an
organization that helps people with health conditions or disabilities, such as Easter Seals, the MS Society, or similar groups. About 13% reported receiving services information from a state or other government agency. However, among respondents who did not report getting information from a government agency, nearly two-thirds (62%) said they did not know of any state agency
or other government agency that provides information about services to people with a health problem or disability.
Respondents were also asked about not getting information they needed, and about one third (34%) reported that they wanted to get information about services for people with a health problem or disability but did not know where to get it. One-fourth of respondents (25%) said that they wanted information about legal rights for people with their health problem or disability but did not know where to get it.
Recreation and Exercise
Nearly four of five survey respondents (78%) reported that they did some kind of regular physical exercise. Few, though, participated in a physical recreation program, such as a sports league or group physical activity (12%). Those who did not participate in a recreation program were asked if they would like to and if so, why they did not participate. About half said they would like to participate in such an activity (47%), but they did not because of cost (51%), they did not know how to arrange it (43%), there were no such places or programs nearby (32%), the programs were not designed for people with disabilities (30%), or they could not get there (21%).
Transportation
About 17% of respondents reported having had a transportation problem getting where they needed to go in the past 12 months. Most of that group (77%) said it was very or somewhat difficult getting where they would like to go. When asked about possible kinds of assistance with transportation that would make it easier to get where they wanted to go, about
12% suggested better access to good public transportation for people with disabilities and about 12% suggested better information about available transportation options. Fewer reported that vehicle adaptations would help (about 2%).
One in ten respondents reported having used transportation services for persons with disabilities in the past year; about 4% used The Ride, the Paratransit program that provides door-to-door service to people with disabilities living in selected communities in Massachusetts. For respondents who did not use transportation services for persons with disabilities in the past 12 months, about 13% said they wanted to. Of those, about half (47%) said that they knew of such transportation service, but the rest were unaware of such services. Among respondents who knew about the services but did not use them, reasons for not utilizing the services included:, lack of knowledge about how to contact such services (58%), the service did not meet their needs (33%), the cost (30%), or they did not think they were eligible for such services (25%). (Note that these percentages represent just 1-3% of the full sample.)
All respondents were asked specifically if they ever wanted to use public transportation in the past 12 months but did not do so and why. About 15% said they wanted to but did not, and most reported that the stations or stops were too far from their house (9% of respondents overall) or the schedule did not meet their needs (6%). Others said it was the cost (3%), lack of information (3%), or lack of wheelchair accessibility (1%).
Access to Care
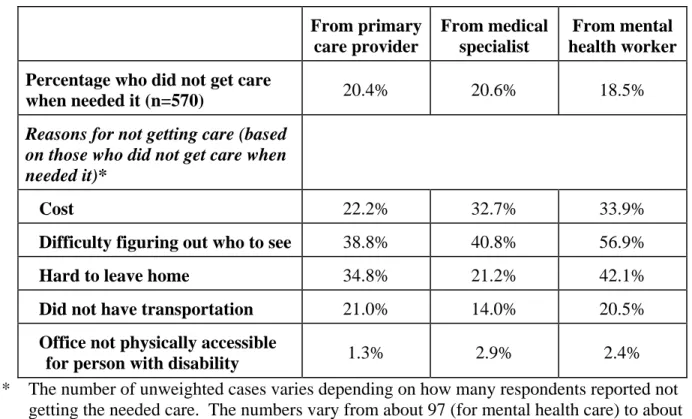
The survey asked about times respondents needed health care but did not get it and why. The questions were asked with respect to primary care providers, medical specialists, and mental health doctors or counselors. Table 11 summarizes the percentage of respondents who did not have sufficient access to medical care and the reasons why.
The reason mentioned most frequently for not getting needed medical care was difficulty
figuring out who to see. Aside from the reasons asked about directly in the survey and shown in Table 11, respondents offered other reasons, including not being able to get appointments with doctors when they needed them (having to wait months to get in), child care problems, and lack of health insurance.
Table 11. Access to care
From primary care provider From medical specialist From mental health worker Percentage who did not get care
when needed it (n=570) 20.4% 20.6% 18.5%
Reasons for not getting care (based on those who did not get care when needed it)*
Cost 22.2% 32.7% 33.9%
Difficulty figuring out who to see 38.8% 40.8% 56.9%
Hard to leave home 34.8% 21.2% 42.1%
Did not have transportation 21.0% 14.0% 20.5% Office not physically accessible
for person with disability 1.3% 2.9% 2.4%
* The number of unweighted cases varies depending on how many respondents reported not getting the needed care. The numbers vary from about 97 (for mental health care) to about 132 (for medical specialist care), though they vary by one or two cases, depending on the number of missing values.
Respondents were asked directly if their health condition or disability resulted in any problems getting the health care they needed in the past 12 months, and 8% said that it had. About one-third of them (35%) said that the provider was not knowledgeable about their disability. About one-fourth of them (26%) said that the equipment at the health care facility was not accessible, and 12% said that the site itself was not physically accessible. Approximately 17% said the provider could not communicate with them.
Hospital, Nursing Home, Rehabilitation
About one-third of all respondents (33%) were hospitalized for at least one night in the past 12 months. The average number of nights (including the people who said none), was
approximately 3 nights. Among respondents who were not hospitalized, about 9% said there was a time when they or their doctor thought they needed hospitalization during the past 12 months, but they weren’t hospitalized. A follow-up question asked about the reasons they weren’t hospitalized. While about 12% said the reason was cost or insurance, most said it was some other reason.
Likewise, respondents who had not stayed in a nursing home or rehabilitation center in the past 12 months were asked if they or their doctor ever thought that was needed. Only about 1% of respondents said yes, they needed a nursing home or rehabilitation stay but did not get one. Physical and Occupational Therapy
About one-third of respondents (34%) reported seeing a physical or occupational therapist in the past 12 months; however, about one-fourth of them (26%) said that they did not get as much therapy as they needed. Of that group, about 60% said the reason was cost or that insurance would not cover it. The two-thirds of respondents who had not had any physical or occupational therapy in the past 12 months were asked if they needed it and if so, why they did not get it. About 8% of all respondents did not get the needed therapy, and of that group, about 35% said it was because of cost or insurance would not cover it. Another 26% said they had difficulty figuring out who to see.
Prescription Drugs
Almost nine of ten respondents (87%) reported taking prescription medication. About 13% of respondents reported that there is a medication that they need but that they did not get. Two-thirds of this group (66%) said that the reason they were not able to get all the prescription medications they needed is the cost and/or insurance will not cover it.
On average, respondents spent nearly $5500 out of pocket in the past 12 months for their medications, with over 60% of them spending in excess of $1000 per year. While about half of respondents said that it was not difficult at all to afford out-of-pocket payments for prescriptions, about 30% said it was very or somewhat difficult.
Work Accommodations
About half the survey respondents were employed for pay at the time of survey administration. Of those, nearly one-third (33%) reported that their health condition or disability made it very or somewhat difficult to work in their current job. About one-third of the currently employed (33%) also reported that they needed their employer to make accommodations because of their health condition or disability. Of those needing any accommodation, about three-fourths (75%) reported that their employer had done most or all of what they could do. About one in ten said their employer had done none of what they could do. Respondents who said that their employers had done at least some of what they could do were asked how difficult it had been to get their employer to make accommodations. Six in ten said it was not difficult at all, about two in ten said it was a little difficult, 16% said it was somewhat difficult, and a small proportion (3%) said it was very difficult.
Appendix A: Methodology
Survey Development and Pretesting
The Center for Survey Research, the Massachusetts Department of Public Health (MDPH), and members of the Disability Policy Consortium (DPC) worked together to develop the survey content. The first step was to review what other kinds of data have been collected about
caregiving needs and to decide which content areas to cover in the 30-minute survey. Once the general content areas were identified, we tried to use questions that had been used in previous surveys. After agreeing on a draft, CSR conducted six cognitive interviews to help understand if respondents were all interpreting the questions as intended. The respondents for the cognitive interviews were recruited through flyers posted on the UMass Boston campus, advertisements posted on the web, and word of mouth. After the cognitive interviews, CSR proposed extensive revisions to the questionnaire. Again, once the group agreed on a re-draft, CSR conducted an initial pretest of 10 telephone interviews using a random sample of cases received from the BRFSS (see explanation of the sample below). Nine of the 10 pretest interviews were taped and CSR behavior coded the interactions between interviewer and respondent to flag questions that were not working as expected (with a straightforward back-and-forth between interviewer and respondent). After the first pretest, CSR proposed modest revisions to the questionnaire, which were agreed upon by the group and tested in a second telephone pretest with 10 respondents, also a random sample from the BRFSS sample. Very minor changes were made to the questionnaire following the second pretest.
Sample
The sample population for this survey consisted of a subset of respondents to the 2007
Massachusetts Behavioral Risk Factor Surveillance System (BRFSS). We used BRFSS cases that had been interviewed between January and August 2007. Following are the eligibility criteria for the Unmet Needs Study:
• BRFSS respondent was aged 18-59 years at the time of the BRFSS interview. • Respondent said Yes to at least one of the two BRFSS questions about disability –
o Are you limited in any way in any activities because of physical, mental, or emotional problems?
o Do you now have any health problem that requires you to use special equipment,
such as a cane, a wheelchair, a special bed, or a special telephone?
• At the end of BRFSS interview, respondent agreed to being called back for a follow-up interview.
In addition, we included only cases that had been interviewed on the BRFSS in English. Once the household was reached, we attempted to identify the BRFSS participant:
o About X months ago, a man/woman in this household, who was [age] years old at the time, participated in a survey for the health department about health and health practices and gave permission to be re-contacted for a follow-up interview. Is that person available?
Once that person was identified, we re-screened using the two BRFSS disability questions, plus one additional question:
A disability can be physical, mental, emotional, or communication-related. Would you describe yourself as having a disability of any kind?
A respondent answering Yes to this question, or to either of the two original BRFSS disability questions, was considered interview-eligible. All other respondents were deemed ineligible and the interviews were terminated.
There were 1,120 BRFSS cases that met the eligibility criteria including agreeing to be recontacted. These cases were submitted for possible interview. The following table is a complete disposition of the sample numbers.
Table A1. Disposition of telephone numbers in sample5
# %
STARTED WITH 1,120
Unable to locate BRFSS respondent
or bad phone number 130
Able to locate 990
Found to be ineligible (language or
did not meet disability criteria) 87
Eligible 903 Completed screener part of
interview 630
Screening rate (completed/eligible) .70 Completed the interview 571
Interview rate (completed interview/completed screener)
.91 Response rate (screening rate x
interview rate) 6
.63
5
This response rate is calculated using American Association for Public Opinion Research (AAPOR) response rate 3. This is the conservative calculation that assumes that all of the non-screened households would have been eligible for interview. If you re-calculate the response rate assuming that the non-screened households were eligible at the same rate as the screened households, the response rate is about 65%. An alternative approach to calculating the response rate is to simply subtract out all the ineligible phone numbers and people (217) and the remainder (903) becomes your response rate denominator of eligible cases. The response rate calculated this way (completed interview, 571) divided by the eligible cases (903) is the same as the conservative calculation in the table, 63%.
6
We were interested in whether response rate varied by BRFSS interview month. More lag time between the original interview and the time of the CSR interview could have effects in two directions: it could make respondents more cooperative, as more time had passed, or it could make them less so, because they had forgotten about their agreeing to a follow-up interview. We were also interested in determining if cooperation varied by month as a result
As noted in the Introduction, it is important to consider who was not included in the survey population when interpreting the results of this analysis. Individuals with the most severe limitations were not included in this study because the BRFSS does not include individuals living in institutions. In addition, the BRFSS methodology precludes anyone from assisting the selected respondent in completing the interview if the selected adult had difficulty participating for any reason.
There are other limitations to the BRFSS sample design and, therefore, the design of the Unmet Needs study which is a subsample of the BRFSS. The BRFSS limitations are described as follows:
… Households that do not have a telephone do not have the opportunity to participate in the survey. Although only two percent of Massachusetts households lack a telephone, almost 10% of households living below poverty lack a phone, based on the 1990 Census. In addition, a substantial percent of households contacted to participate in the BRFSS did not complete the survey. Although households were telephoned on repeated occasions, interviewers were not always able to reach the randomly selected adult in the household and some adults contacted did not agree to participate in the survey. We would be concerned about a bias in the results if the respondents who participated differed significantly from those not included in the survey. The weighting of the data partially takes into account this non-response.
Finally, all data collected by the BRFSS are based on self-report from the respondents. By its nature, self-reported data may be subject to error for several reasons. An individual may have difficulty remembering events that occurred a long time ago or the frequency of certain behaviors. Some respondents may overreport socially acceptable behaviors and underreport behaviors deemed unacceptable. Disability is a complex and somewhat subjective concept and the same people may characterize their condition differently at different times. In addition, different people may characterize the same condition differently.7
One further limitation is that we do not know if the original BRFSS respondents who did not agree to a possible followup interview are different from those who agreed to a followup. In particular, we do not know if they differ in ways that might be associated with the topics covered in the Unmet Needs survey, particularly things related to having a disability. Since we do not have that information, we must interpret the data with caution until a systematic investigation can be done regarding the characteristics of respondents who refused the followup interview request at the end of the BRFSS interview.”
calculation for cooperation (subtracting only ineligible cases from the original sample), we found that there was very little month-to-month variation in response.
7
These limitations are described in Appendix 3 (p.71) of “A Profile of Massachusetts Adults with Disabilities, 1998-2000, Results from the Behavioral Risk Factor Surveillance System,” November 2001 (Accessed Feb. 17, 2008)
Survey Administration
Eighteen interviewers and supervisors were trained to work on the study, though twelve of the interviewers conducted the vast majority of the interviews. The interviews were conducted between September 7 and October 29, 2007. The average interview length was 24 minutes, and it took an average of 4 calls to complete an interview.
Weighting and Analysis
CSR used the BRFSS final weight and added a non-response adjustment to create its own final weight. The BRFSS final weight is calculated by the CDC and is described on the BRFSS website as follows:
BRFSS data are directly weighted for the probability of selection of a telephone number, the number of adults in a household, and the number of telephones in a household. A final poststratification adjustment is made for nonresponse and noncoverage of households without telephones. The weights for each relevant factor are multiplied together to get a final weight.8
CSR calculated a non-response adjustment based on the response rate for each of the 12 strata in the BRFSS samples, as follows:
Response rate by strata = number of interviews / (total number of cases minus ineligibles) The final CSR weight was calculated as follows:
Final CSR weight = final BRFSS weight / stratum response rate
The CSR final weight was appended to each of the 571 cases in the final data set, and the data shown in this report use the final CSR weights. The total weighted number of cases is 2,874. The percentages shown in this report are unaffected by the arbitrary number of weighted cases, but if future data users are interested in making population projections, DPH would need to provide an estimate of the number of people in the state that have the survey’s eligibility
characteristics, and the weights would be multiplied by a constant to weight up to the population estimate.
When running statistical tests using these data, it is important to use the complex sample design feature in the statistical package being used in order to get proper confidence intervals that account for sample design effects.
Write-in Entries
The survey allowed volunteered “other” answers for many questions. For example, the survey offered reasons why a particular need was not being met (such as cost or location), but
respondents were typically asked if there were other reasons and, if so, those reasons were
8
written down by the interviewer. The “other” responses were included in part for exploratory purposes, since we were not certain that we could identify the possible reasons to precode in advance, and also to give respondents a chance to provide an answer if the pre-coded options did not cover their situation. CSR did not code these write-in entries. They are available on a separate text file for future use, with an ID for matching to the quantitative data. While writing this report, the authors reviewed the write-in entries to see if there were any obvious patterns and used that information as appropriate in this report.
Appendix B: Survey Questions
GENERAL HEALTH
1. Overall, how would you rate your health? Would you say it is excellent, very good, good, fair, or poor?
[ ] EXCELLENT [ ] VERY GOOD [ ] GOOD [ ] FAIR [ ] POOR [ ] NA
2. How much of the time during the past month has your health limited your social activities, like visiting with friends or close relatives? Would you say . . .
[ ] None of the time [ ] Some of the time [ ] Most of the time or [ ] All of the time? [ ] DON’T KNOW [ ] REFUSED
RESCREEN FOR DISABILITY STATUS using BRFSS items
3. Are you limited in any way in any activities because of physical, mental, or emotional problems?
[ ] YES [ ] NO
[ ] DON’T KNOW [ ] REFUSED
4. Do you now have any health problem that requires you to use special equipment, such as a cane, a wheelchair, a special bed, or a special telephone?
(Include occasional use or use in certain circumstances.) [ ] YES
[ ] NO
[ ] DON’T KNOW [ ] REFUSED
5. Because of any impairment or health problem, do you have any trouble learning, remembering, or concentrating?
[ ] YES [ ] NO
[ ] DON’T KNOW [ ] REFUSED
Appendix B, p.2
6. A disability can be physical, mental, emotional, or communication-related. Would you describe yourself as having a disability of any kind?
[ ] YES [ ] NO
[ ] DON’T KNOW [ ] REFUSED
Æ IF R ANSWERS YES TO Q6, HE/SHE IS ELIGIBLE TO BE INTERVIEWED. OTHERWISE, END INTERVIEW.
ACTIVITIES OF DAILY LIVING (ADLS)
INTRO. Now I’ll ask about some everyday activities. I’d like to know whether you have any
difficulty doing each one by yourself and without special equipment.
FIRST ADL
7. Because of a health condition or disability, do you have any difficulty bathing or showering by yourself and without special equipment?
[ ] YES Æ skip to 9 [ ] NO Æ skip to 12
[ ] SOMETIMES Æ skip to 9 [ ] DOESN’T DO
[ ] NA Æ skip to 12
8. Is this because of a health or physical problem? [ ] YES
[ ] NO Æ skip to 12 [ ] NA
9. Do you receive help from another person with bathing or showering? [ ] YES
[ ] NO
[ ] SOMETIMES [ ] NA
10. Do you feel like you need help (IF YES/SOMETIMES: more help than you currently receive) with bathing or showering?
[ ] YES [ ] NO
[ ] SOMETIMES [ ] NA
11. Because of your health condition or disability, do you use special equipment to help you bathe or shower? [ ] YES [ ] NO [ ] SOMETIMES [ ] NA SECOND ADL
12. Do you have any difficulty dressing by yourself and without special equipment? [ ] YES Æ skip to 14
[ ] NO Æ skip to 17
[ ] SOMETIMES Æ skip to 14 [ ] DOESN’T DO
[ ] NA Æ skip to 17
13. Is this because of a health or physical problem? [ ] YES
[ ] NO Æ skip to 17 [ ] NA
14. Do you receive help from another person with dressing? [ ] YES
[ ] NO
[ ] SOMETIMES [ ] NA
15. Do you feel like you need help (IF YES/SOMETIMES: more help than you currently receive) with dressing?
[ ] YES [ ] NO
[ ] SOMETIMES [ ] NA
16. Because of your health condition or disability, do you use special equipment to help you get dressed?
[ ] YES [ ] NO
[ ] SOMETIMES [ ] NA
Appendix B, p.4 THIRD ADL
17. Do you have any difficulty eating without help and without special equipment? [ ] YES Æ skip to 19
[ ] NO Æ skip to 22
[ ] SOMETIMES Æ skip to 19 [ ] DOESN’T DO
[ ] NA Æ skip to 22
18. Is this because of a health or physical problem? [ ] YES
[ ] NO Æ skip to 22 [ ] NA
19. Do you receive help from another person with eating? [ ] YES
[ ] NO
[ ] SOMETIMES [ ] NA
20. Do you feel like you need help (IF YES/SOMETIMES: more help than you currently receive) with eating?
[ ] YES [ ] NO
[ ] SOMETIMES [ ] NA
21. Because of your health condition or disability, do you use special equipment to help you eat? [ ] YES [ ] NO [ ] SOMETIMES [ ] NA FOURTH ADL
22. Because of a health condition or disability, do you have any difficulty getting in or out of bed or chairs by yourself and without special equipment?
[ ] YES Æ skip to 24 [ ] NO Æ skip to 27
[ ] SOMETIMES Æ skip to 24 [ ] DOESN’T DO
[ ] NA Æ skip to 27
23. Is this because of a health or physical problem? [ ] YES
[ ] NO Æ skip to 27 [ ] NA
24. Do you receive help from another person getting in or out of bed or chairs? [ ] YES
[ ] NO
[ ] SOMETIMES [ ] NA
25. Do you feel like you need help (IF YES/SOMETIMES: more help than you currently receive) with getting in or out of bed or chairs?
[ ] YES [ ] NO
[ ] SOMETIMES [ ] NA
26. Because of your health condition or disability, do you use special equipment to help you get in or out of bed or chairs?
[ ] YES [ ] NO
[ ] SOMETIMES [ ] NA
FIFTH ADL
27. Do you have any difficulty walking by yourself and without special equipment? [ ] YES Æ skip to 29
[ ] NO Æ skip to 32
[ ] SOMETIMES Æ skip to 29 [ ] DOESN’T DO
[ ] NA Æ skip to 32
28. Is this because of a health or physical problem? [ ] YES
[ ] NO Æ skip to 32 [ ] NA
29. Do you receive help from another person with walking? [ ] YES
[ ] NO
[ ] SOMETIMES [ ] NA
30. Do you feel like you need help (IF YES/SOMETIMES: more help than you currently receive) with walking?
[ ] YES [ ] NO
[ ] SOMETIMES [ ] NA
Appendix B, p.6
31. Because of your health condition or disability, do you use special equipment to help you walk? [ ] YES [ ] NO [ ] SOMETIMES [ ] NA SIXTH ADL
32. Do you have any difficulty using the toilet by yourself and without special equipment? [ ] YES Æ skip to 34
[ ] NO Æ skip to 37
[ ] SOMETIMES Æ skip to 34 [ ] DOESN’T DO
[ ] NA Æ skip to 37
33. Is this because of a health or physical problem? [ ] YES
[ ] NO Æ skip to 37 [ ] NA
34. Do you receive help from another person with using the toilet? [ ] YES
[ ] NO
[ ] SOMETIMES [ ] NA
35. Do you feel like you need help (IF YES/SOMETIMES: more help than you currently receive) with using the toilet?
[ ] YES [ ] NO
[ ] SOMETIMES [ ] NA
36. Because of your health condition or disability, do you use special equipment to help you use the toilet?
[ ] YES [ ] NO
[ ] SOMETIMES [ ] NA
INSTRUMENTAL ACTIVITIES OF DAILY LIVING (IADLS)
INTRO Now I’m going to ask about some other everyday activities and whether you have any difficulty doing them by yourself.
FIRST IADL
37. Because of a health condition or disability, do you have any difficulty doing light housework like washing dishes, straightening up, or light cleaning by yourself?
[ ] YES Æ skip to 39 [ ] NO Æ skip to 41
[ ] SOMETIMES Æ skip to 39 [ ] DOESN’T DO
[ ] NA Æ skip to 41
38. Is this because of a health or physical problem? [ ] YES
[ ] NO Æ skip to 41 [ ] NA
39. Do you receive help from another person with doing light housework? [ ] YES
[ ] NO
[ ] SOMETIMES [ ] NA
40. Do you feel like you need help (IF YES/SOMETIMES: more help than you currently receive) with doing light housework?
[ ] YES [ ] NO
[ ] SOMETIMES [ ] NA
SECOND IADL
41. Because of a health condition or disability, do you have any difficulty doing heavy housework like scrubbing floors or washing windows by yourself?
[ ] YES Æ skip to 43 [ ] NO Æ skip to 45
[ ] SOMETIMES Æ skip to 43 [ ] DOESN’T DO
[ ] NA Æ skip to 45
42. Is this because of a health or physical problem? [ ] YES
[ ] NO Æ skip to 45 [ ] NA
Appendix B, p.8
43. Do you receive help from another person with doing heavy housework? [ ] YES
[ ] NO
[ ] SOMETIMES [ ] NA
44. Do you feel like you need help (IF YES/SOMETIMES: more help than you currently receive) with doing heavy housework?
[ ] YES [ ] NO
[ ] SOMETIMES [ ] NA
THIRD IADL
45. Because of a health condition or disability, do you have any difficulty preparing your own meals by yourself?
[ ] YES Æ skip to 47 [ ] NO Æ skip to 49
[ ] SOMETIMES Æ skip to 47 [ ] DOESN’T DO
[ ] NA Æ skip to 49
46. Is this because of a health or physical problem? [ ] YES
[ ] NO Æ skip to 49 [ ] NA
47. Do you receive help from another person with preparing your own meals? [ ] YES
[ ] NO
[ ] SOMETIMES [ ] NA
48. Do you feel like you need help (IF YES/SOMETIMES: more help than you currently receive) with preparing your own meals?
[ ] YES [ ] NO
[ ] SOMETIMES [ ] NA
FOURTH IADL
49. Because of a health condition or disability, do you have any difficulty shopping for things you need, like groceries or medicines, by yourself?
[ ] YES Æ skip to 51 [ ] NO Æ skip to 53
[ ] SOMETIMES Æ skip to 51 [ ] DOESN’T DO