PRI Discussion Paper Series (No.03A−28)
The views expressed in this paper are those of the authors and not those of the Ministry of Finance or the Policy Research Institute.
財務省財務総合政策研究所研究部
〒100−8940 千代田区霞が関3−1−1
TEL 03−3581−4111 (内線5222)
JAPAN’S BANKING SYSTEM: FROM THE BUBBLE AND CRISIS TO RECONSTRUCTION
Masahiro Kawai
Institute of Social Science University of Tokyo, Japan
JAPAN’S BANKING SYSTEM:
FROM THE BUBBLE AND CRISIS TO
RECONSTRUCTION
By
Masahiro Kawai Institute of Social Science University of Tokyo, Japan
December 25, 2003
This paper is prepared for presentation to the session, “Whither the Japanese Economy?” organized at the American Economic Association meetings to be held in San Diego, January 3-5, 2004. It is also a revised version of the paper presented to the PRI-KIEP Joint Conference on “Regional Financial Cooperation,” organized by the Policy Research Institute of Japan’s Ministry of Finance and the Korea Institute for International
Economic Policy, and held on September 19, 2003, Seoul. The author is thankful to Akiyoshi Horiuchi, Takatoshi Ito, and other participants at the conference for their comments and suggestions and to Steven Green for his editorial assistance.
I. INTRODUCTION
The Japanese banking sector is now going through major restructuring, reorganization, and consolidation on a scale unprecedented in its history, all against a background of an increasingly market-oriented, more deregulated and globalized policy environment. This process was set in motion and greatly precipitated by recent economic difficulties, i.e., the asset disinflation and economic stagnation that started in the early 1990s and led to the systemic banking crisis in 1997-98.
The focus of this paper is the state of the Japanese banking system that was exposed to an asset price bubble (in the late 1980s), its collapse (in the early 1990s) and subsequent systemic crisis (in the late 1990s), and is undergoing recent reconstruction. These events raise several questions:
What are the factors behind the recent banking sector difficulty, particularly the 1997-98 systemic crisis, in Japan?
· · · · · ·
Why did the government fail to address the problem quickly and decisively enough?
Has the financial authority adopted a comprehensive policy to resolve banking sector problems since 1998?
Has there been sufficient progress on financial sector and corporate sector restructuring?
Is the worst over in the Japanese banking system? Is the sector solvent now? What are risks?
What should be done to transform the Japanese banking system into a competitive, market-based system?
The paper is organized as follows. Section II reviews the macroeconomic develpments and banking sector conditions since the 1980s. Section III explores the causes of the banking sector crisis including factors that led to its systemic crisis in the latter half of the 1990s. Section IV examines the impact of banking sector distress on the regulatory framework, the scale of bank business activity and macroeconomic policies. Section V evaluates the authority’s policy framework for bank restructuring and reform and the progress that has been made. It also discusses the strategic response of Japanese banks to the distress and the new market environment. Section VI summarizes the paper.
II. MACROECONOMIC DEVELOPMENTS AND THE BANKING SECTOR 1. Macroeconomic Performance and Policy
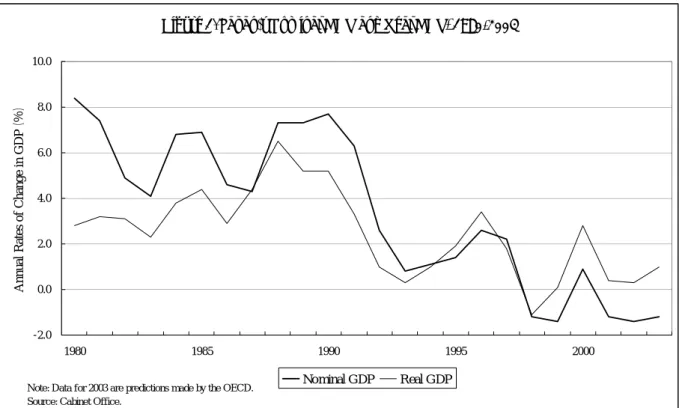
The Japanese economy grew at 3.8 percent in the 1980s with low inflation, but slipped into a long period of stagnation in the 1990s. For example, the average annual growth rate of real GDP was 1.1 percent during the last decade, 1992-2002. More recently, the economy experienced near-zero growth—at 0.1 percent in 1998-2002 (Figure 1). In addition, nominal GDP has been contracting at an average 1.2 percent during 1998-02 because of price deflation.
The rate of inflation in the 1980s was low—2.5 percent for the CPI and 2.3 percent for the GDP deflator—and it was even lower in the 1990s—0.2 percent for the CPI and -0.1 percent for the GDP deflator in 1992-2002 (Figure 2). More recently, the price level started to fall faster, recording an average 0.7 percent decline in the CPI per year during 1999-2002 and an average 1.0 percent decline in the GDP deflator during 1995-2002. The pace of GDP deflator decline has been faster than that of CPI decline, because the price of investment goods, which is an important component of the GDP deflator but not of the CPI, has been falling at a rapid pace in recent years.
In addition, the rate of unemployment has been rising steadily since the beginning of the 1990s, reaching a peak of 5.5 percent recently. Though this peak unemployment rate is low relative to many OECD counterparts, it is a historical high for Japan.
Monetary policy stance has been alternating since the mid 1980s. With an appreciating yen exchange rate, the Bank of Japan had adopted a loose monetary policy until the spring of 1989 when it shifted to a tight monetary policy. Due to the overheating of the economy and asset price inflation, the official discount rate was raised five times from 2.5 percent in 1987-88 to 6.0 percent in 1991. This monetary tightening was partly responsible for the collapse of the bubble in 1990-91. With the onset of asset price deflation, the Bank of Japan switched to easy money, which has been maintained until now (the end of 2003).
Fiscal policy has also been expansionary during the post-bubble period. For example, fiscal spending rose from an average size of 32 percent of GDP in 1991 to 39 percent in the early 2000s, with declining fiscal revenues—from 34 percent of GDP in 1991 to 31 percent of GDP recently. Every year, supplementary budgets were put in place to stimulate the economy. As a result the budget deficit has expanded and government debt has risen rapidly.
2. Asset Prices
There was an asset price bubble in the late 1980s. The pace of increase in asset prices—stock prices and land prices—was much faster than that of nominal GDP (Figure 3). The figure shows that, choosing 1980 as a reference year (1980=100), the land prices continued to rise throughout the 1980s, reaching a peak level in September 1991 which was more than three times higher than the 1980 level and more than twice the level of 1991 nominal GDP. The stock prices also rose fast in the second half of the 1980s, reaching a peak in December 1989 that was close to five times higher than the 1980 level and thrice and a half the level of nominal GDP. The extent of asset price bubbles was indeed excessive in the 1980s in comparison to the movement of nominal GDP.
After peaking at the end of 1989, the stock prices began to collapse in the following two years, losing more than half of their value by early 1992. While showing some recovery during 1993-96, the stock prices again plunged in 1997-98. After peaking in 1991, land prices also started to decline soon thereafter, losing close to 20 percent of
their value by 1992 and 60 percent by 1997.1 While the stock prices indicated some cyclical movements, both stock and land prices have been declining as a trend throughout the 1990s and into the early 2000s. One can observe that excessiveness of high asset prices has largely been eliminated relative to nominal GDP in the course of asset price deflation—by 1996 for the land price and by 2002 for the stock price.
3. Banking Sector Conditions
The Japanese banks’ stellar performance in the second half of the 1980s
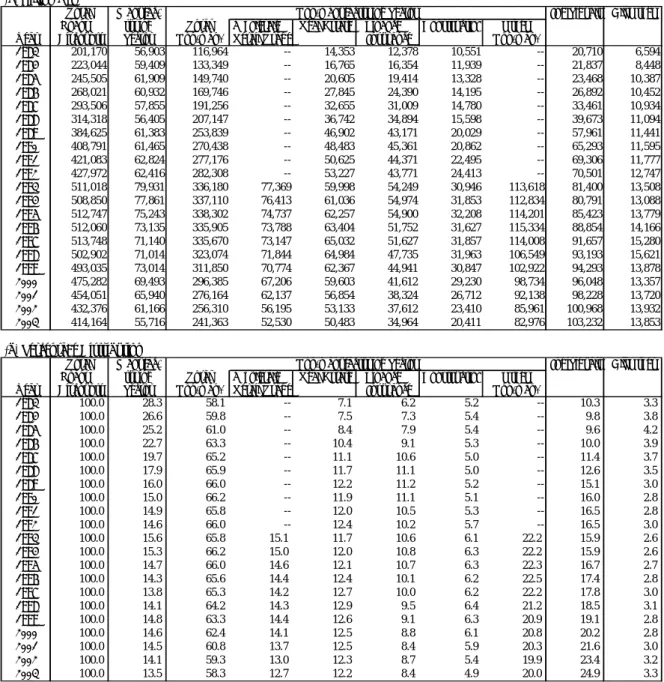
underwent a dramatic turnaround in the 1990s. During the second half of the 1980s, bank loans expanded against the expectation of robust growth, a stable price level, and an expansionary monetary policy. High loan growth was accompanied by high growth of deposits (Figure 4). Bank loans were concentrated in wholesale and retail trade, real estate, finance and insurance, and construction (Table 1), with real estate as collateral. Corporate borrowers in these sectors became highly indebted and exposed to risks of declines in the collateral value. The phenomenal expansion of bank loans created an asset price bubble, setting the stage for a subsequent banking crisis.
The bursting of the bubble in the early 1990s prevented highly indebted firms from being able to repay their debt due to the decline in collateral value, thus creating non-performing loans (NPLs). Commercial banks’ capital base began to erode as their real estate and stock holdings lost a substantial part of their values, prompting banks to call in loans to remain in conformity with the Basil capital adequacy guideline.2 Banks’ credit squeeze was rather gradual with the rate of loan growth slowing over the first half of the 1990s,3 turning negative thereafter.
In the mid-1990s, numerous non-banks—including housing loan companies (Jusen)—, credit cooperatives and regional banks became insolvent and were liquidated (see Appendix Table 1 for a detailed chronology of events related to the banking sector). Banking system distress became increasingly apparent during the course of 1997.4 After some restructuring efforts, Hokkaido Takushoku Bank, a major city bank, became unable to raise funds in the interbank market and had to announce its discontinuation of business operations in November, requesting a transfer its healthy assets and liabilities in
Hokkaido to Hokuyo Bank. Two large securities companies, Yamaichi and Sanyo, went bankrupt and two major banks, Nippon Credit Bank and the Long-Term Credit Bank of Japan, began to have management difficulties.
With several financial institutions experiencing difficulties or going bankrupt simultaneously, banks’ share prices tumbled on the stock market in a full-blown systemic
1
Measured by urban land price indexes in the six large city areas. 2
The Bank for International Settlements (BIS) announced in 1989, and implemented in 1992, the guideline on risk-weighted capital adequacy, which prompted the retrenchment of banks’ lending operations globally.
3
Commercial banks maintained, and even increased in some cases, their exposure to certain sectors, such as real estate and construction until the second half or the middle of the 1990s.
4
See Nakaso (2001) for detailed accounts of the banking sector crisis and distress in the 1990s, particularly as viewed from the Bank of Japan’s perspectives.
(a) Billion Yen
Total Manufac- Individuals All Other
Loans & turing Total Wholesale & Real Estate Finance & Construction Other Year Discounts Sector Non-man. Retail Trade Insurance Non-man.
1983 201,170 56,903 116,964 -- 14,353 12,378 10,551 -- 20,710 6,594 1984 223,044 59,409 133,349 -- 16,765 16,354 11,939 -- 21,837 8,448 1985 245,505 61,909 149,740 -- 20,605 19,414 13,328 -- 23,468 10,387 1986 268,021 60,932 169,746 -- 27,845 24,390 14,195 -- 26,892 10,452 1987 293,506 57,855 191,256 -- 32,655 31,009 14,780 -- 33,461 10,934 1988 314,318 56,405 207,147 -- 36,742 34,894 15,598 -- 39,673 11,094 1989 384,625 61,383 253,839 -- 46,902 43,171 20,029 -- 57,961 11,441 1990 408,791 61,465 270,438 -- 48,483 45,361 20,862 -- 65,293 11,595 1991 421,083 62,824 277,176 -- 50,625 44,371 22,495 -- 69,306 11,777 1992 427,972 62,416 282,308 -- 53,227 43,771 24,413 -- 70,501 12,747 1993 511,018 79,931 336,180 77,369 59,998 54,249 30,946 113,618 81,400 13,508 1994 508,850 77,861 337,110 76,413 61,036 54,974 31,853 112,834 80,791 13,088 1995 512,747 75,243 338,302 74,737 62,257 54,900 32,208 114,201 85,423 13,779 1996 512,060 73,135 335,905 73,788 63,404 51,752 31,627 115,334 88,854 14,166 1997 513,748 71,140 335,670 73,147 65,032 51,627 31,857 114,008 91,657 15,280 1998 502,902 71,014 323,074 71,844 64,984 47,735 31,963 106,549 93,193 15,621 1999 493,035 73,014 311,850 70,774 62,367 44,941 30,847 102,922 94,293 13,878 2000 475,282 69,493 296,385 67,206 59,603 41,612 29,230 98,734 96,048 13,357 2001 454,051 65,940 276,164 62,137 56,854 38,324 26,712 92,138 98,228 13,720 2002 432,376 61,166 256,310 56,195 53,133 37,612 23,410 85,961 100,968 13,932 2003 414,164 55,716 241,363 52,530 50,483 34,964 20,411 82,976 103,232 13,853 (b) Percentage Distribution
Total Manufac- Individuals All Other
Loans & turing Total Wholesale & Real Estate Finance & Construction Other Year Discounts Sector Non-man. Retail Trade Insurance Non-man.
1983 100.0 28.3 58.1 -- 7.1 6.2 5.2 -- 10.3 3.3 1984 100.0 26.6 59.8 -- 7.5 7.3 5.4 -- 9.8 3.8 1985 100.0 25.2 61.0 -- 8.4 7.9 5.4 -- 9.6 4.2 1986 100.0 22.7 63.3 -- 10.4 9.1 5.3 -- 10.0 3.9 1987 100.0 19.7 65.2 -- 11.1 10.6 5.0 -- 11.4 3.7 1988 100.0 17.9 65.9 -- 11.7 11.1 5.0 -- 12.6 3.5 1989 100.0 16.0 66.0 -- 12.2 11.2 5.2 -- 15.1 3.0 1990 100.0 15.0 66.2 -- 11.9 11.1 5.1 -- 16.0 2.8 1991 100.0 14.9 65.8 -- 12.0 10.5 5.3 -- 16.5 2.8 1992 100.0 14.6 66.0 -- 12.4 10.2 5.7 -- 16.5 3.0 1993 100.0 15.6 65.8 15.1 11.7 10.6 6.1 22.2 15.9 2.6 1994 100.0 15.3 66.2 15.0 12.0 10.8 6.3 22.2 15.9 2.6 1995 100.0 14.7 66.0 14.6 12.1 10.7 6.3 22.3 16.7 2.7 1996 100.0 14.3 65.6 14.4 12.4 10.1 6.2 22.5 17.4 2.8 1997 100.0 13.8 65.3 14.2 12.7 10.0 6.2 22.2 17.8 3.0 1998 100.0 14.1 64.2 14.3 12.9 9.5 6.4 21.2 18.5 3.1 1999 100.0 14.8 63.3 14.4 12.6 9.1 6.3 20.9 19.1 2.8 2000 100.0 14.6 62.4 14.1 12.5 8.8 6.1 20.8 20.2 2.8 2001 100.0 14.5 60.8 13.7 12.5 8.4 5.9 20.3 21.6 3.0 2002 100.0 14.1 59.3 13.0 12.3 8.7 5.4 19.9 23.4 3.2 2003 100.0 13.5 58.3 12.7 12.2 8.4 4.9 20.0 24.9 3.3
Source: Bank of Japan, Financial and Economic Statistics Monthly.
Non-manufacturing Sector
Non-manufacturing Sector
Table 1. Loans and Discounts Outstanding by Sector―All Domestically Licensed Banks
crisis. This crisis was systemic in that it was not limited to just a few banks. Several commercial banks were cut off from their access to the interbank market, a few smaller banks were subjected to depositor runs, and the Japanese banking system as a whole faced an unusually high “Japan premium” from late 1997 to most of 1998.5 In late 1998,
5
The capacity of banks to raise foreign currency funds, particularly in US dollars, diminished due to a decline in their creditworthiness¾U.S. and European banks reduced credit limits applied to Japanese banks. Japanese banks were forced to raise funds at a large premium (“Japan premium”) from U.S. and European counterparts in the interbank markets. From late 1997 into late 1998, the “Japan premium” rose
Long-Term Credit and Nippon Credit Banks were placed under temporary nationalization. The government in a departure from its traditional “convoy” approach did not bail out banks.
III. THE CAUSES OF THE BANKING SECTOR CRISIS AND DIFFICULTIES
There are basically three causes for the banking sector crisis and difficulties in the 1990s:
· · ·
Overextension of commercial bank loans during the bubble period in risky areas; Severe negative impact of the bursting of the bubble and the subsequent asset price deflation, which was greater than had been thought, transforming bank loans into non-performing; and
Delay in policy action to decisively contain the banking sector problem early and quickly enough.
1. Overextension of Bank Loans during the Bubble Period
Several factors led to the overextension of bank loans in the second half of the 1980s.
First, financial liberalization in the 1980s allowed small financial institutions to venture into new areas, particularly funding housing finance companies (Jusen) and other real estate investments.6 This development, along with other deregulation, e.g. lifting of interest rate controls and of restrictions on non-bank lending, intensified competition among financial institutions and depressed interest rate spreads. In response, banks expanded into riskier lending, such as consumer loans, real estate loans, and SME lending, where the regulatory and supervisory framework proved to be inadequate.
Second, the deregulation of capital markets allowed large firms to increasingly shift away from banks to domestic and euro bond markets for funding. This shift induced major banks to increasingly channel their loans towards those firms which had limited access to domestic and international capital markets. As a result, the composition of bank clients changed from manufacturing to non-manufacturing firms. Banks extended too much loans to firms in the real estate, construction, distribution, and finance sectors, which had been insulated from market competition, unlike those in the manufacturing sector, and hence had been less efficient, less productive and riskier.
Third, at the time of the asset price bubble, banks and borrower firms had unwarranted expectations of high economic growth, which allowed further extension of
significantly, coinciding with the severe problems in the Japanese financial market, peaking at 100 basis points in early December 1997 in the aftermath of the failures of Hokkaido Takushoku Bank and Yamaichi Securities. On the other hand, the banking crisis was not accmpanied by a massive flight of deposits out of the banking system as a whole.
6
Housing loan companies (Jusen) were established by banks and financial institutions to make residential mortgages. Initially they lent to home owners but their business turned towards financiang property development. These housing loan companies suffered from non-performing loanproblems in the first half of the 1990s due to the collapse of property prices.
collateral-based loans under the general conditions of low interest rates and inadequate prudential and supervisory frameworks over banks. Prudential supervision was
inadequate—leading to inadequate public disclosure of financial data, insufficient loan loss provisioning, and undercapitalization—and commercial banks had not developed a credit culture to assess and price credit risks for sound risk management. Collateral-based lending weakened banks’ incentives to monitor borrower firms closely.
The late 1980s saw an expansion not only of bank loans but also of capital investment and labor employment. The bubble burst once the authorities sharply tightened their monetary policy by raising the interest rate and they introduced credit ceilings on real estate-related bank loans in 1990-91.7 The bursting of the bubble in the early 1990s transformed the overextended loans into non-performing loans (NPLs), and a large build-up of capital investment and employment into capacity overhang and
employment overhang, respectively.
2. Severe Negative Impact of Asset Price Deflation
Both the stock and land prices collapsed severely in the 1990s as a trend, which exerted a severer negative impact on the economy and the banking sector than had been thought. Land price deflation in particular has eroded the collateral value of bank loans throughout the 1990s.
The bursting of the bubble created substantial losses for firms that held equities on the one hand and debt to banks on the other with real estate collateral because of sharp declines in the asset prices. As a result these highly indebted firms were unable to repay their loans, creating NPL problems for commercial banks. In response commercial banks became increasingly reluctant to extend loans to corporate borrowers and even began withdrawing loans from their corporate borrowers. Banks did not initiate aggressive resolution of their NPLs at an early stage because they valued highly the maintenance of good bank-firm relationships.
With the collapse of investment and domestic demand, economic stagnation began in 1992. As highly indebted firms had not initiated restructuring efforts until the second half of the 1990s, they faced a triple overhang problem: debt overhang, capital overhang and employment overhang. As a result, labor productivity growth began to slowdown particularly due to the slowdown of total factor productivity (TFP) growth. With increasing numbers of bankruptcies among firms and financial institutions in the mid to the late 1990s, consumers began to lose confidence in the future because of the perceived collapse of life-time employment and of the expectation of ever higher income. The economy appeared to have been trapped in a “bad” equilibrium situation. Despite the Bank of Japan’s easy monetary policy, price deflation started in the mid-1990s, which gave a blow to the “growing-out” approach and aggravated banking sector difficulties.
Commercial banks began to dispose of NPLs in the early 1990s, initially at a gradual pace and later at a faster pace. With asset price deflation and weak economic
7
The causes and consequences of the asset disinflation in the 1990s are well documented. See for instance Hoshi and Kashyap (1999) and Kanaya and Woo (2000).
activity, new NPLs continued to emerge. When price deflation began to embed itself in the economy in the second half of the 1990s, it became even harder to stop the emergence of new bank NPLs despite the banks’ efforts to dispose of existing NPLs.
3. Policy Delay in Containing the Problem Early, Quickly and Decisively
The financial authorities did not address the banking sector problem early and quickly enough and, thus, failed to adopt a comprehensive approach to resolve the banking sector problem until after the systemic crisis of 1997-98. In the absence of adequate safety nets and legal frameworks for dealing with insolvent institutions, there was hesitation in taking decisive measures for fear that it might touch off a banking sector panic (Kanaya and Woo, 2000). Although the authorities introduced a broader range of measures to address aspects of banks’ problems more forcefully in 1996-97, the approach was not comprehensive. There are several reasons for the delay in decisive policy action:
· · ·
The initial approach was based on the expectation that a resumption of economic growth would restore financial health of banks and their clients.
Keynesian fiscal policy sustained minimum economic growth and helped insolvent corporations survive, particularly in the construction sector.
There was no domestic pressure—due to high per capita income, high savings, no inflation, relatively low unemployment, and no social unrest—or external
constraint—due to large foreign exchange reserves, large net external asset positions, no capital flight, no balance of payments difficulties, and no currency crisis—that otherwise would have prompted the government to accelerate the resolution of banking sector problems.8
The government did not appear to feel a sense of urgency or need for decisive action until it faced a systemic crisis in 1997-98. As a result, the financial authorities avoided objective recognition of the magnitude of NPLs and the state of commercial banks’ balance sheet more generally. If decisive action had been taken and a
comprehensive strategy put in place by the mid-1990s, the 1997-98 crisis might have been avoided, or at least its impact could have been mitigated.
IV. IMPACT OF BANKING SECTOR DISTRESS 1. Collapse of the Traditional “Convoy System”
Under the government’s protective policy, the banking sector had for a long time enjoyed exclusive access to the captive domestic financial markets characterized by abundant savings and investment activities of a large economy. The traditional banking-sector policy, called the “convoy system,” attempted to maintain a stable
financial system capable of contributing to large-scale financial intermediation. The most important safety net in this framework was implicit blanket protection of deposits through public confidence in the ability of the Ministry of Finance (MOF) and the Bank of Japan 8
One of the distinctive features of Japan’s banking crisis was the absence of a currency crisis. The twin crises—banking and currency crises—were an important feature of the East Asian financial crisis that affected Thailand, Indonesia, Malaysia and Korea.
(BOJ) to avoid major financial instability. In the event of a bank failure, the official approach was largely ad hoc. Using its branch licensing authority, the MOF encouraged stronger, healthier banks to absorb insolvent institutions—called the “hogacho” rescue operation—through informal, administratively orchestrated, bank purchase and
assumption (P&A) transactions. For this purpose the MOF allowed some regulatory forbearance, and the BOJ often provided liquidity assistance to prevent banking crises. This informal system functioned well in a growing economy with a stable
political-bureaucratic environment.
In the 1990s, however, it became increasingly difficult to pursue the “hogacho” style resolution—to persuade healthier banks to participate in bail-out operations for other troubled banks—because even relatively strong banks were experiencing a
substantial deterioration in their balance sheets. Major shareholders and firms associated with Hokkaido Takushoku Bank, Yamaichi Securities and Sanyo Securities and other relatively strong banks refused to provide assistance. Temporary nationalization of Long-Term Credit Bank in October 1998 signified the end of the informal “convoy” system. Essentially, such a system became obsolete to cope with the market pressure that led to the 1997-98 systemic crisis.
One major factor behind the market pressure is financial deregulation that had been underway since the 1980s, including interest rate liberalization, expansion of business scope for banks, non-banks’ entry into the lending business, opening of the domestic markets to foreign financial institutions, and integration of the domestic with global financial markets. For example, in late 1996, the government announced the “Financial Big Bang” reform, a blueprint to phase in free and open competition in a globalizing environment.9 Key aspects of these measures began to be introduced in late 1997. The sale of temporarily nationalized Long-Term Credit Bank to foreign stakes, led by Ripplewood Holdings, indicated the government’s determination to open up a major banking institution to foreign interest.
The end of the informal “convoy” system means that the financial authority must establish a clearly defined regulatory and supervisory framework that is based on market principles to regulate and supervise banks and to resolve ailing banks. This is necessary because the financial markets have become more competitive, integrated and global. A sequence of actions taken by the authority since 1998, including closure or temporary nationalization of nonviable banks, public recapitalization, use of prompt corrective
9
The so-called “Financial Big Bang,” adopted in 1996 was considered “a bigger bang” than the original big bang in London in 1986. The latter basically involved deregulation of fees for stock transactions and opening up of the London Stock Exchange to foreigners while the Japanese “Financial Big Bang” brought down barriers between banking, securities, and insurance industries as well as liberalization of foreign exchange transactions. That is, barriers to non-bank and non-financial institutions as well as barriers to foreign participation were dismantled, potentially leading to greater competition and a more rapid reorganization of the financial industry than was experienced in the London big bang. Foreign banks were thought to take advantage of opportunities in the world’s second largest economy and abundant financial resources and that the big bang would set the stage for their active participation in the Tokyo markets. The number of foreign banks in Japan steadily rose in the 1990s although the number declined slightly in the aftermath of its financial crisis. The expansion of their presence is most pronounced in the areas of corporate pension, asset management, derivatives and other high-skill services.
action, stricter loan classification, greater loan loss provisioning, a move to a limited deposit insurance system, etc. is in line with this direction.
2. Downsizing of Bank Business
Under the traditional, regulated regime, maximizing deposit collection and loan extension through branch growth constituted the principal form of competition between banks. Hence, their business objective was to achieve quantitative targets such as
expansion of market shares and the volume of transactoins. With the weakened financial and capital positions, however, comercial banks have been downsizing business
operations, both domestic and international, as part of their defensive strategy. The size of bank assets and the numbers of branches and employees have been reduced since the 1990s.
When downsizing business operations, they have been forced to focus more on their core competency. Banks have tried to maintain their stakes in retail and wholesale markets for both individuals and corporations, which forms their core business, yielding large portions of their operational profits. By customizing services and further
strengthening client relations, banks have sought to position themselves in a more competitive and shrinking domestic market. Their near-term strategic objectives have been survival and improvement of ROEs.
Several major banks have ceased foreign operations altogether. Other major banks that remain internationally active have also been cutting back on their presence overseas, shifting the operational focus towards core banking businesses with Japanese firms and their affiliates. The overall number of bank branches and human resources overseas began to decline in 1996 and the decline has been most dramatic in North America, followed by Europe. The reduction of the number of branches and staff in Asia has been relatively modest in comparison to other regions. In the midst of overall
retrenchment, Asia is still considered the last best hope for Japanese banks, despite their relatively reduced presence in the region.10
3. Impacts on Monetary and Fiscal Policy
The banking sector difficulty has had serious implications for monetary policy and fiscal conditions.
Since after the collapse of the asset price bubble in the early 1990s, a broad class of money supply, like M2+CD, has not been growing fast despite the BOJ’s seemingly easy monetary policy. The BOJ reduced the discount rate nine times between 1991 and 1995 and eventually adopted a zero interest rate policy (February 1999). Under the zero interest rate policy, the BOJ moved to “quantitative easing” (March 2001) to inject a monetary base into the banking system. Despite the traditional and non-traditional easy monetary policy, M2+CD has not been growing fast, reflecting the persistent contraction of commercial bank lending (see Figure 5). Commercial banks saddled with large NPLs
10
have become risk-averse and have stopped expanding new loans—or even have
withdrawn loans from corporate borrowers. Instead, they have increased the holdings of long-term government bonds (JGBs) as “safe assets.” On the other hand, indebted firms have had no appetite to borrow, particularly in a stagnant economic environment, and instead have been repaying their bank loans to reduce debt.
Essentially, commercial banks have not performed financial intermediation functions. This suggests that, unless the banking sector eliminates the balance sheet problem and restores its financial health, it cannot reestablish a normal financial
intermediary function. Resolution of banking sector problems is a condition for the better functioning of monetary policy transmission mechanisms and, hence, the greater
effectiveness of monetary policy.
The banking sector problem is a reflection of weakness of the corporate sector on the one hand, and can be a source of further economic stagnation and goods price
deflation on the other. The causality goes both ways. The problem is that in an
environment of economic stagnation and price deflation, it is difficult to reduce fiscal spending and contain budget deficits. In fact, since the early 1990s, the government expenditure has been rising because of the need for aggregate demand support, and the government revenue has been declining partly because of the automatic stabilizer function. As a result, large budget deficits have been maintained throughout the 1990s and the public sector debt/GDP ratio has steadily risen, to a level of 150 percent in 2002 (see Figure 6).
So far accumulation of government debt has been tolerated because of the low interest rate on the JGB.11 As the concern about fiscal sustainability mounts, however, upward pressure on the long-term interest rate is unavoidable, which in turn would impose large fiscal burden and further aggravate the debt situation. To stop this, nominal GDP must grow at a rate much higher than the long-term interest rate and/or a large primary surplus must be created over a substantial period of time. An eventual increase in the interest rate can expose commercial banks to another type of risk, by creating capital losses on the part of banks holding JGBs unless offset by equity price increases.
V. POLICY FRAMEWORKS FOR BANKING SECTOR RESTRUCTURING AND PROGRESS
Next I consider the government’s efforts to resolve, and recover from, the banking sector crisis and to reconstruct an efficient banking system through establishing an effective regulatory and supervisory framework.12 The government’s approach to dealing with the bank distress problem was in transition during 1996-98. The previous policy had been based on protection and regulatory forbearance intended to support ailing banks,
11
However, the downgrading of the sovereign rating of the JGB by international rating agencies is expected to heighten investor nervousness and concern about fiscal sustainability. Rising debt will eventually exert upward pressure on the long-term interest rate, whose signs have already been observed in August and September 2003.
12
For guidance on this issue, see IMF (2003), which is a summary of lessons to be learnt from banking crises in many countries.
while allowing time for a recovery of economic growth and asset prices. However, weak economic performance and falling asset prices eventually intensified market pressure, leading to the 1997-98 crisis, which induced fundamental policy changes.
1. Stabilization of the Banking System
The banking sector was in systemic crisis from late 1997 to 1998. The sector, however, has been stabilized through more decisive actions than those in the earlier years.
Previously, deposits had been protected fully on an informal basis—despite the presence of explicit, limited deposit protection—, emergency liquidity assistance had been extended to troubled banks, and financial resources had been provided to encourage healthy institutions to merge troubled institutions. But the government had lost its willingness to use public funds to resolve banks’ balance sheet problem since the 1995-96 Jusen episode when it reluctantly agreed to inject 680 billion yen to bail out specialized housing loan companies. This move was the first time when public funds were used directly to deal with financial instability in Japan, which was extremely unpopular politically then and the authorities were not prepared to repeat it. Nonetheless, they made efforts to contain the emerging difficulties in the banking sector. For example, in June 1996, the deposit insurance system was strengthened through a major amendment of the Deposit Insurance Law including: temporary suspension of limited deposit protection until March 200113; and an increase in the insurance premium from 0.012 percent to 0.084 percent. At the same time, prompt corrective action was legislated as a rule-based framework mandating corrective actions when the capital adequacy ratios deteriorated.14 These efforts were still intended to address problems for credit cooperatives rather than major banks. Injection of public funds into major banks was considered beyond the capacity of the Deposit Insurance Corporation (DIC).
The full-blown systemic crisis in 1997-98, however, prompted the authorities to take more decisive actions to stabilize the system: announcement in December 1997 that up to 30 trillion yen of public money would be made available to the DIC by March 1998—comprised of 13 trillion yen to bolster bank balance sheets and 17 trillion yen to strengthen the DIC system; creation of the Financial Supervisory Agency and the Financial Reconstruction Commission (FRC)15; injection of public funds of 1.8 trillion yen in March 1998 and 7.5 trillion yen in March 1999 to help major banks meet the required capital adequacy; temporary nationalization of two major banks, Long-Term
13
This follows the MOF’s announcement in June 1995 that the Deposit Insurance Corporation would protect all deposits of troubled banks at least for five years.
14
If a commercial bank’s capital ratio falls short of certain standards, the authorities shall request the bank to submit a management improvement plan to take specific action to remedy its situation. The bank will be required to classify its loans into five risk categories, subject to external audits. The prompt corrective action scheme was legislated in 1996 and was first invoked in May 1999.
15
The Financial Supervisory Agency was created in June 1998, taking over the functions of supervision and inspection of the financial system from the MOF. The MOF retained the function of policy planning and created a new Financial System Planning Bureau by consolidating policy planning functions of the Banking and Securities Bureaus. In December 1998, the Financial Reconstruction Commission (FRC) was established as a parent body of the Financial Supervisory Agency, taking over oversight of the financial industry.
Credit and Nippon Credit Banks, in October and December 1998, respectively; augmentation of public funds to a total of 60 trillion yen—more than 12 percent of GDP—for financial support for banks in October 199816; and use of the prompt corrective action clauses, starting in May 1999.
After public recapitalization, commercial banks began to adjust under the guidance of the newly created FRC and the Financial Supervisoy Agency. The restructuring of the banks took the form of closure of branches, private capitalization, stricter loan classifications, greater provisioning and write-offs, and a cutback on
cross-border operations. As a result of the measures taken, banks’ capital adequacy ratios improved and NPLs began to be seriously addressed. Banking sector stablity was largely restored. The “Japan premium” substantially narrowed in April 1999 when the market reacted favorably to the BOJ’s downward guidance of the overnight inter-bank market rate to virtually zero percent.
2. Banking Sector Restructuring: Capitalization and NPL Disposal
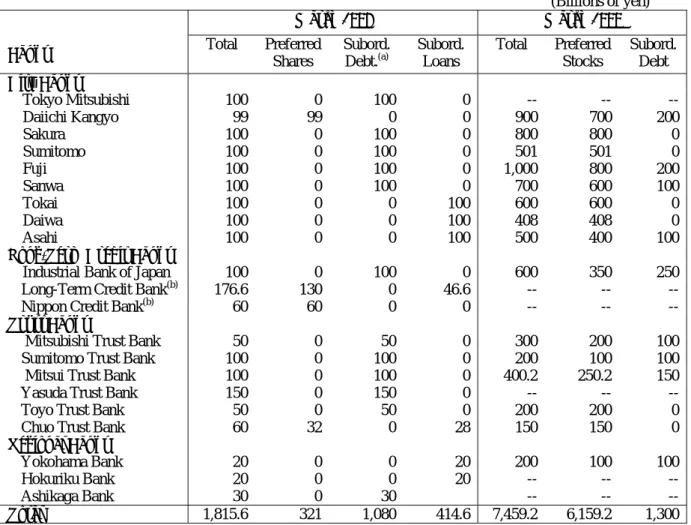
Public recapitalization. In March 1998, the government injected public resources to recapitalize 21 commercial banks, including all city banks, for a total amount of 1.82 trillion yen, and in March 1999, an additional 7.5 trillion yen into 15 major banks, of which all city banks with the exception of the Bank of Tokyo Mitsubishi received 5.4 trillion yen (Table 2). Some increased capital by issuing preferred stocks and some subordinated debentures. Many banks were also encouraged to raise capital privately from markets. Consequently, despite the negative impact on bank capital of sizable loan write-offs and loan loss provisions, the risk-based capital ratios of Japanese banks were raised by 1 to 2 percentage points by 1999.
All city banks that received public funds for recapitalization were mandated by the Financial Function Early Strengthening Law to submit in March 1999 a restructuring plan for sound management, “Keiei no kenzenka no tameno keikaku.”17 As a result, the official guidance by the Financial Supervisory Agency (later the Financial Services Agency) began to drive the banks’ behavior and strategy. Main elements of commercial banks’ restructuring plans are:
· · ·
Organizational restructuring, including mergers, subsidiaries, alliances with partners both in and outside the banking industry;
Operational restructuring to improve ROEs, including cost-reduction for executive officers, personnel, operations and materials and retrenchment of overseas operations; and
Resolution of NPLs.
16
Out of 60 trillion yen, 17 trillion yen was retained from the original plan to protect depositors of failed banks, while an additional 43 trillion yen—rather than the original 13 trillion yen—was made available in the October 1998 Supplementary Budget, consiting of 25 trilloin yen for capital injections into weak but viable banks and 18 trillion yen for funding operations of temporarily nationalized banks.
17
Of all the city banks, Tokyo-Mitsubishi alone did not receive public funds in 1999 and therefore did not submit such a plan.
Table 2. Public Capital Injection into the Banking System, March 1998 and 1999
(Billions of yen)
March 1998 March 1999
Banks Total Preferred
Shares Subord. Debt.(a) Subord. Loans Total Preferred Stocks Subord. Debt City Banks Tokyo Mitsubishi 100 0 100 0 -- -- --Daiichi Kangyo 99 99 0 0 900 700 200 Sakura 100 0 100 0 800 800 0 Sumitomo 100 0 100 0 501 501 0 Fuji 100 0 100 0 1,000 800 200 Sanwa 100 0 100 0 700 600 100 Tokai 100 0 0 100 600 600 0 Daiwa 100 0 0 100 408 408 0 Asahi 100 0 0 100 500 400 100
Long-Term Credit Banks
Industrial Bank of Japan 100 0 100 0 600 350 250
Long-Term Credit Bank(b) 176.6 130 0 46.6 -- --
--Nippon Credit Bank(b) 60 60 0 0 -- --
--Trust Banks
Mitsubishi Trust Bank 50 0 50 0 300 200 100
Sumitomo Trust Bank 100 0 100 0 200 100 100
Mitsui Trust Bank 100 0 100 0 400.2 250.2 150
Yasuda Trust Bank 150 0 150 0 -- --
--Toyo Trust Bank 50 0 50 0 200 200 0
Chuo Trust Bank 60 32 0 28 150 150 0
Regional Banks
Yokohama Bank 20 0 0 20 200 100 100
Hokuriku Bank 20 0 0 20 -- --
--Ashikaga Bank 30 0 30 -- --
--Total 1,815.6 321 1,080 414.6 7,459.2 6,159.2 1,300
Note: (a) These debentures are generally of a consol nature and are therefore considered upper tier-2 capital. The only exceptions are those issued by Sanwa Bank and the Industrial Bank of Japan whose debentures are of fixed (10-year) duration and are therefore lower tier-2 capital, which is limited to no more than half of tier-1 capital.
(b) These banks were granted only part of the injection for which they applied.
Source: Deposit Insurance Corporation and the Financial Reconstruction Commission.
In May 2003, Resona Holdings asked for public recapitalization when the capital adequacy ratios of Resona Bank and Resona Holdings for March 2003 fell short of the 4 percent threshold. The government injected 1.96 trillion yen based on the Deposit Insurance Law. In November, Resona Holdings made public a restructuring plan, including NPL disposal of 1.3 trillion yen—thereby reducing the NPL ratio from 9.3 percent in March 2003 to less than 4 percent by March 2005—and cutting the number of employees and operational costs.
Recognition of NPLs. The authorities had long avoided to recognize the full extent of bank NPLs. However, the 1997-98 crisis led the authorities to assess the solvency and soundness of the capital bases of the individual banks. The Ministry of Finance identified the total amount of NPLs for major banks as of March 1998 to be 22 trillion yen. The newly established The newly established Financial Supervisory Agency, under the guidance of the Financial Reconstruction Commission (FRC) and together with
the Bank of Japan, identified the total amount of NPLs for all deposit taking institutions to be 39 trillion yen as of March 1999. However, these inspections were based on
self-assessment of NPLs by banks, and there arose doubt whether these figures would represent the reality.
The Financial Services Agency (FSA), a new agency that replaced the Financial Supervisory Agency, launched special audits of bank loans for the period October 2001 to March 2002. The inspection was limited to large borrowers whose market indicators, such as share prices and credit ratings, had deteriorated rapidly, and where the exposure of each bank was high. This process resulted in inspections of loans to 149 companies, and a quarter of the “normal” or “need attention” loans examined were reclassified to bad loans—“bankrupt” or “in danger of bankruptcy” loans.18 The increased regulatory pressure led to a dramatic change in loan classifications by the banks in 2002, with the value of NPLs rising by more than 25 percent from 33.6 trillion yen in March 2001 to 43.2 trillion yen in March 2002 (see Table 3). The FSA conducted the second round special inspection in 2003, covering 167 borrowers including 142 that were inspected in the first round in 2001, with total loans of 14.4 trillion yen from 11 major banks.
Disposal of NPLs. Commercial banks have been addressing NPL problems since
the beginning of the 1990s and have accelerated the pace of disposal since 1999. Banks have disposed of close to 90 trillion yen—about 17 percent of 2002 GDP—in the last ten years. Despite such efforts, the pace of net reduction of bank NPLs has been slow due to the emergence of new NPLs. Nonetheless, the stock of NPLs declined in March 2003 for the first time in five years.
In October 2002, the FSA announced the Program for Financial Revival, an ambitious three-pronged strategy to accelerate bank restructuring:
· ·
Bank shareholding is to be reduced to 100 percent of tier-1 capital by September 2006.
Loan classification and loan loss provisioning are to be strengthened through (a) new inspection of major banks’ loan classification and provisioning, (b)
introduction of the discounted cash flow method for provisioning loans to large “special attention” and “in danger of bankruptcy” borrowers, (c) harmonization of loan classification for large borrowers across banks, (d) disclosure of the gap
18
Bank loans are classified into five risk categories, i.e., normal, need attention, special attention, in danger of bankruptcy, and bankrupt/de facto bankrupt. “Normal loans” are loans to borrowers having strong results and no particular problems with its financial condition. “Need attention loans” are loans to borrowers having problems with lending conditions, fulfilment or its financial conditions, etc. “Special attention loans” are a subset of “need attention loans,” which are overdue more than 3 months or having problems with lending conditions (i.e., waivers, reductions or deferrals of interest). “In danger of bankruptcy loans” are loans to borrwers facing business difficulties and failing to make adequate progress on its business improvement plan, so that there is a possiblity of falling into bankruptcy in the future. “Bankrupt loans” are loans to legally and formally bankrupt borrowers, including bankruptcy, liquidation, reorganization, rehabilitation, composition and suspension of dealings on the bill exchange, while “de facto bankrupt loans” are loans to borrowers who are in serious business difficulties and considered to be impossible to rebuild, though not yet leagally and formally bankrupt. See Appendix Table 2 for details of loan classification.
between major banks’ self-assessment of problem loans and FSA assessment, and (e) external audit of capital adequacy ratios, starting in FY2003. There are also measures to improve the classification of loans to SMEs.
·
Banks are to remove 50 percent of new NPLs within one year and 80 percent within two years, with a target of reducing the proportion of major banks’ NPLs by half by March 2005 from its level of 8.6 percent in March 2002. However, no target has been set for regional banks.
Table 3. Outstanding Stock and Disposals of Non-Performing Loans, All Domestically Licensed Banks (End of Fiscal Year)
(Unit: Billion yen)
FY1992 FY1993 FY1994 FY1995 FY1996 FY1997 FY1998 FY1999 FY2000 FY2001 FY2002 Non-performing Loans: Outstanding Stock -- (12,774) -- (13,576) --(12,546) 28,504 (21,868) 21,789 (16,491) 29,758 (21,978) 29,627 (20,250) 30,366 (19,772 32,515 (19,281) 42,028 (27,626) 34,849 (20,433)
Loan Loss Provision:
Outstanding Stock (3,698) -- -- (4,547) --(5,536) 13,293 (10,345) 12,334 (9,388) 17,815 (13,601) 14,797 (9,258) 12,230 (7,678) 11,555 (6,939) 13,353 (8,657) 12,585 (7,897) NPL Disposals -- (1,640) -- (3,872) --(5,232) 13,369 (11,067) 7,763 (6,210) 13,258 (10,819) 13,631 (10,440) 6,944 (5,398) 6,108 (4,290) 9,722 (7,721) 6,658 (5,104) New Net LLP -- (945) -- (1,146) --(1,402) 7,087 (5,576) 3,447 (2,534) 8,403 (6,552) 8,118 (15,490) 2,531 (1,339) 2,732 (1,371) 5,196 (3,806) 3,101 (2,042) Direct Write-offs -- (424) -- (2,090) --(2,809) 5,980 (5,490) 4,316 (3,676) 3,993 (3,501) 4,709 (4,268) 3,864 (3,609) 3,072 (2,650) 3,974 (3,414) 3,520 (3,038) Other -- (271) -- (636) --(1,022) 302 (1) 0 (0) 863 (766) 804 (683) 548 (449) 304 (269) 552 (501) 37 (25) Operating Profits 4,685 4,439 4,484 6,753 6,418 5,503 3,129 4,675 4,768 4,693 4,674 Total Loans: Outstanding Stock 474,783 477,150 477,801 482,701 482,312 477,979 472,610 463,484 456,965 440,610 423,286 NPL/Total Loan (%) -- -- -- 5.91 4.52 6.23 6.27 6.55 7.12 9.54 8.23
Capital Adequacy Ratio (%) -- -- -- -- -- -- 10.06 10.88 10.75 10.12 9.52
Note: (1) Data in the table are figures for the Banking Accounts of All Domestically Licensed Banks (i.e., city banks, long-term credit banks, trust banks, and regional banks) while data in parentheses are those for city banks, long-term credit banks and trust banks. Data for operating profits and capital adequacy ratios also include foreign trust banks.
(2) Non-performing loans in this table refer to “risk management loans” (losses+loans more than 3 months overdue+loans with term restructured), except that the definitions prior to FY1997 are slightly different: they are losses + overdue loans for FY1992-94 and losses+loans more than 6 months overdue+loans with interest reduced for FY1995-96.
(3) The capital adequacy ratio is the ratio of capital to risk assets.
Source:Financial Services Agency; Bank of Japan.
3. Bank Business Strategy and Consolidation
Japanese banks are now restructuring and repositioning on the heels of the prolonged financial distress. The restructuring and repositioning are pursued against the background of the Financial Big Bang, the IT revolution,19 and a policy shift from protection to a more market-based framework. Moreover, the general overbanking situation has aggravated banking businesses due to the shrinking market size, economic stagnation and a structural change in the financial intermediation towards direct finance and capital markets.20
19
In the age of IT revolution, banks will compete fiercely to provide high-quality and customized financial services at low costs. The barriers between traditionally segmented sectors such as banking, security, insurance, and even commerce will diminish and market participants will all strive to provide
comprehensive financial services with the result that financial markets will become larger, more integrated, and competitive.Furthermore, there will be a need for infrastructure services for electronic certification, identification, credit evaluation, payment settlement, and e-securities. Banks will, in partnership with IT-related corporations, develop and install the systems which will provide such infrastructure services. 20
As a result of large corporations’ increasing reliance on capital markets for funding, corporate demand for bank services is changing from loan business to new areas such as: investment banking; development and provision of services facilitating the liquidity of securities and project finance; and technical services in developing and installing a new accounting framework designed to conform to international standards.
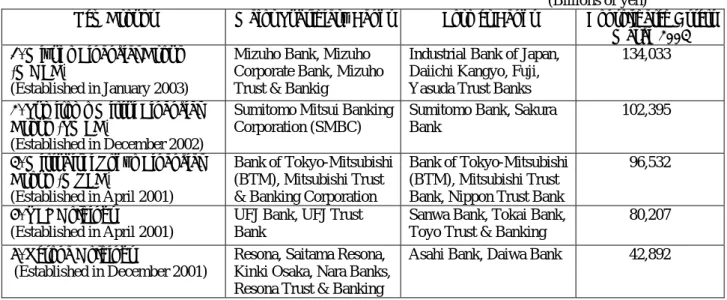
Table 4: Banking Groups and Consolidated Assets
(Billions of yen)
New Groups Major Subsidiary Banks Former Banks Consolidated Assets
March 2003 1. Mizuho Financial Group
(MHFG)
(Established in January 2003)
Mizuho Bank, Mizuho Corporate Bank, Mizuho Trust & Bankig
Industrial Bank of Japan, Daiichi Kangyo, Fuji, Yasuda Trust Banks
134,033
2. Sumitomo Mitsui Financial Group (SMFG)
(Established in December 2002)
Sumitomo Mitsui Banking Corporation (SMBC)
Sumitomo Bank, Sakura Bank
102,395
3. Mitsubishi Tokyo Financial Group (MTFG)
(Established in April 2001)
Bank of Tokyo-Mitsubishi (BTM), Mitsubishi Trust & Banking Corporation
Bank of Tokyo-Mitsubishi (BTM), Mitsubishi Trust Bank, Nippon Trust Bank
96,532
4. UFJ Holdings
(Established in April 2001)
UFJ Bank, UFJ Trust Bank
Sanwa Bank, Tokai Bank, Toyo Trust & Banking
80,207 5. Resona Holdings
(Established in December 2001)
Resona, Saitama Resona, Kinki Osaka, Nara Banks, Resona Trust & Banking
Asahi Bank, Daiwa Bank 42,892
Source: Individual groups’ website.
Motivated by distress, large Japanese banks have engaged in a series of defensive mergers. In April 1996, the then-largest Bank of Tokyo-Mitsubishi was created through a merger of Mitsubishi Bank and the Bank of Tokyo. In April 2001, Bank of
Tokyo-Mitsubishi, together with Mitsubishi and Nippon Trust Banks, established a joint holding company, Mitsubishi Tokyo Financial Group (MTFG). Other mega mergers included: Mizuho Financial Group (MHFG)—initially established as Mizuho Holdings by Industrial Bank of Japan, Daiichi Kangyo, Fuji, and Yasuda Trust Banks (September 2000) and later reorganized into MHFG (January 2003); UFJ Holdings—formed by Sanwa, Tokai and Toyo Trust Banks (April 2001); Sumitomo Mitsui Financial Group (SMFG)—created by Sumitomo Mitsui Banking Corporation (December 2002), which had been formed as a result of an earlier merger of Sumitomo and Sakura Banks in April 2001; and Resona Holdings—initially established as Daiwa Holdings mainly by Daiwa Bank (December 2001) and later renamed to Resona Holdings (October 2002) following the absorption of Asahi Bank. The largest group is Mizuho Financial Group (MHFG) with a consolidated asset portfolio of 134 trillion yen as of March 2003, accounting for close to twenty percent of the total asset portfolio of all domestically licensed banks. Sumitomo Mitsui Financial Group (SMFG) is the second largest, followed by Mitsubishi Tokyo Financial Group (MTFG) and UFJ Holdings, with consolidated asset portfolios of 102, 97, and 80 trillion yen respectively. Resona Holdings is the smallest with 43 trillion yen (see Table 4).
These groups’ strategic objectives are:
Gaining maximum market power in a region or a niche market; ·
· · ·
Attaining economies of scale and drastic reduction of operational costs; Generating enough profits to invest in IT development; and
Building a critical mass capacity in strategic areas, e.g., investment banking, asset management, and high-skill fee-based businesses.
All these objectives are pursued to substantially improve their ROEs that now lag behind those of competitive foreign banks.
While the consolidation of the banking sector will presumably result in economies of scale, it remains to be seen whether desired results are secured. For instance, there is an expectation that the large size of banks will reduce operational costs per unit of asset, given the inverse relationship between the asset size and costs per unit of asset. However, reductions in operational costs and gains in efficiency will result in increases in asset size if and only if all the redundancies that are created by the merger are eliminated and the opportunities for synergy are fully exploited.21
4. Linkages with Corporate Restructuring
Corporate sector restructuring is the mirror image of bank NPL resolution. Resolution of bank NPLs requires real operational restructuring and revitalization of corporations. There are in general three frameworks to accelerate corporate restructuring (see Table 5 for a summary of recent changes in legal and institutional arrangements):
Table 5. Legal and Instituional Changes to Facilitate Corporate Restructuring
Year Changed Laws, Procedures and Institutions Contents
1997 Commercial Codes Procedures for corporate mergers rationalized.
December 1997 Anti-Monopoly Law Establishment of pure holding companies allowed.
March 1998 Financial Holding Company Law Establishment of financial holding companies allowed.
1999 Commecial Codes Share swaps introduced; procedures related to parent
and subsidiary companies rationalized. April 1999 Resolution and Collection
Corporation (RCC)
A colletion company to purchase and sell collateral- based NPLs—“in danger of bankruptcy” or blow. April 2000 Civil Rehabilitation Law (Minji
saisei Ho)
Facilitates filings and decisions for large number of firms
2000 Commercial Codes Procedures for corporate splits introduced.
September 2001 Voluntary procedures for corporate debt restructuring based on the London rules (by INSOL)
Guidelines for debt forgiveness agreed.
April 2003 Corproate Restructuring Law (Kaisha kosei Ho)
Restructuring provisions eased and some flexibility allowed in the restructuring measures in line with those of the Civil Rehabilitation Law.
April 2003 Industrial Revitalization Corporation of Japan (IRCJ)
Resturucturing of large firms made easier through purchase of NPLs from all non-main bank creditors.
Source: Financial Services Agency, Ministry of Finance, OECD.
· ·
Legal insolvency procedures;
A framework for voluntary out-of-court negotiations for corporate 21
One clear example of economies of scale has to do with pooling resources for IT related investments. No single bank can afford a critical mass investment in IT development while a number of them together may. Another has to do with streamlining and downsizing the managerial/staffing structure. Banks may strive to downsize the professional staff into a cadre of much fewer highly specialized and highly paid professionals assisted by support staff whose salaries are relatively low, thereby increasing productivity and reducing the total wage cost.
restructuring—based on the London rules of INSOL; and ·
Corporate restructuring by public asset management companies, such as the RCC and IRCJ.
The Japanese insolvency system consists of two liquidation
procedures—Liquidation (Hasan) and Special Liquidation (Tokubetsu seisan)—and three reorganization procedures—Corporate Restructuring (Kaisha kosei), Civil Rehabilitation (Minji saisei) and Corporate reorganization (Kaisha seiri). Special Liquidation and Corporate Reorganization are based on the commercial code, whereas the others are on their own special laws. Because these insolvency procedures were legislated separately and a long time ago, the system lacked coherence and was outdated. To help accelerate corporate restructuring, more flexible procedures have been introduced. As a result, the Japanese legal system is not regarded as an impediment to corporate restructuring.
A framework for voluntary, multi-creditor out-of-court negotiations for corporate restructuring—based on the London rules of the International Federation of Insolvency Professionals (INSOL International)—has been introduced. This introduction is based on the recognition that while insolvency procedures secure transparency they lack the speed and flexibility needed for efficient corporate debt restructuring. However, the major focus of this voluntary framework has been on setting guidelines for debt forgiveness, rather than on a comprehensive debt restructuring negotiation process.22
To accelerate NPL disposal, the government established asset management companies, the Resolution and Collection Corporation (RCC) and the Industrial
Revitalization Corporation of Japan (IRCJ). They are playing a role to promote corporate restructuring and to accelerate the disposal of NPLs by purchasing such loans from banks through 2005. These two publicly supported institutions are aimed at different types of loans and corporations. The RCC functions essentially as a collection company that purchases and sells collateralized NPLs, classified as “in danger of bankruptcy” or “bankrupt,” focusing on smaller, non-viable firms. Its function has been strengthened since June 2002, with greater flexibility in deciding the purchase price—i.e., at fair value—and in buying them from healthy institutions until May 2004. As a result, the volume of its transactions has risen significantly recently. The IRCJ, in contrast, focuses on a higher quality of NPLs—classified as “need special attention”—for larger firms.23 The objective is to promote debt and operational restructuring of relatively large, troubled but viable firms by purchasing their loans from secondary banks, leaving the main bank and the IRCJ as the only major creditors. This approach should provide a better
framework for the main bank to deal with its troubled clients.
In recent years, corporate debt/equity ratios have come down and profitability has risen, particularly for large firms due to restructuring measures such as downsizing and 22
In the crisis-affected economies in East Asia, formal insitutions to help accelerate the voluntary out-of-court negotiations were established—Corporate Debt Restructuring Advisory Committee in Thailand, Corporte Debbt Restructuring Committee in Malaysia, the Jakarta Initiative Task Force in Indonesia, and Corproate Restructuring Coordination Committee in Korea (see Kawai 2000, Kawai, Lieberman and Mako 2001, Kawai 2001). In Japan, such an institution has not been created. 23
cost-cutting. As major banks have recently created asset management subsidiaries to dispose of NPLs and markets for distressed assets have been developing, corporate debt restructuring has accelerated its pace. Nonetheless, smaller firms, particularly in the non-manufacturing sectors, continue to suffer from high leverage, low profitability and excess capital and labor.
5. Establishing a Market-based Regulatory and Supervisory Framework
A final goal of banking sector regulation and supervision is to establish a regulatory and supervisory framework based on clearly articulated rules and more transparent administration consistent with a competitive, integrated and open banking sector. The following four points have been the authorities’ focus:
· · · ·
A clearly defined system of bank supervision and inspection; A system of prudential norms;
Corporate governance of banks; and Enforcement of bank regulation and rules.
Bank supervision and inspection. To strengthen bank supervision and inspection,
the Financial Services Agency (FSA) was newly established, merging the Financial Supervisory Agency and the Financial System Planning Bureau of the Ministry of Finance in July 2000. This completed the transfer of supervision, inspection and policy planning functions from the MOF to an independent regulatory agency.24 The FSA has been increasing transparency of its operations. Some improvements can be made however: The FSA’s autonomy could be enhanced by establishing a board with outside members to whom the Commissioner would be accountable; and the information exchange arrangements with the Bank of Japan and other regulatory agencies could be formalized.
Prudential norms. A system of prudential norms has been strengthened,
including loan classification and loan loss provisioning, capital adequacy requirements, prompt corrective action, and a deposit insurance scheme.
First, loan classification and loan loss provisioning have been tightened, based on the October 2002 Program for Financial Revival, particularly through the introduction of the discounted cash flow method for provisioning loans to large “special attention” and “in danger of bankruptcy” borrowers. However, these tighter requirements have been imposed only on major banks, and not on regional banks. On the other hand, upon receiving public capital in May 2003, Resona Holdings adopted greater loan loss provisioning. As a result, there are currently triple standards for loan loss provisioning, i.e., a very tight standard adopted by Resona, a relatively tight standard adopted by other major banks, and a less stringent standard applied to regional banks.
Second, on capital adequacy, currently banks without overseas
24
The BOJ still retains the function of bank examination with a view to ensure soundness of its transaction counterparts.
offices—“domestic banks”—are subject to a BIS capital adequacy ratio of 4 percent compared with 8 percent for “internationally active banks.” In addition, deferred tax credits now represent about a half of the major banks’ tier-1 capital, indicating heavy undercapitalization of banks.25 In its recent Financial Sector Assessment Program (FSAP) report on Japan, the IMF recommended that all banks should achieve 8 percent capital adequacy ratios and that the inclusion of deferred tax credits in regulatory bank capital should be limited.26
Third, prompt corrective action needs to be invoked in response to a deterioration of a bank’s capital ratio. Prompt corrective action was introduced in June 1996 and was invoked by the authorities for the first time in May 1999. This procedure would force an undercapitalized bank to take corrective measures to strengthen its capital base and, if it fails to do so, would allow the authorities to take further action. Its objective is to move away from case-by-case regulation and ad hoc resolution of problem institutions to a rule-based system of bank supervision and regulation.
Fourth, full implementation of the limited deposit insurance scheme from April 2003 has been postponed reflecting the continuing fragility of the banking system. Comprehensive deposit insurance was put in place in June 1995, to be maintained until March 2001. As the banking system was stabilized in 1999, the authorities began to restore a limited deposit insurance system. The first move was to limit protection on time deposits only up to 10 million yen per depositor per bank starting in April 2002. At this time, it is unclear whether limited deposit protection would be fully implemented. The system should be designed in a way to stimulate depositors’ incentives to closely monitor the health of banks. If a subset of demand deposits continues to be fully protected, insurance premiums will have to be raised so that depositors can make a judgment about the costs and benefits of the protected deposits.
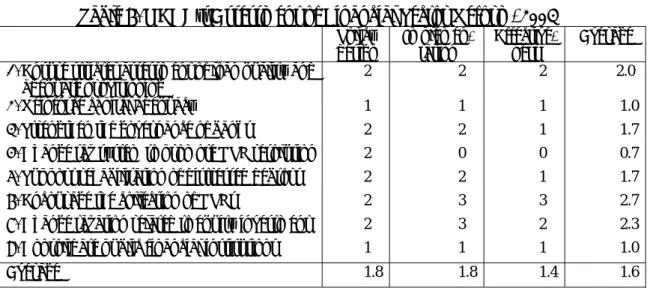
Assessment of reform. Table 6 is a summary of assessments of the government’s reform
program in the financial sector, as provided by the OECD. The reform program is assessed from the perspectives of policy design, stage of implementation, and
effectiveness, each with a scale of 0 (no progress) to 3 (satisfactory achievement). The table shows that the OECD considers progress on capital adequacy to be limited at all levels because of the absence of explicit guidelines for restricting the inclusion of deferred tax assets in banks’ regulatory capital, leaving such judgments to accounting firms. The reform on taxation to promote NPL resolution is rated low for implementation and effectiveness because of the absence of deductions of provisions for doubtful loans and a loss carry-back. The reform of major public financial institutions and postal savings is also rated low at all levels because of the effective postponement of reform. Collection
25
Deferred tax assets (DTAs) are credits against taxes on future income and often included in regulatory capital. A rationale for this practice is that, given the tax authorities’ treatment of all loan loss provisions as tax non-deductible unless the loan losses are legally recognized, part of the current loan loss provisions should be considered as capital because future borrower failures would reduce future tax obligations. But TDAs are usable only when the bank makes profits in the future, while not available to meet losses if the bank fails.
26
The FSA insists that the agency is not in the position to determine the extent of inclusion of deferred tax credits in capital, but that it is the auditors who should decide. However, it is one thing to define capital for accounting purposes, and it is another to define regulatory capital for prudential purposes.
of NPLs is rated high because of the progress made by the RCC and the creation of the IRCJ, while rehabilitation of distressed debtors is not judged to have made significant progress. The corporate governance of banks has not been strengthened enough despite the authorities’ pressure on publicly recapitalized banks to improve it.27
Table 6. OECD’s Assessment of Financial Sector Reform, 2003
Policy
design Implemen-tation Effective- ness Average
1. Ensure stricter assessment of loan quality and adequate provisioning
2 2 2 2.0
2. Reinforce capital adequacy 1 1 1 1.0
3. Strengthen the governance of banks 2 2 1 1.7
4. Change tax system to promote NPL resolution 2 0 0 0.7
5. Support rehabilitation of distressed debtors 2 2 1 1.7
6. Encourage the collection of NPLs 2 3 3 2.7
7. Change taxation related to equity investment 2 3 2 2.3
8. Consolidate public financial institutions 1 1 1 1.0
Average 1.8 1.8 1.4 1.6
Source: OECD, OECD Economic Surveys, Japan, 2003.
VI. CONCLUDING REMARKS
Japan has experienced a decade of economic stagnation with a distressed banking sector. The asset price bubble in the late 1980s and its collapse were largely responsible for the emergence of NPLs and the banking sector problem. The absence of a credit culture to assess and price credit risks of borrowers was also an important factor behind banks’ overextension of collateral-based but risky loans, all of which was aggravated by weak prudential and supervisory frameworks.
The authorities’ earlier “growing out” approach without a comprehensive strategy addressing the banking sector problem was clearly a mistake in the sense that it allowed a systemic banking crisis to emerge in 1997-98 and a large output loss during 1998-2002. The authorities failed to tackle the problem much more decisively, comprehensively and early enough because of their:
· · ·
Underestimation of the nature and seriousness of the problem;
Unwarranted expectations of growth which would restore asset values and health in banks’ balance sheets;
Continued injection of fiscal resources to support aggregate demand, thereby allowing insolvent firms to survive and delaying the resolution of the problem; and
27
Publicly recapitalized banks are now required to strengthen their corporate governance by following their restructuring plans. The FSA can exercise greater discretion over the corporate governance of banks if they fall short of the restructuring targets by more than 30 percent, including the resignation of the bank CEO and the suspension of bonuses to directors.