Health Insurance in Kansas
KHI.ORG
Informing Policy. Improving Health.
This publication is available online at khi.org/AIU2014.
KANSAS HEALTH INSTITUTE
Connect with us!
MAY 2014
Authors
Scott C. Brunner, M.A. Cheng-Chung Huang, M.P.H.
Acknowledgements
The authors wish to thank the Division of Health Care Finance at the Kansas Department of Health and Environment for providing the Medicaid and Children’s Health Insurance Program enrollment data for this report.
Health Insurance in Kansas
ANNUAL INSURANCE UPDATE 2014
Table of Contents
1 How to Use This Report 2 A Tale of Two Data Sets
3 Insurance Coverage in Kansas 4 Sources of Health Insurance 6 All Kansans
9 Adults, Age 19–64 14 Children, Age 0–18 16 County Comparison
ABOUT THIS REPORT
CURRENT COVERAGE
COVERAGE TRENDS
APPENDIX
18 Impact of Public Policy 20 Role of Family Income 22 Role of Employment
23 Types of Health Insurance Coverage 24 About the Data
As efforts to reform the health care system continue both nationally and here in Kansas, the Kansas Health Institute (KHI) has prepared this Annual Insurance Update, which explains insurance coverage in Kansas and includes new data and information from the U.S. Census Bureau. The analysis contained here may be used to better understand how the Affordable Care Act (ACA) and other federal health policy changes may affect decision-making in our state.
After an initial overview of insurance coverage — who has it and who does not — the report outlines where Kansans get their health insurance, and identifies the link between employment and insurance coverage. Then, maps will illustrate differences in coverage across the state, including Medicaid participation. Finally, the report includes a look at the important trends in insurance coverage during the last five years, which not only put the current status into context, but also begins to project what the future of insurance coverage in our state might look like.
In addition to providing an overview for all Kansans, the “Current Coverage” section (page 3) of this report examines the major sources of
health insurance for children (age 0–18), non-elderly adults (age 19–64), and seniors (age 65 and older). The section also highlights differences in insurance coverage among Kansans based on their race or ethnicity, income and employment status. Because nearly all Kansans age 65 and older are covered by the federal Medicare program, much of this report focuses on children and adults younger than 65.
Information about insurance coverage in this report is based primarily on data from the American Community Survey (ACS), collected by the U.S. Census Bureau.
Changes in the Numbers Behind the Report
For this year’s Annual Insurance Update, KHI has purposefully shifted to the ACS as the primary data source for information about insurance status in Kansas. The ACS data are more current, and because of the larger sample size in Kansas, can be shown as single-year estimates. In addition, the ACS data set provides for more detailed analysis of insurance status at county and regional levels.
How to Use This Report
ABOUT THIS REPORT
A Tale of Two Data Sets
The U.S. Census Bureau publishes data on health insurance coverage from two surveys: the Annual Social and Economic Supplement to the Current Population
Survey (CPS) and the American Community Survey (ACS). The results from these surveys are typically, although not always, quite similar.
Why are the numbers different?
Typically the estimates based on these surveys are within 1 to 2 percentage points of each other. When there are differences, they are likely due to:
How the data are reported. For example, two-year averages versus year-by-year rates.
Timing of data collection. CPS gathers data from February to April each year, while ACS gathers data year-round.
Other methodological differences, such as the number of people surveyed and the phrasing of survey questions.
The CPS asks about insurance coverage for the prior calendar year and allows respondents to provide all of the sources of insurance that they had. While this is supposed to capture health insurance status throughout the prior year, most analysts treat the responses as a point in time estimate of insurance coverage. The ACS specifically asks about coverage at the time of the survey and is believed to provide a more specific estimate of insurance coverage.
The ACS is becoming the preferred survey among research organizations like KHI to understand changes in health insurance coverage. The larger sample size and timing of the data releases allow reporting for individual
insurance policy environment, such as those brought about by the implementation of the Affordable Care Act.
While the CPS provides valuable information about long-term trends in health insurance coverage, the ACS will
KHI has moved to the ACS
Insurance Coverage in Kansas
About 359,000 Kansans — or 12.6 percent of the population — were uninsured in 2012, which was consistent with 2011. This was significantly lower than the 14.8 percent of all Americans without insurance in 2012.
Uninsured Rate Among Kansas Children,
Age 0–18
Approximately 56,000 Kansas children age 0–18 (or 7.3 percent) were uninsured in 2012. This rate was slightly lower at 6.3 percent in 2011; but the overall trend shows a decline in the rate of uninsured children since 2008, as shown in Figure 1.
Uninsured Rate Among Kansas Young Adults,
Age 19–25
In 2012, there were about 65,200 young adults (age 19–25) that did not have health insurance. The rate of uninsurance for 19–25 year-olds has declined significantly since 2009 (26.8 percent to 22.3 percent). This follows the national trend in insurance coverage for young adults, as shown by a reduction in the uninsured rate from 31.7 percent in 2009 to 28.2 percent in 2011.1 Analysts
attribute this decrease to a provision in the federal health reform law that took effect in September 2010, which allows dependents to stay on their parents’ or guardians’ health insurance plans until they reach age 26.
Figure 1. Uninsured Rates for Kansas and the United States, 2008–2012
Source: KHI estimates based on 2008–2012 American Community Survey Public Use Microdata Sample. 0
3 6 9 12 15 18
Per
cent Uninsur
ed
Year
2008 2009 2010 2011 2012
United States, All Ages All Kansans
Kansas Children, Age 0–18
12.2%
7.3% 12.6% 12.6%
13.9% 13.2%
9.3%
8.6%
7.8%
6.3%
15.1% 15.1% 15.5% 15.1% 14.8%
All Kansans
More than half — 52.2 percent — of all Kansans are covered by employment-based health insurance and 29.4 percent are covered by a public health insurance program such as Medicare or Medicaid.2 Kansans
who don’t have employment-based coverage or public coverage may have other private3 insurance, but
in general, are more likely to be uninsured, as shown in Figure 2.
Figure 2. Sources of Health Insurance: All Kansans, 2012
Figure 3. Sources of Health Insurance: Kansas Adults,
Age 19–64, 2012
Employment-Based 52.2% Other Public
0.4%
Medicare 12.8% Medicare
and Medicaid
2.4%
Medicaid/CHIP 10.9%
Other Private 5.9% Uninsured
12.6%
Private Insurance Uninsured Public Insurance
Military/TRICARE 2.9%
(58.1%)
(12.6%) (29.4%)
Employment-Based 63.5% Other
Public 0.6% Medicare
2.0% Medicare and
Medicaid 1.4% Medicaid/CHIP
4.8%
Other Private 7.1% Uninsured
17.6%
Military/TRICARE 2.9%
Private Insurance Uninsured Public Insurance
(76.6%) (11.7%) (17.6%)
Note: All Kansans = approximately 2,844,400. Percentages may not add to 100 percent because of rounding. Other public is coverage through the U.S. Department of Veterans Affairs. Other
Private is coverage directly purchased by individuals.
Source: KHI estimates based on 2012 American Community Survey Public Use Microdata Sample.
Note: All Kansas adults age 19–64 = approximately 1,708,700. Percentages may not sum to 100 percent because of rounding.
Adults, Age 19–64
For adult Kansans under age 65, employers are the largest source of insurance. Almost two-thirds (63.5 percent) of 19- to 64-year-olds have employment-based coverage, while 7.1 percent have other private insurance. The remainder has either public insurance (11.7 percent) or no insurance at all (17.6 percent), as shown in Figure 3.
Children, Age 0–18
More than half (51.5 percent) of Kansas children are covered by employment-based insurance, typically through a parent’s employer. More than a third (35.0 percent) receive public coverage such as Medicaid, the Children’s Health Insurance Program (CHIP) or Medicare, as shown in Figure 4. Children are more likely to be insured than adults (age 19 to 65) because they are more likely to be eligible for public coverage. Children in families with incomes under 232 percent of the federal poverty level (FPL) may be eligible for public programs like Medicaid or CHIP. as shown in Figure 4.
Figure 4. Sources of Health Insurance: Kansas Children,
Age 0–18, 2012
Figure 5. Sources of Health Insurance: Kansans,
Age 65 and Older, 2012
Employment-Based
51.5%
Medicare
0.9%
Medicare and Medicaid
0.2%
Medicaid/CHIP
29.9%
Other Private
6.0%
Uninsured
7.3%
Military/TRICARE
4.0%
Private Insurance Uninsured Public Insurance
(57.5%) (35.0%) (7.3%)
Medicare 86.4%
Employment-Based 2.0% Uninsured
0.3%
Private Insurance (2.1%) Uninsured (0.3%) Public Insurance (97.7%)
Other Public 0.2%
Other Private 0.1%
Medicare and Medicaid
11.1%
Older Kansans, Age 65+
Almost all (97.7 percent) Kansans age 65 and older have public health insurance: 97.5 percent have Medicare coverage4, including 11.1
percent with combined coverage through both Medicare and
Medicaid. An additional 2.0 percent have employment-based coverage only (instead of Medicare), as shown in Figure 5. Because so many older Kansans are covered by the federal Medicare program, much of the remainder of this report focuses on children and non-elderly adults.
Note: All Kansas children age 0–18 = approximately 762,400. Percentages may not add to 100 percent because of rounding. Other Private is coverage directly purchased by individuals.
Source: KHI estimates based on 2012 American Community Survey Public Use Microdata Sample.
Note: All Kansans age 65 and older = approximately 373,300. Percentages may not add to 100 percent because of rounding. Other Private is coverage directly purchased by individuals.
Other Public is coverage that includes Medicaid or VA and Military/TRICARE.
Age
Because of the availability of Medicare, few Kansans age 65 and older are uninsured. For those under 65, children up to age five are the least likely to be uninsured, while adults age 26–34 are the most likely to be uninsured, as displayed in Figure 6. The ACA mandate that allows children to be covered by their parents’ insurance until age 26 has likely contributed to a lower rate of uninsured Kansans age 19–25. Of all uninsured Kansans, 60.6 percent are between the ages of 19 and 44, as shown in Figure 7.
Figure 6. All Kansans: Likelihood of Being Uninsured
by Age Group, 2012
Figure 7. Uninsured Kansans by Age, 2012
0 5 10 15 20 25 30
OVERALL 65 and older
55-64
45-54
35-44
26-34
19-25
6-18
0-5
A
ge
Percent Uninsured 4.9%
0.3%
19.5% 22.3% 8.5%
13.0%
25.0%
9.8%
12.6%
Age 6–18
12.3%
Age 0–5
3.4% Age 19–25
18.2%
Age 26–34 23.7%
Age 35–44 18.7% Age 45–54
14.0% Age 55–64
9.5% Age 65+
0.3%
Age 0–18 Age 19–44 Age 45–64 Age 65+
(15.7%) (60.6%) (23.5%) (0.3%)
Source: KHI estimates based on 2012 American Community Survey Public Use Microdata Sample.
Note: Uninsured Kansans = approximately 358,600. Percentages may not sum to 100 percent because of rounding.
of all uninsured Kansans are between the ages of 19 and 44.
61
0
⁄
0
of all uninsured Kansans are between the ages of 19 and 44.
Family Income
Kansans with low incomes are less likely to have insurance. More than one in four (26.8 percent) with incomes below 100 percent of the federal poverty level (FPL)5,
— $23,050 for a family of four in 2012 — are uninsured. In contrast, only 3.7 percent of Kansans with incomes above 400 percent of FPL ($92,200 for a family of four in 2012) are uninsured as shown in Figure 8.
Figure 8. All Kansans: Likelihood of Being Uninsured by Poverty
Category, 2012
Figure 9. Uninsured Kansans by Poverty Category, 2012
0 5 10 15 20 25 30
Po
ver
ty Categ
or
y
Percent Uninsured Less than 100% FPL
100% to 199% FPL 200% to 299% FPL
OVERALL
300% to 399% FPL 400% FPL
or more
26.8%
12.6% 8.0%
12.9%
21.7%
3.7%
Less Than 100% FPL 29.1%
100%–199% FPL 32.3% 200%–299%
FPL 19.5% 300%–399%
FPL 9.3%
400% FPL or More
9.7%
Low-Income Middle-Income High-Income
(61.4%) (28.8%) (9.7%)
Source: KHI estimates based on 2012 American Community Survey Public Use Microdata Sample.
Note: Uninsured Kansans with poverty information = approximately 354,100. Percentages may not sum to 100 percent because of rounding.
Source: KHI estimates based on 2012 American Community Survey Public Use Microdata Sample.
However, more than two-thirds (70.8 percent) of uninsured Kansans are not poor and have incomes above 100 percent of FPL, as shown in Figure 9. These individuals are likely to be employed.
In the Affordable Care Act, people with incomes between 100 and 400 percent of the FPL are eligible to receive tax subsidies to help pay for health insurance. As shown in Figure 9, 61.1 percent of those who are uninsured in Kansas could receive some financial assistance to purchase health insurance through the ACA’s health insurance marketplaces.
of uninsured
Kansans have
family incomes
above
the
federal poverty level.
2
3
⁄
Race/Ethnicity
Kansans who are members of a racial or ethnic minority group are more likely to be uninsured than white, non-Hispanics. For example, the uninsured rate for Hispanics is more than two and a half times higher than the uninsured rate for white, non-Hispanics (28.2 percent compared with 9.9 percent) as shown in Figure 10. However, most uninsured Kansans (61.2 percent) are white, non-Hispanic, as shown in Figure 11.
Figure 11. Uninsured Kansans by Race/Ethnicity, 2012
Figure 10. All Kansans: Likelihood of Being Uninsured
by Race/Ethnicity, 2012
0 5 10 15 20 25 30
OVERALL
Other/Multiple Races, Non-Hispanic Black or African American,
Non-Hispanic Hispanic, Any Race White, Non-Hispanic
Percent Uninsured
Race/Ethnicity
9.9%
28.2%
15.0%
16.5%
12.6%
White Non-Hispanic
61.2% Black or
African American Non-Hispanic
6.5%
Hispanic Any Race
24.5% Other/Multiple
Races Non-Hispanic
7.8%
Source: KHI estimates based on 2012 American Community Survey Public Use Microdata Sample.
Note: Uninsured Kansans = approximately 358,600. Percentages may not sum to 100 percent because of rounding.
Hispanic Kansans
are more
than
1
2
⁄
2
times
as likely
to be
uninsured
than white,
non-Hispanic
Kansans.
Family Income
Most low-income, non-disabled Kansas adults are not eligible for Medicaid, and about 40 percent of them are likely to be uninsured. Only parents in families with incomes below 30 percent of FPL — less than $6,900 per year for a family of four in 2012 — are eligible for Medicaid. Childless adults without a disability do not qualify for Medicaid no matter how poor they are, even if they have no income at all. Nearly four out of ten (39.6 percent) adult Kansans with incomes below 100 percent of FPL are uninsured as shown in Figure 12. The Affordable Care Act created several mechanisms to increase the number of people with
access to affordable health insurance. One was to set up new health insurance marketplaces that sell private health insurance plans, with the cost of those plans subsidized by tax credits. Another directive was to expand eligibility for the Medicaid program. The U.S. Supreme Court ruling in 2012 that upheld the law’s constitutionality also made Medicaid expansion to adults under 138 percent of FPL essentially optional for states. In Kansas, like many other states that have not opted to expand their Medicaid program, there exists a new “eligibility gap.” People who make too much to qualify for Medicaid, but too little to qualify for tax credits in the Marketplace, are left without options for affordable insurance. Individuals with income between 100 and 400 percent of FPL are eligible for tax credits to help purchase health insurance through the marketplaces and can benefit from subsidies to help pay out-of -pocket costs for health services. As shown in Figure 13, 61.3 percent of uninsured Kansas adults have incomes in this range.
Figure 12. Kansas Adults, Age 19–64: Likelihood of Being Uninsured by
Poverty Category, 2012
Less Than 100% FPL 29.2% 100%–199% FPL 31.8% 200%–299% FPL 20.2% 300%–399% FPL 9.3% 400% FPL or More 9.5% Low-Income Middle-Income High-Income (61.0%) (29.5%) (9.5%)
Figure 13. Uninsured Kansas Adults, Age 19–64 by Poverty
Category, 2012
0 5 10 15 20 25 30 35 40 45
OVERALL
400% FPL or more 300% to 399% FPL 200% to 299% FPL 100% to 199% FPL
Less than 100% FPL BOOKLET STANDARD COLORS
KHI logo Neutrals Interior Accent colors (graphs etc.)
PMS 1797 PMS 1797 50% PMS
144 PMS144 50%
PMS
377 PMS377 50%
PMS
321 PMS321 50% PMS 520 PMS 520 50% PMS 7499 PMS 7499 50% Black 10% Black 75% Body copy PMS
660 PMS110
April 2014 Po ver ty Categ or y Percent Uninsured 35.0% 11.5% 4.5% 19.2% 17.8% 39.6%
Source: KHI estimates based on 2012 American Community Survey Public Use Microdata Sample.
Note: Uninsured Kansas adults age 19–64 with poverty information = approximately 299,200. Percentages may not sum to 100 percent because of rounding.
Source: KHI estimates based on 2012 American Community Survey Public Use Microdata Sample.
If the state chooses to expand Medicaid as provided for under the ACA, about 315,000 Kansans who earn less than 138 percent of FPL would become eligible for Medicaid. In 2014, 2015 and 2016, the federal government would pay 100 percent of the costs of covering the newly eligible Medicaid population. That federal contribution gradually declines to 90 percent by the year 2020, with the state picking up the remaining 10 percent.
Health Reform
CURRENT COVERAGE: Adults, Age 19–64
of adult
Kansans with
40
0
⁄
0
incomes
below
the federal poverty level
Race/Ethnicity
Among Kansas adults under age 65, nearly half (42.5 percent) of Hispanics and one in five (21.3 percent) black, non-Hispanics are uninsured, compared with 13.8 percent of white, non-Hispanics, as shown in Figure 14. Just as the majority of adult Kansans age 19 to 64 (78.6 percent) are white, non-Hispanics, so are the majority (61.6 percent) of uninsured non-elderly adults in Kansas, as shown in Figure 15.
Figure 14. Kansas Adults, Age 19–64: Likelihood of Being Uninsured by
Race/Ethnicity, 2012
Figure 15. Uninsured Kansas Adults, Age 19–64 by Race/Ethnicity, 2012
0 10 20 30 40 50
OVERALL
Other/Multiple Races, Non-Hispanic
Black or African American, Non-Hispanic
Hispanic, Any Race White Non-Hispanic
Race/Ethnicity
Percent Uninsured 21.3%
13.8%
42.5%
22.6%
17.6%
White Non-Hispanic
61.6% Black or
African American Non-Hispanic
6.8%
Hispanic Any Race 24.4% Other/Multiple
Races Non-Hispanic
7.3%
Note: Uninsured Kansas adults age 19–64 = approximately 301,400. Percentages may not sum to 100 percent because of rounding.
Source: KHI estimates based on 2012 American Community Survey Public Use Microdata Sample.
Although employment improves a person’s chance of being insured,
more than
three out of four
uninsured adults in Kansas are working.
Employment Status
Adult Kansans under age 65 who are unemployed are more likely to be uninsured than those who work full-time, year-round (22.2 percent compared with 11.6 percent). Most working Kansans without health insurance are those that work less than full-time or for less than the full year, as shown in Figure 16. It is important to note that 78.5 percent of uninsured Kansas adults are working, as shown in Figure 17.
Figure 17. Uninsured Kansas Adults, Age 19–64
by Employment Status, 2012
Figure 16. Kansas Adults, Age 19–64: Likelihood of Being Uninsured
by Employment Status, 2012
0 6 12 18 24 30
OVERALL
Did not work last year Worked part-time, part-year Worked part-time, year-round Worked full-time, part-year Worked full-time, year-round
Emplo
yment Status
Percent Uninsured
29.3% 27.4% 11.6%
24.0%
22.2% 17.6%
Note: Uninsured Kansas adults age 19–64 = approximately 301,400. Percentages may not sum to 100 percent because of rounding.
Source: KHI estimates based on 2012 American Community Survey Public Use Microdata Sample. Source: KHI estimates based on 2012 American Community Survey Public Use Microdata Sample.
Part-Time, Part-Year
13.8%
Full-Time, Part-Year
10.7% Part-Time,
Year-Round 17.2% Not Employed
21.5%
Full-Time, Year-Round
36.8%
Employed Not Employed
(78.5%) (21.5%)
Employer Type
Among employees age 19–64, the self-employed are more likely to not have health insurance as shown in Figure 18. However, since most adult Kansans (under age 65) work for private employers (60 percent), they make up almost two-thirds (63.5 percent) of the uninsured population in Kansas, as shown in Figure 19.
Figure 18. Kansas Adults, Age 19–64: Likelihood of Being Uninsured by
Employer Type and Size, 2012
Figure 19. Uninsured Kansas Adults, Age 19–64 by Employer
Type and Size, 2012
0 5 10 15 20 25
Not Employed Self-employed Government Employer Private Employer
Emplo
yer
T
ype
Percent Uninsured
18.6%
22.2% 23.3% 6.4%
Note: Uninsured Kansas adults age 19–64 = approximately 301,400. Percentages may not sum to 100 percent because of rounding.
Source: KHI estimates based on 2012 American Community Survey Public Use Microdata Sample.
Government Employer
5.6%
Not Employed
21.5%
Self-Employed
9.4%
Employed Not Employed
(78.5%) (21.5%)
Private Employer 63.5%
CURRENT COVERAGE: Adults, Age 19–64
Why Do So Many Working
Kansans Remain Uninsured?
Whether an employee receives insurance coverage through their employer depends on several factors. First, does the employer offer health insurance to its employees? And if coverage is offered, is the employee eligible for the insurance? For example,
only one out of five (20.0 percent) part-time employees at Kansas companies that offer health insurance were eligible for coverage in 2012. Finally, employees who are eligible for insurance must decide if the coverage is affordable and meets their needs. The portion of insurance costs that employers pass on to employees can
vary. Typically, employers cover more of the cost for an employee than they cover for family members.
Figure 20 shows the number of Kansas private employers that offer health insurance, the number of employees eligible for that insurance and what proportion actually enrolls in insurance offered through the employer.
Figure 20. Kansas Private Employers and Health Insurance Coverage, 2012A
FirmB Size
Fewer Than 10 Employees
10–24
Employees Employees25–99 Employees100–999
1,000 or More
Employees Total
Number of establishmentsC
44,107 8,708 5,915 5,972 10,152 74,854
Percent of establishments that
offer health insurance 31.5% 55.8% 86.6% 89.7% 100.0% 52.6%
Percent of employeesD
eligible for health insurance in establishments that offer health insurance
82.5% 73.1% 74.5% 80.2% 76.7% 77.5%
Percent of employees eligible for health insurance who are enrolled in health insurance at establishments that offer health insurance
81.4% 70.9% 71.6% 79.7% 72.0% 74.9%
Percent of all employees who are enrolled in health insurance at establishments that offer health insurance
67.1% 51.8% 53.3% 63.9% 55.2% 58.0%
Note: A. Based on 2012 Medical Expenditure Panel Survey (MEPS) Employer Data.
B. “Firm” refers to a unique private sector business that has one or more locations or establishments within the state. The firm size categories are based on the total number of employees regardless of location while the establishment data is limited to Kansas locations.
C. “Establishment” refers to unique business locations within the state. For example, Wal-Mart is a single firm with more than 1,000 employees that has multiple locations or “establishments” in Kansas.
Family Income
Children in families with incomes below 100 percent of FPL ($23,050 for a family of four in 2012) are almost four times more likely to be uninsured than those living in families with incomes above 400 percent of FPL ($92,200 for a family of four in 2012), as shown in Figure 21. The children most likely to be uninsured are living in households with incomes between 100 and 200 percent of FPL as shown in Figure 22.
Figure 21. Kansas Children, Age 0–18: Likelihood of Being Uninsured by
Poverty Category, 2012
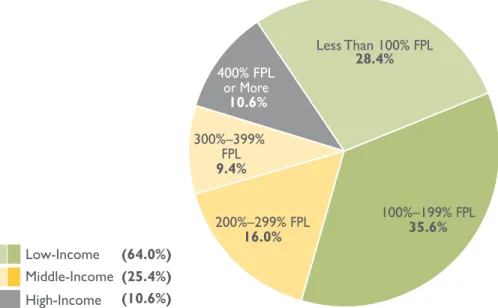
Figure 22. Uninsured Kansas Children, Age 0–18
by Poverty Category, 2012
BOOKLET STANDARD COLORS KHI logo
Neutrals Interior Accent colors (graphs etc.)
PMS 1797 PMS 1797 50% PMS
144 PMS144 50%
PMS
377 PMS377 50%
PMS
321 PMS321 50% PMS 520 PMS 520 50% PMS 7499 PMS 7499 50% Black 10% Black 75% Body copy PMS
660 PMS110
April 2014
0 3 6 9 12
OVERALL
400% FPL or more 300% to 399% FPL 200% to 299% FPL 100% to 199% FPL Less than 100% FPL
11.5% 11.0% 3.2% 5.8% 7.2% 4.6% Po ver ty Categ or y Percent Uninsured
Less Than 100% FPL
28.4% 100%–199% FPL 35.6% 200%–299% FPL 16.0% 300%–399% FPL 9.4% 400% FPL or More 10.6% Low-Income Middle-Income High-Income (64.0%) (25.4%) (10.6%)
Note: Uninsured Kansas children age 0–18 = approximately 53,700. Percentages may not sum to 100 percent because of rounding.
Source: KHI estimates based on 2012 American Community Survey Public Use Microdata Sample.
Most uninsured
Kansas children
are eligible
for Medicaid
or CHIP
based on their
family income.
About two-thirds (64.0 percent) of uninsured Kansas children live in families with incomes below 200 percent of FPL. Most of these children would be eligible for health insurance through Medicaid or CHIP. In Kansas, children in families with incomes below 225 percent of FPL in 2012 (about $51,900 for
Race/Ethnicity
Minority children in Kansas are more likely to be uninsured than white, non-Hispanic children. Hispanic children are almost twice as likely as white, non-Hispanic children to be uninsured (10.9 percent compared with 6.3 percent in 2012). As shown in Figure 23, the likelihood of being uninsured in 2012 is similar for white, non-Hispanic and Black or African American, non-Hispanic children. Even though white, non-Hispanic children and African American, non-Hispanic children are almost equally likely to be uninsured, the majority of uninsured children in Kansas are white, non-Hispanic, as shown in Figure 24.
Figure 23. Kansans Children, Age 0–18: Likelihood of Being Uninsured
by Race/Ethnicity, 2012
Figure 24. Uninsured Kansas Children, Age 0–18
by Race/Ethnicity, 2012
White Non-Hispanic
58.9%
Black or African American
Non-Hispanic 5.6%
Hispanic Any Race
25.4%
Other/Multiple Races Non-Hispanic
10.2%
BOOKLET STANDARD COLORS KHI logo
Neutrals Interior Accent colors (graphs etc.)
PMS 1797
PMS 1797 50%
PMS
144 PMS144 50%
PMS
377 PMS377 50%
PMS
321 PMS321 50%
PMS 520
PMS 520 50%
PMS 7499
PMS 7499 50% Black 10%
Black 75% Body copy PMS
660 PMS110
April 2014
0 3 6 9 12
OVERALL
Other/Multiple Races, Non-Hispanic Black or African American,
Non-Hispanic White, Non-Hispanic
Hispanic, Any Race 10.9%
9.3% 6.3%
7.3% 6.4%
Po
ver
ty Categ
or
y
Percent Uninsured
Note: Uninsured Kansas children age 0–18 = approximately 56,000. Percentages may not sum to 100 percent because of rounding.
Source: KHI estimates based on 2012 American Community Survey Public Use Microdata Sample. Source: KHI estimates based on 2012 American Community Survey Public Use Microdata Sample.
Uninsured Kansans, Age 0–64
Within Kansas, the uninsured rates for people under 65 vary significantly by county, ranging from a low of 9.9 percent in Johnson County to a high of 26.8 percent in Stanton County.
Generally the more populous, and prosperous, eastern and south-central regions of the state tend to have lower uninsured rates than the more rural, western region. More than half (52 percent) of uninsured Kansans
younger than 65 live in one of the five largest counties: Douglas, Johnson, Sedgwick, Shawnee or Wyandotte. The population of those same five counties make up 53.8 percent of the total state population age 0–64.
Uninsured Kansas Children,
Age 0–18
Like the adult uninsured rates, there is significant variation among counties in the rates of uninsured children. The overall uninsured rates for each county are lower for children than for adults, but there is nearly a fourfold difference between the highest and lowest rates of uninsured children among Kansas counties (Stanton County at
rates for children also tend to be higher in western counties.
Public Insurance Coverage in
Kansas
The number of people enrolled in public insurance programs has increased in the United States and in Kansas. Participation rates6 in
Medicaid and CHIP, the largest public insurance programs for
non-the highest participation rate at 27.7 percent, which is five times greater than the county with the lowest rate, Riley County (6.0 percent). Generally, counties in southeast Kansas have higher Medicaid and CHIP participation rates than northern and western Kansas counties. As with the uninsured, more than half — 52.2 percent — of Kansans in Medicaid and CHIP live in one of the five largest
Figure 25. Percent of Kansans, Age 0–64 Uninsured by County, 2011
Source: U.S. Census Bureau, Small Area Health Insurance Estimates (2011).
Allen 14.3% Anderson Atchison 13.6% Barber Barton 17.4% Bourbon 14.9% Brown 15.7% Butler 11.2% Chase 16.8% Chautauqua Cherokee Cheyenne Clark Clay Cloud 14.9% Coffey
Comanche Cowley14.7%
Crawford 16.7% Decatur 16.6% Dickinson 13.7% Doniphan Douglas 14.7% Edwards Elk 20.1% Ellis 12.6% Ellsworth Finney 19.3% Ford 22.2% Franklin 11.9% Geary 15.3% Gove 16.7% Graham 16.3% Grant 19.2% Gray 20.4% Greeley 17.9% Greenwood 15.7% Hamilton Harper 17.7% 13.8% 13.9% 17.4% 14.8% 16.3% 20.8% 23.8% 15.4% 15.9% 14.8% 15.5% 12.6% 12.4% 22.7% 13.9% 15.1% 12.4% 17.1% 17.8% 15.2% 15.1% 18.4% 15.2% 13.2% 14.8% 12.0% 18.3% 14.3% 14.9% 17.0% 9.9% 16.1% 16.0% 13.7% 22.1% 14.4% 15.4% 12.1% 16.1% 15.7% 16.9% 14.9% 13.2% 26.8% 12.2% 18.1% 17.4% 16.6% 19.5% 19.2% 16.5% 17.2% 19.3% 22.6% 15.4% 13.6% 14.7% 14.4% 14.3% 13.3% 21.1% 16.5% Harvey 14.5% Haskell Hodgeman Jackson Jefferson Jewell 17.6% Johnson Kearny 21.5% Kingman 14.3% Kiowa Labette Lane 16.8% Lincoln 18.3% Linn Logan Lyon Marion 14.5% Marshall 13.2% McPherson Meade Miami 10.9% Mitchell Montgomery 16.3% Morris Morton 17.3% Nemaha 12.4% Neosho Ness Norton Osage 12.4% Osborne Ottawa Pawnee Phillips Pottawatomie Pratt Rawlins Reno Republic Rice Riley Rooks Rush Russell Saline Scott 16.8% Sedgwick Seward Shawnee Sheridan Sherman Smith Stafford Stanton Stevens 21.5% Sumner Thomas Trego Wabaunsee Wallace 15.9% Washington Wichita Wilson Woodson Wyandotte Leavenworth 10.0%
Uninsured Rates: 9.9%–12.6% 13.2%–14.9% 15.1%–16.9% 17.0%–18.4% 19.2%–26.8%
CURRENT COVERAGE: County Comparison
Figure 26. Percent of Kansas Children, Age 0–18 Uninsured by County, 2011
Figure 27. Medicaid/CHIP Participation Rate of Kansans, Age 0–64 by County, 2012
Allen 6.3% Anderson Atchison 5.5% Barber Barton 8.3% 8.3% 8.3% 8.4% 8.5% Bourbon 6.6% 6.6% Brown 7.8% 7.9% 8.2% 8.2% Butler 5.4% Chase 9.5% 9.5% 9.6% 9.6% 9.7% 9.7% 9.7% 9.7% Chautauqua Cherokee Cheyenne Clark Clay Cloud 6.3% Coffey
Comanche Cowley6.4%
Crawford 6.9% 6.9% Decatur 9.2% 9.3% Dickinson 6.8% 6.8% Doniphan Douglas 6.6% 5.5% 4.8% 6.0% 6.2% 6.2% 7.0% 7.0% 7.2% 9.0% 11.0% 11.1% 7.1% 7.1% 7.1% 6.3% 6.3% 6.3% 6.3% Edwards Elk 10.5% Ellis 5.3% Ellsworth Finney 8.6% 8.6% 8.6% 8.7% 8.9% Ford 10.0% 10.3% Franklin 5.7% Geary 6.7% Gove 11.2% 11.3% 11.3% 11.5% Graham 9.4% 9.4% Grant 10.4% Gray 13.4% 14.2% 12.1% 17.4% 15.0% Greeley 12.7% 12.7% Greenwood 7.3% Hamilton Harper 9.1% Harvey 7.4% Haskell Hodgeman Jackson Jefferson Jewell 10.7% Johnson Kearny 15.7% Kingman 7.5% Kiowa Labette Lane 10.4% 10.4% Lincoln 11.1% Linn Logan Lyon Marion 7.3% Marshall 6.6% 7.4% McPherson Meade Miami 5.4% Mitchell Montgomery 7.4% 7.4% 7.5% Morris Morton 10.9% 10.9% Nemaha 6.6% Neosho Ness Norton Osage 6.4% 6.5% 6.5% 6.5% 6.5% Osborne Ottawa Pawnee Phillips Pottawatomie Pratt Rawlins Reno Republic Rice Riley Rooks Rush Russell Saline Scott 9.8% Sedgwick Seward Shawnee Sheridan Sherman Smith Stafford Stanton Stevens 12.7% Sumner Thomas Trego Wabaunsee Wallace 10.7% 10.8% Washington Wichita Wilson Woodson Wyandotte Leavenworth 4.9%
Uninsured Rates: 4.8%–5.7% 6.0%–6.9% 7.0%–8.9% 9.0%–10.9% 11.0%–17.4%
7.8%
7.5%
Source: U.S. Census Bureau, Small Area Health Insurance Estimates (2011).
Source: Medicaid Data Analytic Interface (DAI), average monthly Medicaid/Chip enrollment (2012).
Allen 21.7% Anderson 16.7% Atchison 17.6% Barber 13.2% Barton 19.5% Bourbon 23.2% Brown 22.9% Butler 11.9% Chase 11.4% Chautauqua 20.5% Cherokee 23.1% Cheyenne 13.7% Clark 10.9% Clay 11.4% Cloud 17.1% Coffey 15.1% Comanche 12.9% Cowley 19.6% Crawford 20.3% Decatur 15.1% Dickinson 12.8% Doniphan 11.8% Douglas 9.5% Edwards 15.7% Elk 20.2% Ellis 10.6% Ellsworth 9.6% Finney 22.6% Ford 19.9% Franklin 18.3% Geary 10.4% Gove 10.4% Graham 12.4% Grant 17.6% Gray 13.9% Greeley 13.7% Greenwood 20.7% Hamilton 17.0% Harper 16.5% Harvey 14.5% Haskell 15.2% Hodgeman 9.1% Jackson 14.1% Jefferson 11.3% Jewell 12.8% Johnson 7.0% Kearny 15.7% Kingman 11.7% Kiowa 17.6% Labette 22.8% Lane 10.2% Lincoln 12.6% Linn 18.0% Logan 13.3% Lyon 17.2% Marion 12.5% Marshall 12.8% McPherson 11.6% Meade 13.8% Miami 12.1% Mitchell 11.9 Montgomery 22.7% Morris 13.1% Morton 15.9% Nemaha 10.2% Neosho 20.7% Ness 11.8% Norton 11.8% Osage 16.2% Osborne 13.0% Ottawa 12.0% Pawnee 12.2% Phillips 13.9% Pottawatomie 10.4% Pratt 15.9% Rawlins 14.5% Reno 17.9% Republic 14.6% Rice 15.6% Riley 6.0% Rooks 14.8% Rush 12.8% Russell 17.0% Saline 17.6% Scott 14.5% Sedgwick 18.2% Seward 24.1% Shawnee 19.1% Sheridan 8.8% Sherman 19.2% Smith 13.9% Stafford 15.4% Stanton 19.5% Stevens 14.3% Sumner 15.8% Thomas 12.1% Trego
10.4% Wabaunsee10.3%
Wallace 15.2% Washington 12.1% Wichita 12.5% Wilson 22.6% Woodson 19.2% Wyandotte 27.7% Leavenworth 9.7%
Figure 28. Trends in Sources of Coverage for Kansans, Age 0–64, 2008–2012
Per
cent of Kansans
Ag
e 0–64
14.2%
67.0%
14.7%
14.4%
63.7%
17.7%
9.9%
63.2%
17.5%
10.1%
62.4%
19.4%
9.4%
61.5%
20.3%
10.9% 10.3%
15.5% 14.3% 14.5%
0 10 20 30 40 50 60 70
Employment-Based Coverage
Individual Coverage Uninsured Public Coverage Type of Health Insurance
2008 2009 2010 2011 2012
Overview
Examining how insurance coverage in Kansas has changed since the passage of the Affordable Care Act in 2010 provides some insight into how the economy, job market and changes in federal and state health policy affect coverage. The timeframe for studying insurance coverage related to the
ACA is most relevant between 2008 and 2012. This section highlights selected trends in insurance coverage among non-elderly adults (age 19–64) and children (age 0–18) in Kansas, emphasizing the role played by public policy, poverty, employment and employment-based health insurance.
Kansans, Age 0–64
For Kansans under age 65, several trends in health insurance coverage have emerged during the last five years: • Fewer non-elderly adults and children in Kansas are covered by health insurance provided through an employer — 61.5 percent in 2012 compared to 67.0 percent in
2008 — as shown in Figure 28. Since 2001, there has been a continued decline in coverage by employers.
• While the uninsured rate for Kansas children dropped significantly from 9.3 percent in 2008 to 7.3 percent in 20127 (as
shown in Figure 30), the overall uninsured rate among non-elderly adults in Kansas has remained stable since 2008 (from 14.2 percent to 14.5 percent in 2012) as shown in Figure 28.
• The proportion of children covered by public health insurance since 2008 increased from 24.7 percent to 35.9 percent as shown
in Figure 30. The increase in public coverage for children corresponds with increased efforts to enroll children in Medicaid and CHIP and increasing the income threshold for CHIP to 238 percent of FPL.
• The rate of Kansans with individually purchased health insurance has been significantly lower since the
economic recession began in 2008, from 10.9 percent in 2008 to 9.4 percent in 2012, as shown in Figure 28.
Note: These estimates include respondents who reported multiple forms of insurance and percentages may not sum to 100 percent.
Source: KHI estimates are based on the 2008–2012 American Community Survey Public Use Microdata Sample.
Note: These estimates include respondents who reported multiple forms of insurance and percentages may not sum to 100 percent.
Source: KHI estimates are based on the 2008–2012 American Community Survey Public Use Microdata Sample.
Figure 29. Trends in Sources of Coverage for Kansas Adults, Age 19–64, 2008–2012
Figure 30. Trends in Sources of Coverage for Kansas Children, Age 0–18, 2008–2012
0 10 20 30 40 50 60 70 80
2008 2009 2010 2011 2012
Employment-Based Coverage
Individual Coverage Uninsured Public Coverage Type of Health Insurance
Per
cent of Kansas
Adults
Ag
e 19–64
Year
11.5%
69.3%
16.3%
12.4%
66.1%
17.0%
10.6%
64.7%
19.0%
11.0%
64.7%
17.9%
10.0%
64.9%
17.6%
10.3%
12.4% 12.0% 12.6% 13.4%
0 10 20 30 40 50 60 70
2008 2009 2010 2011 2012
Employment-Based Coverage
Individual Coverage Uninsured Public Coverage Type of Health Insurance
Per
cent of Kansas Childr
en
Ag
e 0–18
Year 9.3%
61.7%
24.7%
8.6%
58.4%
29.6%
7.8%
59.8%
29.4%
6.3%
57.3%
34.5%
7.3%
53.9%
35.9%
9.4% 8.3%
Role of Family Income
The trends in insurance coverage in Kansas between 2008 and 2012 are different for people of different ages and for families with different incomes. Public policy plays a part in these differences, as does employment status and insurance options. All of these factors affect the insurance coverage available to Kansas families and the affordability of that coverage.
For the approximately 360,000 Kansans living in families with incomes below 100 percent of FPL ($23,050 for a
family of four in 2012), differences in insurance coverage sources for adults and children during the last five years reflect the potential impact of policies in place.
For Kansas adults (age 19–64) with family income below 100 percent of FPL, the uninsured rate peaked in 2011 and has dropped to 39.6 percent in 2012 as shown in Figure 31. This drop in the rate of uninsured Kansans corresponds to increases in employer-based and public coverage. A possible explanation is the ACA’s provision allowing children to stay on their parent’s health insurance through their 26th birthday.
Figure 31. Coverage Trends for Kansas Adults, Age 19–64 with Family Incomes
Less Than 100 Percent of the Federal Poverty Level, 2008–2012
0 10 20 30 40 50
2008 2009 2010 2011 2012
Year
Per
cent of Kansas
Adults
Ag
e 19–64
Belo
w 100 P
er
cent FPL
Employer-Based Coverage Public Coverage Uninsured Individual Coverage Type of Health Insurance
39.6%
27.0% 27.7%
10.1%
44.7%
23.7% 25.4%
10.6%
44.5%
21.5% 26.9%
10.9%
42.2%
22.0% 28.2%
11.3%
41.4%
25.8% 25.4%
11.3%
COVERAGE TRENDS
There are few options for public health insurance for low-income adults under age 65 in Kansas today. Only parents in families with incomes below about 30 percent of FPL (about $6,900 for a family of four in 2012) are eligible for Medicaid, and childless adults are not eligible regardless of income unless they are disabled. In spite of the restrictive eligibility, public coverage rates for poor adults in Kansas during this five-year period increased — from 25.4 percent in 2008 to 27.7 percent in 2012 — as shown in Figure 31.8
Individually purchased coverage dropped from 11.3 percent in 2008 to 10.1 percent in 20129.
The uninsured rate of 11.0 percent for poor Kansas
children in 2012 is the lowest since 2008, as shown in Figure 32. This rate has been declining since the recession started in 2009, and may reflect the availability of public coverage for poor children.
Public coverage for poor children has increased from 64.4 percent to 79.2 percent since 2008. Employment-based insurance coverage for poor children decreased by almost a third, from 16.6 percent to 11.5 percent, as shown in Figure 32.
Figure 32. Coverage Trends for Kansas Children, Age 0–18 with Family Incomes Less Than 100 Percent of the
Federal Poverty Level, 2008–2012
0 10 20 30 40 50 60 70 80
2008 2009 2010 2011 2012
Year
Per
cent of Kansas Childr
en
Ag
e 0–18
Belo
w 100 P
er
cent FPL
11.0% 11.5% 79.2%
3.0%
11.5% 17.0% 74.2%
3.7%
15.6% 16.9% 68.4%
4.3%
16.6% 15.4% 68.1%
5.1%
19.2% 16.6% 64.4%
5.1%
Employment-Based Coverage
Individual Coverage Uninsured
Public Coverage Type of Health Insurance
Note: These estimates include respondents who reported multiple forms of insurance and percentages may not sum to 100 percent.
Role of Employment
Employment status and employer type are closely linked with whether Kansans are insured. During the last five years, insurance coverage has been quite varied for different types of employees. However, the overall likelihood of insurance coverage has not changed significantly between 2008 and 2012, as shown in Figure 33.
Non-elderly adults (age 19–64) who work for private employers have seen a slight decline in insurance coverage since 2008. The uninsured rate increased from 17.3 percent to 18.6 percent between 2008 and 2012.10 However, in the past
two years, the rate has declined from a high of 19.9 percent. In last year’s Annual Insurance Update, KHI reported that the greatest decline in insurance coverage included adults that worked for small private employers with fewer than 100 employees. There are conflicting trends in private employer coverage of health insurance that could change as the ACA
provisions are implemented. Small employers have been more likely to discontinue health insurance benefits to their employees in recent years because of higher insurance costs, irregular year-to-year cost increases and the burden of administering the employee benefit. Large employers continue to be more likely to offer health insurance to their employees in order to remain competitive in the labor market. However, for a variety of reasons — including the trend to pass on a larger share of the cost of health insurance to employees — more employees are opting out of insurance coverage even when it’s available.
Self-employed adults under age 65 are also slightly more likely to be uninsured in 2012 as they were in 2008 — 22.0 percent compared with 23.3 percent — in 2012 as shown in Figure 33.11
Government workers have experienced relatively stable levels of insurance coverage. In 2008, 5.8 percent of government workers were uninsured compared with 6.4 percent in 2012.
Figure 33. Kansas Adults, Age 19–64: Percent Uninsured by Employer Type, 2008–2012
0 5 10 15 20 25 30
Government Worker Self-Employed
Unemployed Full Year Employer Type
Private Employer
2008 2009 2010 2011 2012
Per
cent of Kansas
Adults
Ag
e 19–64
22.0%
17.3%
23.9% 21.1%
25.2%
23.3%
18.6% 18.4%
19.9% 18.3%
6.4% 6.4%
6.6% 3.6%
5.8%
22.2% 25.9%
19.9% 20.6%
23.5%
Types of Health Insurance
Coverage
As part of the American Community Survey (ACS), the U.S. Census Bureau collects data about the different types of health insurance coverage and broadly classifies those types as private coverage or public coverage.
Private health insurance is
coverage by a health plan provided through an employer or union, or purchased by an individual from a private health insurance company. Here’s how the U.S. Census Bureau defines the types of private coverage: • Employment-based
health insurance is coverage
offered through an individual’s or relative’s employment. It may be offered by an employer or by a union.
• Direct-purchase health insurance is coverage through a plan that an individual purchases from a private company.
This report refers to direct-purchase health insurance as other private insurance.
The major categories of
government, or public, health insurance are Medicare, Medicaid,
and the Children’s Health Insurance Program (CHIP).
• Medicare is the federal program
that helps pay health care costs for people age 65 and older and for certain people under age 65 with long-term disabilities. • Medicaid is a program
administered at the state level that provides medical assistance to the needy. Families with dependent children, the aged, blind and disabled who are in financial need may be eligible for Medicaid.
• CHIP is administered at the
state level, providing health care to low-income children who do not qualify for Medicaid.
Indian Health Service (IHS)
is a health care program offered through the U.S. Department of Health and Human Services which provides medical assistance to eligible American Indians at IHS facilities. In addition, the IHS helps pay the cost of selected health care services provided at non-IHS facilities. In this report, IHS coverage is included with those who lack traditional health insurance.
Military health care includes
TRICARE and CHAMPVA (Civilian Health and Medical Program of the Department of Veterans Affairs), as well as care provided by the U.S. Department of Veterans Affairs: • TRICARE is a military health
care program for active duty and retired members of the
uniformed services, their families and survivors.
• CHAMPVA is a medical
program through which the U.S. Department of Veterans Affairs helps pay the cost of medical services for eligible veterans, veterans’ dependents and survivors of veterans.
• The U.S. Department of Veterans Affairs provides
medical assistance to eligible veterans of the U.S. Armed Forces.
In this report, the term public insurance means coverage provided through government-sponsored health programs. This includes plans funded at the federal, state or local level. When public insurance is referred to within the Annual Insurance Update, it includes
Medicare, Medicaid, CHIP, and U.S. Department of Veterans Affairs coverage.
About the Data
The primary data source for this report was the American Community Survey (ACS). The ACS is an ongoing
nationwide survey sent to about 250,000 addresses per month. The survey form is followed with an in-person interview with a smaller number of households. Survey respondents are asked whether they have health insurance coverage at the time they are surveyed or interviewed.12
The survey results therefore represent point-in-time coverage for a large sample of individuals throughout the year. The 2012 ACS sample of non-institutionalized Kansas residents was 27,833 individuals.13 Because of the
ACS survey size, one year of ACS data can be used to generate estimates for counties or cities with populations of 65,000 or more. Three years of ACS data can be used to generate estimates for counties or cities with populations of 20,000 or more. The ACS started including basic health insurance questions in 2008, and does not provide consistent historical data prior to 2008 on health coverage (as the Current Population Survey (CPS) does)).
ACS Public Use Microdata Sample (PUMS)
The American Community Survey (ACS) Public Use Microdata Sample (PUMS) files are a set of records about individual people or housing units. The U.S. Census Bureau produces the PUMS files so that data users can create custom tables that are not available through summary ACS data products.14
Public Use Microdata Areas (PUMAs) are predefined areas with a population of 100,000 or more residents. PUMAs do not cross state borders and are established based on input from the U.S. Census Bureau’s State Data Centers. The U.S. Census Bureau produces one-year, three-year, and five-year ACS PUMS files. The three-year and five-year PUMS files are multiyear combinations of the one-year PUMS file with appropriate adjustments to the weights and inflation adjustment factors.
Small Area Health Insurance Estimates
In August 2012, the U.S. Census Bureau released estimates of health insurance coverage for every county in the United States for 2010. The Small Area Health Insurance Estimates (SAHIE) program models county-level insurance coverage by combining data from the 2010 U.S. Census and ACS data with administrative records from other sources, such as Medicaid and CHIP. Rather than using CPS data, as it had for past SAHIE estimates, the U.S. Census Bureau now uses ACS data because it allows for more detailed income group information as well as a higher level of precision in the county-level estimates.
Medical Expenditure Panel Survey —
Insurance Component
The federal Agency for Healthcare Research and Quality obtains data from the Medical Expenditure Panel Survey — Insurance Component (MEPS-IC), through a survey of employers about the number and types of health insurance plans they offer and eligibility requirements for those plans. This information was used in this report to determine the number of private employers of various sizes that offer health insurance coverage, the number of employees eligible for that coverage and the number of employees who enroll.
Current Population Survey
The Current Population Survey (CPS) is a monthly survey conducted by the U.S. Census Bureau for the Bureau of Labor Statistics to gather information on the labor force characteristics of the U.S. population. It samples the civilian non-institutionalized population living in the United States. Once a year, the U.S. Census Bureau expands the CPS and includes a questionnaire called the Annual Social and Economic Supplement (ASEC) that gathers additional information.
Statistical Significance
Using the Kansas ACS data, KHI estimated and compared the percentages of uninsured Kansans across time and by subgroups of interest (such as age groups). We also examined the percentages of Kansans with various forms of private and public insurance. The observed differences in the percentages were not necessarily statistically different, particularly when there was a small number of Kansans from a particular group of interest represented in the survey. Therefore, we used statistical tests that take into account the number of people in each group and the variability in the data. Differences specifically noted in the text are statistically significant at the p<0.05 level.
Other differences between various numbers in the report may or may not be statistically significant, so caution should be used in interpreting them.
Quick Facts
The Annual Insurance Update is a comprehensive review of available data about health insurance coverage for Kansans. The Quick Facts section (page 27–32) includes supplementary information about terms used to describe age, employment and poverty categories in the report. Also included are detailed tables with the population estimates used to develop the charts and figures included throughout the Annual Insurance Update.
Source: Federal Register (2012, January 26). Volume 77, Number 17, pp. 4034-4035.
Figure A-1. Federal Poverty Guidelines for 48 Contiguous United States, District of Columbia,
Guam and Territories, 2012
Household Size Annual Income Monthly Income Weekly Income
1 $11,170 $931 $215
2 $15,130 $1,261 $291
3 $19,090 $1,591 $367
4 $23,050 $1,921 $443
5 $27,010 $2,251 $519
6 $30,970 $2,581 $596
7 $34,930 $2,911 $672
8 $38,890 $3,241 $748
For each additional
Quick Facts
Figure A-2. All Kansans: Age, 2012
Age UninsuredNumber PopulationTotal Percent of Group (Uninsured) Percent of Total Uninsured Population Children,
Age 0–18 56,028 762,403 7.3% 15.6%
Age 0–5 12,016 244,346 4.9% 3.4%
Age 6–18 44,012 518,057 8.5% 12.3%
Adults,
Age 19–64 301,384 1,708,655 17.6% 84.0%
Age 19–25 65,242 292,778 22.3% 18.2%
Age 26–34 84,932 339,753 25.0% 23.7%
Age 35–44 66,953 343,754 19.5% 18.7%
Age 45–54 50,181 384,558 13.0% 14.0%
Age 55–64 34,076 347,812 9.8% 9.5%
Seniors, Age 65+ 1,179 373,329 0.3% 0.3% All Kansans 358,591 2,844,387 12.6% 100.0%
Note: Percentages and counts for subgroups may not sum to the totals because of rounding.
Source: KHI estimates are based on the 2012 American Community Survey Public Use Microdata Sample.
Figure A-3. All Kansans: Race/Ethnicity, 2012
Race/
Ethnicity UninsuredNumber PopulationTotal Percent of Group (Uninsured)
Percent of Total Uninsured Population
White
Non-Hispanic 219,487 2,207,757 9.9% 61.2%
Hispanic Any Race 87,816 311,762 28.2% 24.5%
Black or
African American
Non-Hispanic 23,485 156,814 15.0% 6.5%
Other/Multiple Races
Non-Hispanic 27,803 168,054 16.5% 7.8%
All Kansans 358,591 2,844,387 12.6% 100.0%
Figure A-4. All Kansans: Poverty Category, 2012
Poverty (income-to-poverty
ratio)
Number
Uninsured PopulationTotal Percent of Group (Uninsured)
Percent of Total Uninsured Population
Less Than 100% FPL 102,879 383,991 26.8% 29.1%
100%–199% FPL 114,504 527,457 21.7% 32.3%
200%–299% FPL 69,154 536,937 12.9% 19.5%
300%–399% FPL 33,032 410,947 8.0% 9.3%
400% FPL or More 34,511 943,101 3.7% 9.7%
All Kansans 354,080 2,802,433 12.6% 100.0%
Note: Percentages and counts for subgroups may not sum to the totals because of rounding.
Source: KHI estimates are based on the 2012 1-Year American Community Survey Public Use Microdata Sample.
Figure A-5. All Kansans: Gender, 2012
Gender UninsuredNumber PopulationTotal Percent of Group (Uninsured) Percent of Total Uninsured Population
Female 167,399 1,430,007 11.7% 45.9%
Age 0-18 30,429 376,421 8.1% 8.3%
Age 19-64 136,684 833,530 16.4% 37.4%
Male 197,658 1,362,030 14.5% 54.1%
Age 0-18 36,423 381,416 9.5% 10.0%
Age 19-64 161,236 808,229 19.9% 44.2%
All Kansans 365,057 2,792,037 13.1% 100.0%
Note: Percentages and counts for subgroups may not sum to the totals because of rounding.
Source: KHI estimates are two-year averages based on the 2010 and 2011 Annual Social and Economic Supplements to the Current Population Surveys.
Note: Percentages and counts for subgroups may not sum to the totals because of rounding.
Figure A-6. Kansas Adults, Age 19–64: Poverty Category, 2012
Poverty (income-to- poverty ratio)
Number
Uninsured PopulationTotal Percent of Group (Uninsured)
Percent of Total Uninsured Population,
Age 19–64
Less Than 100% FPL 87,235 220,361 39.6% 29.2%
100%–199% FPL 95,072 271,622 35.0% 31.8%
200%–299% FPL 60,397 314,883 19.2% 20.2%
300%–399% FPL 27,969 244,200 11.5% 9.3%
400% FPL or More 28,520 633,283 4.5% 9.5%
All Kansas Adults,
Age 19–64 299,193 1,684,349 17.8% 100.0%
Quick Facts
Figure A-7. Kansas Adults, Age 19–64: Race/Ethnicity, 2012
Race/
Ethnicity UninsuredNumber PopulationTotal Percent of Group (Uninsured)
Percent of Total Uninsured Population,
Age 19–64
White,
Non-Hispanic 185,713 1,343,497 13.8% 61.6%
Hispanic Any Race 73,398 172,828 42.5% 24.4%
Black or
African American
Non-Hispanic 20,355 95,402 21.3% 6.8%
Other/Multiple Races
Non-Hispanic 21,918 96,928 22.6% 7.3%
All Kansas Adults,
Age 19–64 301,384 1,708,655 17.6% 100.0%
Note: Percentages and counts for subgroups may not sum to the totals because of rounding.
Source: KHI estimates are based on the 2012 American Community Survey Public Use Microdata Sample.
APPENDIX
Figure A-8. Kansas Adults, Age 19–64: Employment Status, 2012
Employment
Status UninsuredNumber PopulationTotal Percent of Group (Uninsured)
Percent of Total Uninsured Population,
Age 19–64
Full-Time, Year-Round 110,855 953,815 11.6% 36.8%
Full-Time, Part-Year 32,154 133,903 24.0% 10.7%
Part-Time, Year-Round 51,899 177,298 29.3% 17.2%
Part-Time, Part-Year 41,654 152,170 27.4% 13.8%
Not Employed 64,822 291,469 22.2% 21.5%
All Kansas Adults,
Age 19–64 301,384 1,708,655 17.6% 100.0%
Figure A-9. Kansas Adults, Age 19–64: Employer Type and Size, 2012
Employer Type and Size UninsuredNumber PopulationTotal Percent of Group (Uninsured) Uninsured Population, Percent of Total Age 19–64
Private Employer 191,327 1,030,339 18.6% 63.5%
Government Employer 16,902 265,357 6.4% 5.6%
Self-employed 28,333 121,490 23.3% 9.4%
Not Employed 64,822 291,469 22.2% 21.5%
All Kansas Adults,
Age 19–64 301,384 1,708,655 17.6% 100.0%
Note: Percentages and counts for subgroups may not sum to the totals because of rounding.
Source: KHI estimates are based on the 2012 American Community Survey Public Use Microdata Sample.
Note: Percentages and counts for subgroups may not sum to the totals because of rounding.
Figure A-11. Kansas Children, Age 0–18: Poverty Category, 2012
Poverty (income-to-poverty
ratio)
Number
Uninsured PopulationTotal Percent of Group (Uninsured)
Percent of Total Uninsured Population,
Age 0–18
Less Than 100% FPL 15,229 138,540 11.0% 28.4%
100%–199% FPL 19,113 166,267 11.5% 35.6%
200%–299% FPL 8,608 148,796 5.8% 16.0%
300%–399% FPL 5,063 110,607 4.6% 9.4%
400% FPL or More 5,695 180,545 3.2% 10.6%
All Kansas Children,
Age 0–18 53,708 744,755 7.2% 100.0%
Quick Facts
Figure A-10. Kansas Children, Age 0–18: Race/Ethnicity, 2012
Race/
Ethnicity UninsuredNumber PopulationTotal Percent of Group (Uninsured)
Percent of Total Uninsured Population,
Age 0–18
Hispanic, Any Race 14,227 130,296 10.9% 25.4%
White,
Non-Hispanic 32,976 522,341 6.3% 58.9%
Black or African American
Non-Hispanic 3,130 48,653 6.4% 5.6%
Other/Multiple Races,
Non-Hispanic 5,695 61,113 9.3% 10.2%
All Kansas Children,
Age 0–18 56,028 762,403 7.3% 100.0%
Note: Percentages and counts for subgroups may not sum to the totals because of rounding.
Source: KHI estimates are based on the 2012 American Community Survey Public Use Microdata Sample.
Note: Percentages and counts for subgroups may not sum to the totals because of rounding.
Glossary
Age
Children:
People age 0–18.
Non-Elderly Adults:
People age 19–64.
Seniors:
People age 65 or older.
Employment
Full-time Worker:
Works 35 hours or more per week, not
necessarily for one employer. May work year- round or only part of the year.
Part-time Worker:
Works fewer than 35 hours per week. May work year-round or only part of the year.
Federal Poverty Level:
The Federal Poverty Level (FPL), also called the poverty line, is an income threshold that designates which individuals or families are considered poor by the federal government. In this report, family income relative to the FPL is determined using the official U.S. Census Bureau poverty thresholds that correspond to the survey year. The Federal Poverty Guidelines (Figure A-1) are a simplification of the U.S. Census Bureau’s poverty thresholds.
Income Poor:
Family income below 100 percent of FPL. For a family of four in 2012, it translates to gross annual income of less than $23,050.
Low-Income:
Family income between 100 percent and 199 percent of FPL. For a family of four in 2012, it translates to gross annual income between $23,050 and $46,100.
Middle-Income:
Family income between 200 percent and 400 percent of FPL. For a family of four in 2012, it translates to gross annual income between $46,100 and $92,200.