15
Lending Margin ( A ) ・・・「Interest Spread」
+ Interest Income
− Interest Expense
Other Revenue ( B )
Fees and Commission Income, Trading Income, Trust Fees, Other Business Income, Gains on Investment of Money Held in Trust, Other Operating Income, Extraordinary Gains ( Excluding Gains on Disposal of Premises and Equipment ) Fees and Commission Expenses, Trading Expenses, Other Business Expenses, Losses on Investment of Money Held in Trust
Extraordinary Losses ( Excluding Losses on Disposal of Premises and Equipment )
Gross Profit ( C ) = ( A ) + ( B )
− Operating Costs ( d )
Personnel Expenses, Facilities ( Including Deposit Insuranse Premiums ), Taxses and Public Dues
Net Operating Profit before Loan Loss ( E ) = ( C ) - ( d )
− Loan Loss ( f )
Provision for General Reserves for Loan Losses, Loan Charge-off, Other Operating Expenses
Net Operating Profit ( G ) = ( E ) - ( f )
+ Realized Capital Gains ( H )
+ Gains on Sales of Seculities, Gains on Disposal of Premises and Equipment
− Losses on Sales of Seculities, Losses on Impairment, Losses on Disposal of Premises and Equipment
Net Profit ( I ) = ( G ) + ( H )
+
−
The Profitability of Banks and the Lending Market
1. Introduction
Japanese banks had a very troubled period after the burst of the economic bubble with the bad loans that ensued in the beginning of the 1990s. By fiscal 2004, the major banks were able to meet their targets of reducing the ratio of their bad loans to half of that of fiscal 2001. As the heavy burden of the bad loans has been somewhat lifted, banks are now working towards the longer-term goal of recovering their profitability, and looking ahead and defining new goals. In this Chapter, we analyze the banks’ financial statements for fiscal 2004 (ending March 31 2005) and examine the banks from the perspectives of profits, bad loans, and capital adequacy. Then, we analyze the lending market to understand the current situation of the lending business – their core sources of profit -- and the banks’ measures towards meeting their new goals of improving profitability.
2. Profit structure of Banks
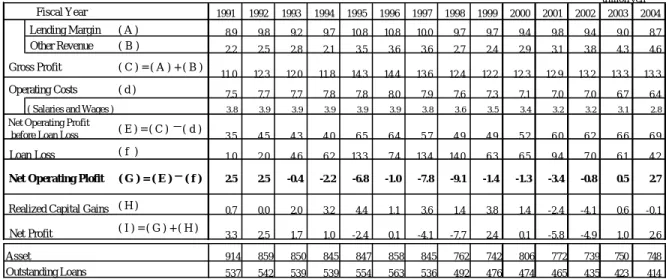
To examine the profit structure of banks, we categorize some main income and expense items from their income statements as shown in Figure 2.1. In this exercise, the most important indicator representing their profits from their core business is Net Operating Profit.
Figure 2.1 Banks’ Profit Structure
Note: “Other Operating Expenses” were included in our definition of ( f ) Loan Loss because this item includes losses on sales of loans and “Losses for Supported of Specific Borrowers” that can be considered Loan Loss.
16
trillion yen 1991 1992 1993 1994 1995 1996 1997 1998 1999 2000 2001 2002 2003 2004
Lending Margin ( A ) 8.9 9.8 9.2 9.7 10.8 10.8 10.0 9.7 9.7 9.4 9.8 9.4 9.0 8.7
Other Revenue ( B ) 2.2 2.5 2.8 2.1 3.5 3.6 3.6 2.7 2.4 2.9 3.1 3.8 4.3 4.6
Gross Profit ( C ) = ( A ) + ( B )
11.0 12.3 12.0 11.8 14.3 14.4 13.6 12.4 12.2 12.3 12.9 13.2 13.3 13.3
Operating Costs ( d ) 7.5 7.7 7.7 7.8 7.8 8.0 7.9 7.6 7.3 7.1 7.0 7.0 6.7 6.4
( Salaries and Wages ) 3.8 3.9 3.9 3.9 3.9 3.9 3.8 3.6 3.5 3.4 3.2 3.2 3.1 2.8
( E ) = ( C ) −( d )
3.5 4.5 4.3 4.0 6.5 6.4 5.7 4.9 4.9 5.2 6.0 6.2 6.6 6.9
Loan Loss ( f ) 1.0 2.0 4.6 6.2 13.3 7.4 13.4 14.0 6.3 6.5 9.4 7.0 6.1 4.2
Net Operating Plofit ( G ) = ( E ) −( f ) 2.5 2.5 -0.4 -2.2 -6.8 -1.0 -7.8 -9.1 -1.4 -1.3 -3.4 -0.8 0.5 2.7
Realized Capital Gains ( H ) 0.7 0.0 2.0 3.2 4.4 1.1 3.6 1.4 3.8 1.4 -2.4 -4.1 0.6 -0.1
Net Profit ( I ) = ( G ) + ( H ) 3.3 2.5 1.7 1.0 -2.4 0.1 -4.1 -7.7 2.4 0.1 -5.8 -4.9 1.0 2.6
Asset 914 859 850 845 847 858 845 762 742 806 772 739 750 748
Outstanding Loans 537 542 539 539 554 563 536 492 476 474 465 435 423 414
Fiscal Year
Net Operating Profit before Loan Loss
Figures calculated using the definitions of Figure 2.1 are in Table 2.1. Compared to the previous fiscal year, the Net Operating Profit for fiscal 2004 has increased sharply. The main factor is that though Gross Profit has remained flat, expenses have been reduced. Although the economy has been in an environment of improving corporate profits, there has been no growth in Gross Profit because the Lending Margin has been declining. However, this has been being compensated for in the increase in Other Revenue. Moreover, Loan Loss, which had been a large expense item, has fallen off sharply. Therefore, the marked improvement in the profits of banks has been due to mainly the increase in Other Revenue and the reduction in Loan Loss.
Table 2.1 Profit Structure of Banks ( All Banks )
Notes: 1) Included in this data were data for a total of 129 banks comprised of: 7 city banks, 2 long-term credit banks, 8 trust banks, 64 regional banks and 48 second regional banks. Foreign banks were not included. Also, the figures used in this exercise were for the non-consolidated banks.
2) In order to correct for changes in accounting standards, we deducted deferred tax assets from total assets, and deducted allowances for loan losses that were recorded on the asset side, from fiscal 2000.
Sources: “Corporate Finance Data Base” NEEDS-Financial QUEST, “Financial Statements of all Banks”, Japanese Bankers Association
With closer examination, we see that the increase in Other Revenue is largely in Fees and Commission Profit. However, some of the other components of Other Revenue that are more affected by market factors appear to be falling, reflecting the market trends. Another large component in the figures is Extraordinary Gains and Losses. We observe here that of these gains and losses, the gains from the reversal from loan loss reserves, and recovered loans that were written off account for 64% of the total. Thus the main reasons that the Other Revenue showed strength as well are largely due to bad loan related items.
We need to be mindful that there is some ambiguity in this purported reduction of Loan Loss. In fact, if we examine factors contributing negatively to Realized Capital Gain, we find that the Losses
17
on Write-downs of Stocks and Other Securities account are notable. We believe this was due to impairment losses arising from the preferred shares bought in the past (as a means of providing financial support to banks ’ major customers). Therefore, we consider this similar in nature to a cost incurred from a bad loan. If we readjust these figures and move all the bad loan related items to the Loan Loss account, then the Other Revenue in fiscal 2004 falls to 3.9 trillion yen, and Net Operating Profit falls to 1.9 trillion yen and the recovery then does not look as impressive as it once did. We conclude that the current improvement in profits is led by factors that are only temporary. The fact that the main source of profits – the Lending Margin – is shrinking will be a great weight on profits if it continues.
What will also have huge effects on the banking world in the future will be the effects of the privatization of the postal system. As the privatization of Japan Post is scheduled to go ahead and will we soon see the birth of Japan’s Postal Savings Bank, then by the sheer size of this giant, it will surely have some effects on banking profits.
Under the current structure of the Public Corporation, the postal savings division is restricted in the types of business it can conduct. In the transition period immediately after privatization, the new areas of business that the bank can enter into will also be restricted to some degree. However, there are areas that the bank can enter into immediately and other areas of business the postal bank can enter with the nod of the government. Moreover, Japan Post has already begun to sell investment trusts over their counters in October 2005 ahead of the formal privatization. This is an area that has consistently grown over the past few years and one of the few businesses with continuing growth potential that the banks have been competing to strengthen. This income is reflected in the growth in the banks’ Fees and Commissions Profit and is in contrast with the decline in Lending Margin. As postal privatization proceeds, the growth of the banks’ Fees and Commissions income will be threatened, and it becomes imperative for the banks to be able to increase the Lending Margin in their lending business.
3. Bad Loans as in Mar 2005
Bad loans are defined as those loans and bills discounted in the banks’ and other financial institutions’ loan portfolios whose payments on interest and/or principal are past due or are likely to become past due. In Japan, there are three definitions of bad loans of which one refers to those disclosed under the Financial Revitalization Law and covers all types of credits. Under this, and depending on the situation of the loan, they are categorized into three types of loans: loans that are “unrecoverable or valueless”, “doubtful” and those “in need of special caution”. Outstanding loans disclosed under the Financial Revitalization Law in Mar 2005 for all banks totaled 17.9 trillion yen, a figure reduced by a massive 8.7 trillion yen over Mar 2004 (Figure 2.2). This is due to the improved business conditions of borrowers under a recovering economy, healthier loans under the financial reconstruction of corporations, and also to loans being taken off balance sheet.
By type of bank, we observe that the improvement in city banks is particularly impressive. The government had stated that under the Financial Revitalization Program in 2002, the major banks in
18
Japan should reduce their bad loan ratios of the end of Mar 2002 to half by the end of Mar 2005. All banks were able to reach this target. Bad loans have been dramatically reduced as banks
worked to achieve this target by aggressively disposing of bad loans, and by avoiding new problem loans as the economy has been recovering. However, we must not lose sight of the fact that amongst the major banks, some are healthier than others, and if we look at the regional banks, their progress has been much slower.
Figure 2.2 Bad Loans disclosed under the Financial Revitalization Law (All banks)
0 5 10 15 20 25 30 35 40 45 50
Mar-99 Mar-00 Mar-01 Mra-02 Mar-03 Mar-04 Mar-05
trillions yen
Loans in Need of Special Caution Doubtful Loans
Unrecoverable or Valueless Loans
Note: This excludes financial institutions that have already declared bankruptcy, and includes the loans transferred to subsidiaries specializing in corporate revitalization of the banks in the Mizuho Group, UFJ Bank, Hokuriku Bank and Nishi Nippon City Bank.
Source: “Loans Disclosed under the Financial Revitalization Law”, Financial Services Agency
4. Banks and Capital Adequacy
4.1
Estimating “Real” Capital Adequacy Ratios
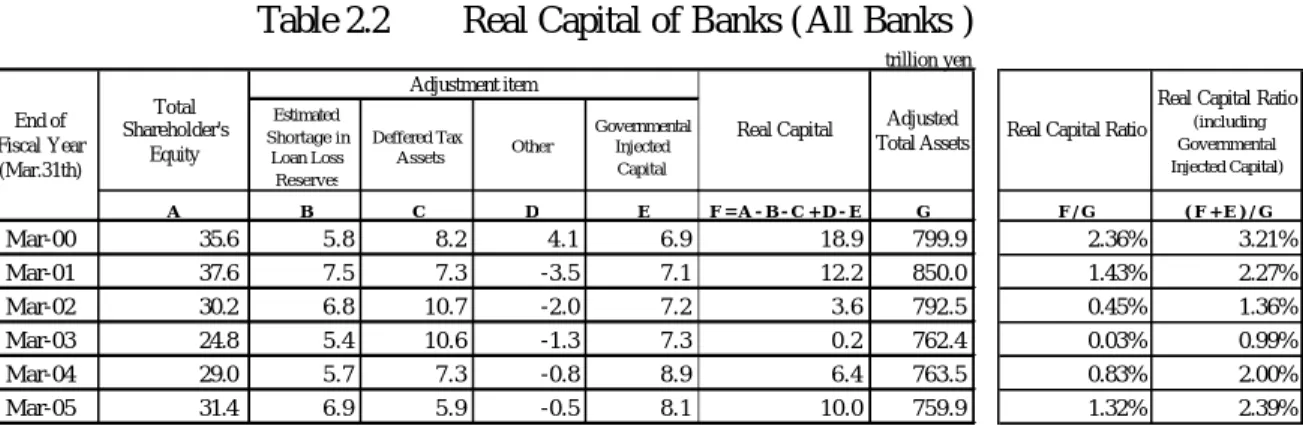
To find the value of “real” capital, we focus on the liquidation value of the banks and take the Capital portion of the balance sheet and adjust the figure for the following: 1) any shortages in allowances for loan losses -- the difference between stringently assessed bad loans that need to be disposed of and the actual allowance for loan losses that were reserved, 2) deferred tax assets and 3) other items that require adjustment. Here, to meet our definition of real capital, we also deduct the preferred shares issued for public funds because one of the limitations to the preferred shares issued for public funds is that if these are converted to common stock and cannot be sold in the market, then they must be bought back. Thus we feel this lacks in the “permanence” that is required in the nature of capital, and so this is not included in real capital. As the value of real capital indicates the liquidation value of Banks, if this figure is negative, then the bank is in a real excess debt position. We also find below, the real capital ratio -- that is, the real capital divided by the adjusted total assets. The real capital ratio we find here will be much lower than the BIS capital ratio because unlike the BIS figures, there are no supplementary items in the numerator, and because the denominator – the assets – have not been risk-weighted.
19
trillion yen
Estimated Shortage in
Loan Loss Reserves
Deffered Tax
Assets Other
Governmental Injected Capital
A B C D E F = A - B - C + D - E G F / G ( F + E ) / G Mar-00 35.6 5.8 8.2 4.1 6.9 18.9 799.9 2.36% 3.21% Mar-01 37.6 7.5 7.3 -3.5 7.1 12.2 850.0 1.43% 2.27% Mar-02 30.2 6.8 10.7 -2.0 7.2 3.6 792.5 0.45% 1.36% Mar-03 24.8 5.4 10.6 -1.3 7.3 0.2 762.4 0.03% 0.99% Mar-04 29.0 5.7 7.3 -0.8 8.9 6.4 763.5 0.83% 2.00% Mar-05 31.4 6.9 5.9 -0.5 8.1 10.0 759.9 1.32% 2.39%
Real Capital Ratio
Real Capital Ratio
(including Governmental Injected Capital)
Adjustment item Total
Shareholder's Equity
Real Capital Adjusted Total Assets End of
Fiscal Year (Mar.31th)
The real capital adequacy ratios on an all-bank basis are as shown in Table 2.2. The real capital adequacy ratios here (not including public funds) fell to 0.03% as in Mar 2003, but has improved to 1.32% by Mar 2005. Comparing the two real capital ratios with and without the public funds, the difference was 1.17 percentage points in Mar 2004, but by Mar 2005, the difference had shrunk to 1.07 percentage points. This is due to the fact that the banks are paying back the funds from the government, and no new public funds are being injected. This improvement in the ratio would suggest that banks have improved their way out of the crisis situation in which they found themselves in the past. However if we look at individual banks, we do see that another 15 banks still have negative real capital ratios (excluding public funds). Though the banks may be out of a critical situation, the levels of capital are still too low to adequately support the banks as they embark on new business development.
Table 2.2 Real Capital of Banks ( All Banks )
Notes: 1) Banks included in this analysis are the same as in Table 2.1.
2) Real capital = Total Shareholder’s Equity – Estimated shortages loan loss Reserves – Deferred Tax Assets + Others – Governmental Injected Capital
Estimated Shortage Loan Loss Reserves = Amount of loan loss reserves necessary – allowance for bad loans
Amount of Loan loss reserves necessary = 1% × Type I loans + 20% × Type II loans + 70% × Type III loans + 100% × Type IV loans
Type I to IV loans = loans classified by self-assessment
Other = (Unrealized gains on available-for-sale securities – Deferred Tax Liabilities) + Unrealized gains/losses on derivatives – Revaluation Reserve for Land
3) Adjusted total assets = Total assets + portion of trust with contract for replacement of losses – deferred tax assets + allowance for bad loans + Unrealized gains on available-for-sale securities (market value entry not applicable)
Source: “Corporate Finance Database” NEEDS-Financial QUEST “Annual Report” Deposit Insurance Corporation of Japan, Disclosure material and Financial Statements of individual banks “Financial Statements of all Banks”, Japanese Bankers Association
20 -4%
-2%
0% 2% 4% 6%
AA A BBB BB B CCC-C D
Actual lending rate
Appropriate rate
Actual lending rate - Appropriate rate
4.2
Issues with the New BIS Regulations
In June 2004, new regulations pertaining to capital adequacy ratios (new BIS regulations) to take effect from fiscal 2006 were released by the Basel Committee on Banking Supervision. A major change in the new rules is that the way that the risk assets (the denominator of the capital adequacy ratio) are calculated is much more detailed. However, a major issue with the new formula is that the ambiguity in the definition of capital (the numerator of the capital adequacy ratio) – has not been revised at all.
A bigger issue and more critical matter is the direction that this reform appears to be taking. Expected Losses (EL) should not be covered for by capital – a stock figure – but by a flow indicator – i.e., profits in each period. Capital – a stock indicator -- should be accumulated to deal with unexpected losses (UL). By this logic, under the standard approach, risk should not be weighted by the rating of the entity as this includes expected loss. And under the internal ratings based approach, the issue is that expected losses will be linked with allowances -- that is a stock, rather than a flow. The direction of the new rules should not be to make the calculations to find the risk assets overly complicated. They should be taking into account the stock and flow considerations and finding the appropriate measures to insure stability under the different losses.
5. Analysis of the Lending Market
5.1
Current Lending Market
In our examination of profitability in Section 2, we found net interest income continues to decline. This can be the result of either a shrinking interest spread or a decline in the amount of outstanding loans (or both). The fact that Japanese banks have not been able to secure the interest spreads commensurate with the credit risk of the borrower has been an outstanding issue for a long time. This issue is yet to be resolved because as we see in the fiscal year 2004 individual data, banks are still not receiving the interest spreads aligned with the credit risk (Figure 2.3). At the same time, we see that the amount of loans outstanding have continued to be on a declining trend since the middle of the 1990s. (Figure 2.4)
Figure 2.3 Appropriate Spread by Risk Rating (All Industries, FY 2004)
21 0
40 80 120
1970 75 80 85 90 95 2000 05
Calendar Year/Quarter %
25 30 35 40 45 50
1980.1Q 82.3Q 85.1Q 87.3Q 90.1Q 92.3Q 95.1Q 97.3Q 2000.1Q 02.3Q 05.1Q
%
-4 -3 -2 -1 0 1 2 3 4 5
Calendar year
% Interest bearing
liability ratio ( left scale )
Free cash flow as a share of nominal GDP ( right scale )
Table 2.4
Outstanding Loans of All Banks (as a Share of GDP)
Notes: GDP is on a 68 SNA basis up to October-December of 1979, and from January-March of 1980, it is on a 93 SNA basis.
Sources: “Economic and Financial Data” “Financial and Economic Statistics Monthly” Bank of Japan “Estimates of GDP” Cabinet Office
5.2 Factors leading to declining loans
(1) Factors on the lending side 1) Bad loan problem
2) Capital adequacy ratio regulations
It is likely that the serious bad loan issue led to banks becoming very stringent regarding their lending attitudes. To write off the bad loan problem in their portfolios, the banks were using their unrealized gains on their stock market holdings (ekidashi) for capital -- as they were permitted to do, but even so it was becoming progressively difficult to maintain their capital adequacy. Therefore, they then began reducing their credit risk assets, an example of which would be the lending. This resulted in a more stringent lending attitude towards lending to corporations with a high credit risk. (2) Factors on the borrowing side
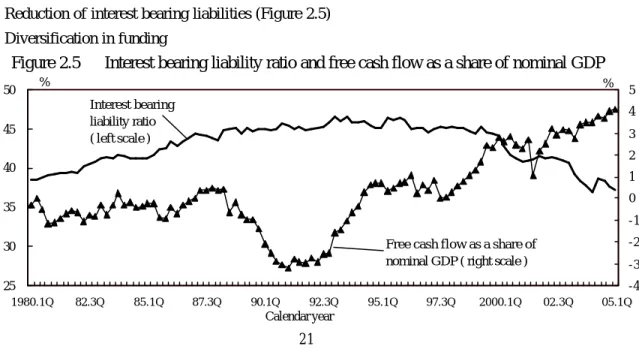
Decline in demand for funds due to stagnant economy Reduction of interest bearing liabilities (Figure 2.5) Diversification in funding
22
Notes: 1) Free cash flow = (ordinary profit × 0.5 + depreciation – capital investment) (0.5 is an adjustment coefficient representing the effective tax rate)
2) Interest bearing liability ratio = (long and short term borrowing + corporate bonds) / total assets 3) Figures are seasonally adjusted
4) We did not correct for the effects of the changes in the sample companies in the corporate financial statement data
Sources: “Financial Statements Statistics of Corporations”、Ministry of Finance “Estimates of GDP” Cabinet Office
After the burst of the economic bubble, the Japanese economy entered into a serious recession. With a prolonged economic stagnation and the heavy burden of payments on interest bearing liabilities that had ballooned during the bubble, the demand for funds decreased dramatically. Japanese corporations have been trying to reduce their interest-bearing liabilities by increasing their cash flow. This has continued into this decade. At the same time, corporations are diversifying their funding sources and are funding more efficiently through establishing a committed line of credit, and also gradually increasing their direct funding from the capital markets by issuing bonds. It is due to these market trends that the funding demand of corporation has been lackluster.
5.3 Quantitative analysis of determinants of trends in the lending market
We conducted an empirical analysis of panel data to see if the two variables, bad loan ratios or capital adequacy ratios were determinants in the amount of loans outstanding. The equation we used is as follows, while the results are shown in Table 2.3.
Change in amount lent over previous year =α+
ß1 capital adequacy ratio indicatorit+ß2 regional bank dummy × capital adequacy ratio indicatorit +?1 bad loan ratio indicatorit+?2 regional bank dummy × bad loan ratio indicatorit
+δmacroeconomic factorit+error termit
Results showed that first, for the ratio of bad loans, the coefficient was significant and its sign was consistent with the theory for all industries. By bank type, the effect of the bad loan ratios on lending amount was smaller for the regional banks than for the city banks. We believe this is due in part to the relationship banking policy of regional banks – encouraged by the government – that when taking into consideration relationship with the borrowing corporate, does not permit them to dispose of their problem loans quite as dramatically. Thus the effect on the lending amount is lower.
As for the capital adequacy ratios, we were not able to get a statistically significant result and the sign on the coefficient was often inconsistent with our expectations. In our estimates we used our real capital adequacy ratios, and then we re-estimated using the BIS capital adequacy ratios, but there was no great difference in the results. If we take this result at face value, it would suggest that the banks’ capital adequacy ratios have no effect on the banks’ lending, and it is possible that banks
23
are lending without consideration of the health of their financial statements. Also the capital adequacy ratios can be enhanced by other means such as by issuing subordinated debt and the fact that capital adequacy is somewhat arbitrary may have also contributed to this result.
Table 2.3 Results of Estimation
1) Results for the Capital Adequacy Ratio (Real Capital Base) VariableCity Banks Regional Banks
Capital Adequacy
Ratio Indicator t statistic
Capital Adequacy Ratio Indicator
Regional Bank Coefficient Dummy
t statistic of Coefficient Dummy Total Lending -0.009 -0.885 -0.006 0.003 0.275 To Manufacturers -0.032** -2.175 -0.012 0.019 1.274 To Non-manufacturers -0.006 -0.465 0.002 0.009 0.615
2) Results for the Ratios of Bad Loans Variable
City Banks Regional Banks
Ratio of Bad loan
Indicator t statistic
Ratio of Bad loan Indicator
Regional Bank Coefficient Dummy
t statistic of Coefficient Dummy Total Lending -1.134** -5.087 -0.246** 0.888** 4.373 To Manufacturers -1.147** -3.884 -0.391** 0.756** 2.838 To Non-manufacturers -1.118** -3.334 -0.220** 0.898** 2.924
Note: The terms on the indicators for the regional banks were found by multiplying the individual indicators of the City Banks with the Regional Bank coefficient dummy.
** denotes statistical significance at the 5% level
5.4 Securing Profitability in the Lending Market
We have analyzed the lending market under this environment of declining net interest incomes for banks. We can expect a recovery in the lending amount with the upturn in the economy and the banks no longer at a critic al stage in their bad loans. However, interest spreads will continue to be an issue in the future.
In order to recover their profitability, banks are now strengthening their non-interest income, such as fee revenue. Yet, the role of net interest income in banks’ profits continues to be large for Japanese banks, and without the ability to secure interest spreads aligned with the credit risk of the borrower, the improvement in the banks’ profitability is not a true recovery. Moreover, if banks had been able to earn interest spreads in accordance with the risk in the first place, the bad loan issue would never have become the crisis it was.
24
lending in the market. These are syndicated loans from perspective of risk diversification, and real estate non-recourse loans and unsecured business loans from the perspec tive of banks trying to move away from collateralized loans. The syndicated loan market is growing year by year, and is now available to medium and small enterprises. Syndicated loans differ from the traditional bilateral type lending as there is an underlying assumption that these loans can be transferred, and the lending banks can change the composition of their loan portfolios by buying and selling loans. In this way, banks can avoid portfolios that are weighted too heavily in a particular industry or region. However, currently the secondary market for these loans is still not adequately developed.
The real estate non-recourse loans are repaid only by the cash flow originating from the source of the repayment. In other words, in the case of default, the applicable piece of collateral – in this case the real estate -- would be the only asset that the bank would have claims on and non on the business of the borrower itself. Banks would take only the applicable real estate as collateral, and assessment of credit would be done with an emphasis on cash flow. With the unsecured business loans, appropriate spreads can be set as credit can be assessed quickly through an assessment method called the credit-scoring model using statistical analysis and since it is unsecured, the borrower can enjoy other benefits aside from the interest.
One thing we can say for certain about these new forms of lending is that in order for them to be further expanded in Japan, the ability to earn interest spreads aligned with the credit risk is imperative. If banks are not able to secure the appropriate spreads for the credit risk assumed, then there will be no buyers in this market of secondary loans and this market will not develop in the future. Moreover if the interest earned is not sufficient to cover for the losses in the event of default, then bad loans could again become a serious problem. To prevent subjecting the banks to bad loans again, banks must secure the interest spreads appropriate with the credit risk so that these new forms of lending can be better developed. The timing is ripe now for this to take place as banks are beginning to have a full-fledged improvement in their profitability.
6. In Conclusion
In this study, we looked at the financial statements for fiscal 2004 and analyzed the banks’ profit structure, the bad loans issue, the capital adequacy situation and the lending market. The problems we have identified in this chapter are as follows.
First, there is the issue of their profitability. In fiscal 2004, the Japanese banks’ growth in Other Revenue, reduction in costs, and dramatic decrease in the burden of bad loans led to an improvement in Net Operating Profit over fiscal 2003. They no longer need to make losses for the year due to bad loan disposal, and the banks’ profitability has been improving since last fiscal year. However, if we examine more closely the makeup of this improvement, we see that outstanding loans have shrunk and interest income on lending has fallen, leading to the third consecutive year of a falling Lending Margin. At the same time, if we look at the breakdown of the Other Revenue, the increase in Fees and Commissions Profit can be wiped out by the decline in Trading Profits etc. that are vulnerable to market conditions. In actuality, Extraordinary (and thus temporary) Gains and Losses
25
in the form of the reversal from loan loss reserves etc., due to lower bad debt levels compensated for the decline in Lending Margin. Japan Post has already begun selling investment trusts across its counters in October, ahead of the privatization of the postal system, and so the banks will be competing with the postal system in this profitable area for fees. After privatization and during the transition period, the postal bank will be able to expand into quite a larger range of business than it is currently engaged in. From these factors, the banks will be pressured to strengthen its profitability further.
Second is the bad loan issue. All of the major banks have achieved their goal of reducing their shares of bad loans under the Financial Revitalization Program. The Japanese banks have steadily reduced their bad loans and the crisis situation of several years ago has passed. However, it cannot be denied that the decline in bad loans is due in large part to the fact that the borrowers’ business conditions have improved greatly. Furthermore, although the regional banks’ bad loan ratio has indeed declined, it is proceeding at a much slower rate than the major banks. When we consider the operating model of the regional banks, they are not able to dispose of their loans as drastically as the major banks, and so for these banks, we cannot lose sight of the issue of bad loans.
Third is the continued weak capital adequacy of these banks. With the recovery in profits, their capital adequacy ratios have improved, and the excessive dependency on deferred tax assets has been alleviated to a degree. However, when we calculate a “real” level of capital more focused on what the nature of capital should be, we find that many banks are still in a position of excess debt. Banks are now ready to embark on a next stage. As they will face increased competition with the privatization of the postal system, they will need a new strategy to be profitable in the market. However their current levels of capital are not sufficiently high. It is imperative that the banks quickly return their funds to the government, wean themselves off their dependency on deferred tax assets, and build up their real capital base.
Fourth is their lending behavior that is currently does not allow them to secure the appropriate interest spreads. They have survived the worst part of their bad loans issue, but now they must be able to earn interest spreads appropriate for the credit risk of the borrower for banks to truly recover their profitability. The reason the bad loan became as serious an issue as it was, is that they were not able to charge correct interest rates. To avoid this reoccurring in the future, they will have to learn to lend at appropriate interest spreads in the newly developing lending markets.