City West Water Expenditure Review
March 2009
Final Report
Halcrow Pacific Pty Ltd
and
Halcrow Pacific Pty Ltd
Melbourne
Level 1, 542 Station Street, Box Hill, Melbourne, VIC 3128 Tel +61 3 9899 9777 Fax +61 3 9899 1214
www.halcrow.com
Halcrow Pacific Pty Ltd has prepared this report in accordance with the instructions of their client, Essential Services Commission, for their sole and specific use. Any other persons who use any information contained herein do so at their own risk.
Essential Services Commission
City West Water Expenditure Review
March 2009
Final Report
Halcrow Pacific Pty Ltd
Essential Services Commission
City West Water Expenditure Review
March 2009
Contents Amendment Record
This report has been issued and amended as follows:
Issue Revision Description Date Prepared by Checked by Authorised by 1 A Draft Report 27/01/09 DS/PL DS/PL DF 1 0 Final Report 20/03/09 DS/MB DF/PL DF 1 1 Final Report + minor ESC comments 31/03/09 DF/PL DF/PL DF 1 2 Final Report – Public Version 15/04/09 DF/PL DF/PL DF
Acknowledgements
Halcrow and Deloitte would like to thank City West Water staff, including Andre Kersting and David Heeps, for their assistance in relation to this report.
Contents
Acknowledgements i Contents ii 1 Executive Summary v 1.1 Background v 1.2 Overview of approach v1.3 Strategies, drivers and service standards vi
1.4 Generic Issues vii
1.5 Operating Expenditure viii
1.6 Capital Expenditure viii
2 Introduction 1
2.1 Background 1
2.1.1 The 2009 metropolitan water price review 1
2.2 Scope of work 1
2.2.1 Nature of advice 1
2.2.2 Issues outside the scope of this project 3
2.2.3 Other work 3
2.3 Structure of the report 3
3 Overview of approach 4
3.1 Process undertaken 4
3.1.1 Inception Meeting with the ESC 4
3.1.2 Preparation of issues paper 4
3.1.3 Initial interviews with the businesses 4
3.1.4 Review of proposed expenditure 5
3.1.5 Preparation of draft report 5
3.1.6 Further interviews with businesses 6
3.1.7 Preparation of final report 6
4 Strategies, drivers and service standards 7
4.1 Corporate strategies 7
4.1.1 Overview 7
4.1.3 Asset Management Framework 10
4.1.4 Operations planning 16
4.2 Service standards 16
4.2.1 Historical service standards 16
4.2.2 Proposed service standards 18
5 Generic issues 19
5.1 Overview 19
5.1.1 Proposed price rises 19
5.1.2 The current economic climate 20
5.2 General cost escalation factors 22
5.2.1 General cost escalation factors 22
5.2.2 Capital expenditure 23
5.2.3 Operating expenditure 27
5.3 Labour cost increases 28
5.3.1 Benchmark increases 28
5.4 Productivity Savings 32
5.4.1 The VCEC report 32
5.4.2 Other Productivity savings 38
5.5 Gainshare/painshare and alliance arrangements 40
5.5.1 Introduction 40
5.5.2 City West Water’s alliance arrangements 42
6 Operating Expenditure 43
6.1 Historical and forecast operating expenditure 43
6.1.1 Overview of outcomes compared to 2005 determination 43
6.1.2 Overview of forecast 44
6.2 Expenditure items 46
6.2.1 Labour 46
6.2.2 Electricity costs 50
6.2.3 Oil and fuel costs 57
6.2.4 Other operations and maintenance costs 58
6.2.5 Billing and collection 58
6.2.6 Conservation programs 60
6.2.7 Information technology 70
6.2.8 Other expenditure 71
6.2.9 Efficiency arrangements 72
6.2.10 Not prescribed 72
7 Capital Expenditure 75
7.1 Historical and forecast capital expenditure 75
7.1.1 Overview of outcomes of 2005 determination 75
7.1.2 Overview of forecast 76
7.1.3 Water 77
7.1.4 Wastewater 78
7.1.5 Recycled Water 78
7.2 Ability to deliver capital program 78
7.3 Capital escalation 79
7.4 City West Water top 10 capital projects 80
7.4.1 West Werribee Dual Water Supply Scheme 80
7.4.2 Altona recycled water project 89
7.4.3 Water mains renewals – social risk – reticulation 95 7.4.4 Water mains renewals – social risk – distribution 98
7.4.5 Derrimut Interceptor Sewer 101
7.4.6 Renew water mains – KPI attainment – reticulation 105 7.4.7 1150mm main – Sayers Road to Dohertys Road 108
7.4.8 Werribee West – 750mm inlet/outlet main 111
7.4.9 New Meter program 114
7.4.10 Werribee West – Low Level Reservoir 116
7.5 Other significant capital projects 119
7.5.1 Werribee West – 600mm inlet/outlet main 119
7.5.2 Meter replacement program 122
7.5.3 Dunnings Road to Sneydes Road 124
7.5.4 Werribee Technology Precinct Recycled Water Project 126
7.5.5 Ongoing 1:5 Compliance Works 129
7.6 Other comments on capital expenditure 130
7.6.1 Renewals program 130
7.6.2 Commissioning dates 136
7.6.3 Depreciation rates 136
7.6.4 Not prescribed capital expenditure 137
7.6.5 Other water capital expenditure 137
7.7 Conclusions and recommendations 137
8 Glossary 139
8.1 Key terms and acronyms used 139
1 Executive
Summary
1.1 Background
The ESC is currently conducting a price review of the proposed prices to be charged by metropolitan Melbourne’s bulk water supplier Melbourne Water and the three retail water businesses – City West Water, South East Water and Yarra Valley Water. The proposed prices relate to the period 1 July 2009 to 30 June 2013, referred to in this document as ‘the next regulatory period’.
The metropolitan water businesses (the businesses) have submitted Water Plans to the ESC for the next regulatory period. The Water Plans include forecasts of operating expenditure, capital expenditure and demand, proposed service standards and prices. The ESC will review the Water Plans and intends to release a draft decision in April 2009, with a final decision issued in June 2009.
Halcrow and Deloitte have been engaged by the ESC to review the businesses’ expenditure forecasts.
The ESC has requested that in our review of the capital expenditure forecasts we focus on the major projects that comprise a significant proportion of the total capital expenditure forecasts and provide advice on whether the projects meet certain key criteria.
In relation to operating expenditure we have been asked to provide advice on whether:
• the proposed trend in operating expenditure over the regulatory period is consistent with existing obligations and the service standards are reasonable • the operating expenditure forecasts associated with meeting new obligations
and/or meeting higher service levels reflect their likely expenditure requirements.
1.2 Overview of approach
In summary, the approach followed by the engagement team to this project was as follows:
• prior to commencing work, the engagement team met with the ESC to discuss the review and identify any areas of particular interest
• the engagement team reviewed in detail the businesses’ Water Plans and prepared an issues paper for consideration by the ESC which set out specific areas of interest or concern. The issues paper was discussed with the ESC and used as a basis for developing and refining interview questions for the businesses
• two core engagement teams held initial discussions with the businesses, each over two days, as set out below. The discussions mainly comprised key personnel from the businesses presenting information regarding their expenditure forecasts, with the opportunity for the engagement team to ask questions and request further information where necessary
• a detailed review of the information collected prior to, during and subsequent to the interviews with the businesses was undertaken to assess, to the extent possible, the prudence and efficiency of the proposed capital and operating expenditure forecasts
• As part of the review we also:
o sought further information from the businesses on a number of specific
issues
o held further telephone and email discussions with the businesses
o had regard to documentation and information prepared by independent
third parties, including by the ABS, Reserve Bank of Australia, ABARE and the US Energy Information Administration.
1.3 Strategies, drivers and service standards
As part of this review we have conducted an analysis on a number of aspects of City West Water’s corporate framework, asset management framework, and strategic planning activities. Our review covered:
• City West Water’s 2008/09 Corporate Plan, Customer Charter, Environmental Sustainability Plan and the Water Plan
• City West Water’s Asset Management Plan, asset management policy, asset creation policy
• procedures for determining capital works programs, ongoing monitoring and post-implementation reviews and
• City West Water’s operations planning process.
1.4 Generic Issues
The ESC’s metropolitan Melbourne price review is taking place against a background of unprecedented change and uncertainty. Southern and eastern Australia has experienced sharply reduced rainfall and inflows to storages and in response the water industry has forecast massive capital investment over the next five years and beyond. In addition, global economic conditions have significantly deteriorated over the past six to nine months and a marked slowdown in the Australian economy has occurred.
These issues are important considerations for this expenditure review. At the time that Water Plans were prepared, real labour costs and the prices of key inputs to water and wastewater infrastructure, such as oil and steel, had been rising consistently for a number of years. Therefore, the businesses’ Water Plans incorporated, to varying degrees, sustained increases in the cost of these inputs. Since July 2008, however, oil and steel prices have fallen sharply, construction activity has declined and unemployment has now started to rise. Adjustments to the businesses’ forecasts have therefore been required to reflect these changed circumstances, which have lowered capital and operating expenditure forecasts. Another key background issue is the recent review of the structure of the metropolitan water sector by the Victorian Competition and Efficiency Commission (VCEC). In its investigation of the Melbourne water sector, VCEC recommended, and the Victorian Government supported, that annual savings in the order of $8-$10 million from ‘shared services’ be incorporated in the businesses’ Statement of Obligations. The water businesses are in the process of assessing the possible sources of these savings, and a number of areas have been identified for further consideration. In aggregate the businesses have not proposed savings of this extent will be achieved until 2012/13. We do not consider this is consistent with the government’s support of VCEC’s recommendations and accordingly we have suggested that shared services savings are greater than have been forecast.
1.5 Operating Expenditure
The following table summarises our recommendations for changes to City West Water’s operating expenditure. Reasons for the adjustments are set out later in this document.
Table 1.1: Overview of recommended changes to operating expenditure ($m, 2008/09)
City West Water 2007/08 2008/09 2009/10 2010/11 2011/12 2012/13
Total Water Plan
operating expenditure 177.27 207 228.29 263.52 304.86 350.13 Recommended adjustments Maintenance cost escalation -0.59 -1.19 -1.80 -2.44 -3.09 VCEC productivity 1.00 0.80 0.45 0.10 0.10 West Werribee Dual
Water Supply Scheme
0.00 0.00 0.00 -0.31 0.00 Labour costs (including
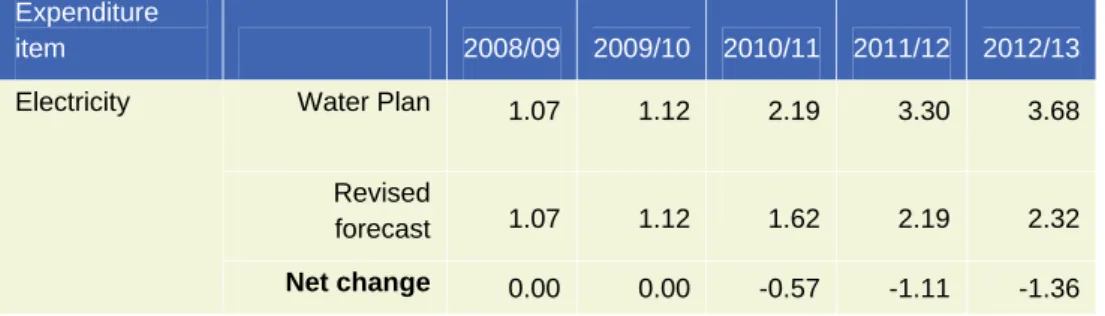
defined benefits contributions) 2.76 2.87 1.23 -0.25 -0.33 Water conservation -1.27 -0.50 -1.50 -1.58 -1.73 Reallocation from prescribed to not prescribed 0.00 -1.38 -1.39 -1.40 -1.42 Electricity 0.00 0.00 -0.57 -1.11 -1.36 Total adjustments 1.90 0.60 -3.58 -6.99 -7.84 Total recommended operating expenditure 208.90 228.89 259.94 297.87 342.29 1.6 Capital Expenditure
The following table summarises our recommendations for changes to City West Water’s capital expenditure. Reasons for the adjustments are set out later in this document.
Table 1.2: Overview of recommended changes to capital expenditure ($m, 2008/09) Expenditure item 2007/08 2008/09 2009/10 2010/11 2011/12 2012/13 Total (09-10 to 12-13) Water Plan - 0.26 3.20 6.41 3.23 0.00 12.84 Revised forecast - 0.26 3.14 6.24 3.12 0.00 12.50 1150mm main – Sayers Road to Dohertys Road Net change -0.00 -0.06 -0.17 -0.11 0.00 -0.34 Water Plan - - 3.31 5.98 2.99 0.00 12.29 Revised forecast - - 3.25 5.82 2.89 0.00 11.96 Werribee West – 750mm inlet/outlet Net change -- -0.06 -0.16 -0.10 0.00 -0.32 Water Plan - 0.54 1.57 3.14 1.57 0.00 6.28 Revised forecast - 0.54 1.54 3.06 1.52 0.00 6.11 Werribee West – low level reservoir
Net change - -0.01 -0.03 -0.08 -0.05 0.00 -0.17 Water Plan - - 1.37 2.39 1.19 0.00 4.95 Revised forecast - - 1.34 2.32 1.15 0.00 4.82 Werribee West – 600mm inlet/outlet Net change - - -0.03 -0.06 -0.04 0.00 -0.13 Water Plan - 2.55 1.14 0.00 0.00 0.00 1.14 Revised forecast - 2.19 0.00 0.00 0.00 0.00 0.00 Dunnings Road to Sneydes Road Net change --0.36 -1.14 0.00 0.00 0.00 -1.14
Cost escalation Net change - -2.20 -6.74 -11.39 -10.25 -7.14 -35.52
Total Water Plan
forecast 76.04 90.37 139.80 159.55 109.03 61.49 469.87 Net changes 0.0 -2.57 -8.05 -11.87 -10.56 -7.14 -37.63 Total revised forecast 87.80 131.75 147.68 98.47 54.35 432.24 Business adjustments to 2008-09 forecast Net change - -3.94 1.86 2.30 0.00 0.00 4.16 Total revised forecast 83.86 133.61 149.98 98.47 54.35 436.40
Note: numbers may not add due to rounding
City West Water provided an update to the ESC outlining some minor deferrals of capital expenditure from 2008/09 to the next regulatory period. The sum total of the deferrals amounted to approximately $5 million however a component of the proposed deferrals is already reflected in the revised forecast for the Dunnings Road to Sneydes Road project.
2 Introduction
2.1 Background
2.1.1 The 2009 metropolitan water price review
Under the provisions of the Water Industry Regulatory Order (WIRO), the Essential Services Commission (ESC) has the power to regulate prices for prescribed services, including water and wastewater services. According to the WIRO, the ESC must be satisfied that expenditure forecasts ‘reflect the efficient delivery of the proposed outcomes contained in the Water Plan and take into account a planning horizon that extends beyond the term of the Water Plan.’
The ESC is currently conducting a price review of the proposed prices to be charged by metropolitan Melbourne’s bulk water supplier Melbourne Water and the three retail businesses – City West Water, South East Water and Yarra Valley Water. The proposed prices relate to the period 1 July 2009 to 30 June 2013, referred to in this document as ‘the next regulatory period’.
The metropolitan water businesses (the businesses) have submitted Water Plans to the ESC for the next regulatory period. The Water Plans include forecasts of operating expenditure, capital expenditure and demand, proposed service standards and prices. The ESC will review the Water Plans and intends to release a draft decision in April 2009, with a final decision released in June 2009.
2.2 Scope of work
2.2.1 Nature of advice
Under the existing legislative framework the ESC is required to be satisfied that the businesses’ expenditure forecasts:
• reflect efficient expenditure
• are consistent with delivering the required service levels, outputs and obligations over the regulatory period and
• take into account a planning horizon that extends beyond the regulatory period.
Halcrow and Deloitte and have been engaged by the ESC to review the businesses’ expenditure forecasts. The ESC has requested that in our review of the capital expenditure forecasts we focus on the major projects that comprise a significant proportion of the total capital expenditure forecasts and provide advice on whether the projects meet the following criteria:
• appropriate in relation to key drivers and obligations – with evidence provided of such drivers and in accordance with the Statement of Obligations that sets out responsibilities of each of the businesses.
• robust (with adequate supporting analysis and systems) – as demonstrated by reports which clearly enunciate the problems faced by the business, and sets out the analysis undertaken of the options to resolve that problem and identifies the preferred solution. The preferred solution should also fall within an overall strategy by the business.
• deliverable over the regulatory period – the key activities comprising the delivery of the project from planning to construction need to have been identified and thought through and there should be evidence that the projects can be practically delivered within the proposed timeframe.
• reasonable cost estimate – the cost estimate should be well supported either by a schedule of quantities using typical rates currently being experienced in the industry, or compare favourably with other similar projects or preferably both of the above.
In relation to operating expenditure we have been asked to provide advice on whether:
• the proposed trend in operating expenditure over the regulatory period is consistent with existing obligations and the service standards are reasonable – having regard to expected productivity improvements, trends in input prices and the impact of growth on operating expenditure needs and any other relevant factors
• the operating expenditure forecasts associated with meeting new obligations and/or meeting higher service levels reflect their likely expenditure requirements – having regard to any benchmarking or other quantitative techniques considered appropriate.
In providing advice on the above, we have been asked to have regard to:
• any guidance issued by the Commission with respect to how it will assess the businesses’ proposed expenditure forecasts
• the information set out in the businesses’ Water Plans (and accompanying information templates) and any explanations that the businesses provide with respect to the basis used to derive the forecasts including any assumptions used
• any readily available data and information that the consultants have available to assess expenditure forecasts
• the experience of the consultants’ proposed project team in preparing and assessing the veracity of forecasts as well as costing projects in the water sector.
2.2.2 Issues outside the scope of this project
We have been asked by the Commission not to consider the following matters: • toll payments (operating expenditure) by Melbourne Water associated with the
proposed desalination plant
• waterways and drainage expenditure by Melbourne Water – except to the extent that the allocation of corporate costs will have implications for water and wastewater expenditure
• whether expenditure is categorised as ‘operating’ or ‘capital’ • the structure of bulk water prices.
2.2.3 Other work
The Commission has received advice from another consultant regarding the veracity of the businesses’ demand forecasts. While we are broadly aware of this work it was not received in sufficient time to be incorporated into our report.
2.3 Structure of the report
This report is focussed on the expenditure forecasts submitted by City West Water. It is structured as follows:
• chapter 3 outlines the methodology adopted by us in reviewing City West Water’s expenditure forecasts
• chapter 4 discusses City West Water’s strategies, cost drivers and service standards
• chapter 5 discusses some issues common to both City West Water’s operating and capital expenditure forecasts
• chapter 6 outlines City West Water’s operating expenditure forecasts, and presents our analysis and conclusions/recommendations
• chapter 7 outlines City West Water’s capital expenditure forecasts, and presents our analysis and conclusions/recommendations.
3
Overview of approach
3.1 Process undertaken
The process adopted for this expenditure review is set out below.
3.1.1 Inception Meeting with the ESC
Prior to commencing work, the engagement team met with the ESC to discuss the review and identify any areas of particular interest for the ESC. At the inception meeting, the ESC provided the engagement team with a paper that outlined some of the key issues to be considered. These included:
• the ability of the businesses to deliver their capital programs within the regulatory period
• analysing each of the businesses’ top ten capital projects • the cost escalation factors used in the businesses’ forecasts • using 2007/08 as the ‘base year’ for expenditure
• paying particular attention to:
o energy costs (including electricity and green energy) o any purchases of greenhouse gas offsets
o productivity improvements
o conservation programs and how they relate to the supply-demand balance o the cost of managing bulk entitlements
3.1.2 Preparation of issues paper
The next stage of the expenditure review process was the preparation of an issues paper for consideration by the ESC. The engagement team reviewed in detail the businesses’ Water Plans and set out specific areas of interest or concern. The issues paper was discussed with the ESC and used as a basis for refining discussion questions for the businesses.
3.1.3 Initial interviews with the businesses
In the initial stages of the project, two core engagement teams held discussions with the businesses, each over two days, as below:
Table 3.1: Initial meetings with businesses
Date Business
4 and 5 December South East Water 8 and 9 December Yarra Valley Water 9 and 10 December Melbourne Water 10 and 11 December City West Water
Prior to the interviews, the businesses received a paper prepared by the engagement team highlighting the key areas for discussion. The interviews mainly comprised key personnel from the businesses presenting information regarding their expenditure forecasts, with the opportunity for the engagement team to ask questions and request further information where necessary.
3.1.4 Review of proposed expenditure
A detailed review of the information collected prior to, during and subsequent to the interviews with the businesses was undertaken to assess, to the extent possible, the prudence and efficiency of the proposed capital and operating expenditure forecasts. The assessment included a review of the following:
• the planning process through which capital projects are identified and implemented
• the ability to deliver the proposed capital expenditure program • the cost escalation factors adopted
• the proposed level of capital expenditure
• the main components of forecast operating expenditure. As part of the review we also:
• sought further information from the businesses on a number of specific issues • held further telephone and email discussions with the businesses
• spoke to external parties (including DSE)
• had regard to documentation and information prepared by independent third parties, including by the ABS, Reserve Bank of Australia, ABARE, the US Energy Information Administration.
3.1.5 Preparation of draft report
The process and findings of the review undertaken by the engagement team were documented in a draft report, together with recommendations in respect to the prudence and efficiency of the proposed expenditure. This draft report was discussed with the ESC and distributed to the businesses for comment.
3.1.6 Further interviews with businesses
Following the submission of the draft report to the ESC and the receipt of comments from the businesses, we held further interviews with the businesses to discuss their proposals.
Table 3.2 Further meetings with businesses
Date Business
23 February, 16 March South East Water 12 March Yarra Valley Water 12 March City West Water
3.1.7 Preparation of final report
In preparing this final report, we have had regard to:
• comments provided on the draft report by the ESC and the businesses
• further information provided by the businesses subsequent to their comments on the draft report.
In general terms our review has been more extensive and covered more areas than those discussed in this report. That is, where we have reviewed areas of expenditure and are satisfied at this time, based on the information provided to us, with the projections incorporated in the forecasts, we have generally not commented on that area in this report.
4
Strategies, drivers and service standards
4.1 Corporate strategies
4.1.1 Overview
We have conducted an analysis on a number of aspects of City West Water’s corporate framework, asset management framework and strategic planning activities. Our review covered:
• City West Water’s 2008/09 Corporate Plan, Customer Charter, Environmental Sustainability Plan and the Water Plan
• City West Water’s Asset Management Plan, asset management policy, asset creation policy
• procedures for determining capital project deliverability, ongoing monitoring and post-implementation reviews and
• City West Water’s operations planning process. Our analysis of each of these areas is presented below.
4.1.2 Corporate framework
2008/09 Corporate Plan
The Corporate Plan provides a summary of City West Water’s strategic direction and documents the key strategic initiatives, priorities, previous 12 months’ financial performance, planned financial performance for the 2008/09 year and forecast capital expenditure for the next 10 years. The Corporate Plan is a three-year rolling plan that is prepared annually and endorsed by the City West Water Board. In addition to the Corporate Plan, City West Water also prepares a rolling five-year forecast for capital and operating expenditure on an annual basis. While City West Water no longer produce a separate Statement of Corporate Intent, this is now embedded in the Corporate Plan.
The process for preparing the Corporate Plan begins in November, when City West Water’s Vision, Mission and Strategic Goals are reviewed, and the Asset Management Plan (discussed in more detail in Section 4.1.3) is signed off. In December and January the projects and programs to be undertaken in the forthcoming five-year period are developed, in addition to draft five-year capital and operating budgets. In February the draft Corporate Plan for the following year is signed off, with Board approval occurring in March. In April the Corporate Plan is submitted to Government.
City West Water’s Vision, Mission and Strategic Goals are outlined below in Figure 4.1. Each project or activity undertaken in City West Water must in some way contribute to the achievement of the Vision, Mission and Strategic Goals.
Figure 4.1: City West Water’s Vision, Mission and Strategic Goals
Source: City West Water
Mission
“Guarantee affordable and safe water for today and
tomorrow” Values Leadership Innovation Integrity Respect Strategic Goals Strategic Initiatives & Output Monitoring Environment Significantly more with
significantly less
• Manage supply and demand to minimise extraction of water from the environment • Maximise sustainable
reuse of water
• Protect the environment and minimise the impact of our services on the environment • Towards zero waste
Economic Efficiency and growth Financial strength to
deliver sustainability
Services enhance new business and growth in the community
Maximise triple bottom line return to the shareholder
Prudent and efficient
Social – Customer Right product, right price, right way Services matched to customer
needs
Conservers, not consumers
Clean producers, not polluters
Social - Our People For Today and Tomorrow Right people, right jobs, right
outcomes
Absolute safety
Social – Community Leading and including Community leader and
advocate in water cycle management
Partnering for sustainable outcomes
STRATEGIC GOALS Vision
“A truly sustainable water business”
Strategy Monit
Water Plan
The Water Plan is based on the Corporate Plan and Asset Management Plan (discussed below) and identifies the specific actions and required expenditure to meet the targets and objectives set in the Corporate Plan and Asset Management Plan. The Water Plan is based on the objective of maintaining average service levels, that is a “business-as-usual” approach to service standards, with the current Customer Charter setting the baseline for the next regulatory period.
Environmental sustainability plan
In keeping with its corporate Vision to be ‘a truly sustainable water business’, City West Water has developed an Environmental Sustainability Plan (ESP) to ensure its environmental risks are appropriately managed. While the ESP focuses on City West Water’s environmental strategic goals, it balances the environmental considerations of City West Water with social and economic considerations. City West Water’s ESP outlines its plan for environmental management, and details the objectives, programs and targets to enhance City West Water’s sustainability by improving environmental performance over the three years from 2008 to 2011. It details the roles and responsibilities for implementing programs, achieving the objectives and targets, as well as reporting requirements. We note that the ESP is also publicly available on City West Water’s website.
The ESP outlines each of City West Water’s high-level environmental programs for the period from July 2008 to June 2011. The programs are:
• greenhouse gas management
• green office
• reducing lifecycle environmental impacts
• water conservation
• driving environmental improvement in operations
• water recycling
• trade waste management and
• driving a resource efficient future.
Each of the above programs contains a series of strategic goals and objectives relevant to City West Water, relevant background information, specific targets to meet the strategic goals and objectives, and work programs that detail how City West Water plan on achieving the stated targets.
Business drivers
In its Corporate Plan, City West Water has identified five key business drivers that drive the activities undertaken over the next regulatory period and consequently have a financial impact on the business. These are:
• government policy and legislation – the impact of government policy and legislation, including the VCEC inquiry into reform of the Metropolitan Retail Water Sector, the Central Regions Sustainability Water Strategy and Our Water Our Future, remains a significant business driver for the business during the next regulatory period
• customers – the introduction of guaranteed service levels in July 2005 and the introduction of drought-related measures that will increase the volume of water available in the system and reduce the volume of water lost from burst water mains will continue to drive the business during the next regulatory period
• regulators – City West Water’s obligations to and relationship with regulators such as the ESC, Energy and Water Ombudsman Victoria, the Department of Humans Services and the EPA continue to be a significant business driver • climate and geology – variable weather and low rainfall continue to impact the
level of bursts and leaks, and in turn maintenance requirements and service standards
• demographics – City West Water continues to experience significant urban growth within its licence area, with a sizeable number of greenfield lots forecast to be released in the next regulatory period.
4.1.3 Asset Management Framework
Asset Management Plan
The Asset Management Plan (AMP) is one of the key inputs of City West Water’s Water Plan for the next regulatory period, and is designed to contain all the information required to support the asset-related targets and budgets proposed in the Water Plan. The AMP is divided into four separate (although linked) strategic documents, these being:
• asset management overview • asset development plan
• asset operations and maintenance plan and • asset support services plan.
As outlined in the AMP, it is a core requirement by City West Water that all asset-related activities are to be linked to either delivering a service to a customer as measured by a key performance indicator, or in satisfying a regulatory requirement. City West Water’s AMP is based on a master business process. This process is outlined in Figure 4.2 below, and links City West Water’s corporate Vision and Mission with the AMP through a series of projects and key performance indicators.
Figure 4.2: City West Water’s master business process
The above diagram shows that City West Water’s Vision and Mission are supported by three strategic goals (economic, environmental and social). These three strategic goals are in turn explained by a number of strategic statements outlined in the Corporate Plan. The achievement of each of the strategic goals, as interpreted by the strategic statements, is measured by a number of key performance indicators.
The key performance indicators are met by undertaking a number of projects, which can be grouped into programs. The programs are in turn grouped into a number of asset plans, with the asset plans governed by City West Water Board policy.
The above process ensures that City West Water’s Vision and Mission and Board policy are linked through a number of strategic goals. The achievement of these is measured by a number of key performance indicators, which themselves are met through undertaking a number of projects that are grouped into a number of programs.
Asset Management Policy
Embedded in City West Water’s Corporate Plan is the Asset Management Policy, also known as the Asset Investment Philosophy. City West Water’s Asset Management Policy sets out the overarching principles, processes and procedures for the management of City West Water’s water and wastewater assets.
City West Water’s key objective for managing assets, as outlined in the Asset Management Policy, is to ensure that all water and wastewater assets efficiently provide continual service to customers, whilst maintaining environmental sustainability. In addressing this objective, City West Water is committed to asset management that is characterised by investment based on evidence related to asset condition and customer service needs, optimisation of risk, and responsible delivery of lowest life cycle costs.
The focus on evidence reflects City West Water’s requirement for obtaining factual and objective information as a prerequisite basis for considering, planning and implementing intervention and investment strategies and actions. City West Water’s approach to asset management is based on the risk management methodology and principles of Australian Standard AS/NZA 4360:2005 (Risk Management). In line with this approach, City West Water undertakes optimal management of its assets, which includes:
• undertaking risk ranking of network assets in order to assist with prioritisation of interventions
• use and development of investment decision tools that are of robust design, rigorous in their analysis, and consistently applied to identify optimal interventions and
• achieving risk reduction through implementation of optimal interventions, ranging for example, between physical actions such as renewals of assets, to organisational strategies such as planning for responsive contingencies.
City West Water’s approach to achieving responsible delivery of lowest life cycle costs for individual assets is to implement optimal interventions at the most appropriate time. The gathering and use of evidence related to historical and likely future performance of assets, as well as environmental, social and economic consequences of changed asset performance is critical to this approach.
City West Water believe that such an approach ensures that investments in assets will only be made to ensure that key performance indicators, reflecting triple bottom line performance, are met and that asset-related risks are kept within acceptable limits.
The following figure provides a schematic overview of City West Water’s Asset Management and Planning process.
Figure 4.3: City West Water’s Asset Management and Planning process
Source: City West Water Asset creation policy
Over the next regulatory period, City West Water has budgeted to spend over $30 million on maintenance annually, a sizeable proportion of its annual operational expenditure budget. In order to contain the number of maintenance activities to existing levels, and in the longer term reduce them, City West Water has developed a series of Asset Creation Policies.
City West Water recognises that the quality of design, pipe material, construction practice and fittings all contribute to the long-term performance of assets. If acceptable asset performance is to be achieved then no one element of asset creation can be ignored. As such, City West Water has developed the following asset creation policies to ensure the assets for which City West Water is responsible will meet the needs for today and the future:
• products and materials policy • design policy
• construction policy • audit policy
• authorised persons policy.
Asset Data and History
CWW Risk/ Cost Trade Off
Policy Conduct Condition Assessment Determine Likelihood of Failure Economic Consequence of Failure Social Consequence of Failure Environmental Consequence of Failure Apply Decision Matrix Apply Decision Matrix Apply Decision Matrix Assess Results and Determine Action Do Nothing Renew (Capex) Repair (Opex) Monitor (Opex)
As noted above, City West Water’s goal of putting the above policies into action is to contain the number of maintenance activities to existing levels, and in the longer term to reduce them. Using these policies in conjunction with the asset management policy outlined above, City West Water has set itself the challenge of halving its responsive maintenance (assuming constant KPIs). While City West Water note that there will be no reductions in existing budgets in the short term, its believed that maintenance budgets should slow significantly from their historical growth trends.
Capital works program
As noted above, capital projects are often grouped into capital programs by City West Water as part of the master business process. The development and implementation of capital works nearly always involves more than one City West Water department. As such, City West Water has produced capital works programs and nominated capital works program managers as a means of coordinating its capital works across the business.
City West Water has prepared Investment and Approval Guidelines that outline the role and responsibilities of the program and sub-program managers in relation to both program development and program implementation.
Capital projects are undertaken as means of achieving specified outcomes. As noted above, these outcomes must be linked to either delivering a service to a customer as measured by a key performance indicator, or in satisfying a regulatory requirement.
In developing the specific five, three and one year capital programs, program managers and sub-managers are required to liaise closely with the relevant General Manager. In the implementation of the programs following their approval, the program and sub-program managers are required to work closely with the Capital Coordination Committee. City West Water has seven defined capital works programs: Growth, Backlog, Compliance, Renewals, Water quality, Recycled Water, and Corporate.
Project monitoring and reporting
City West Water’s Investment and Approvals Guidelines also outline the expected process for monitoring and reporting on projects.
It is the responsibility of the project managers to carefully monitor their project costs and provide information to facilitate periodical reporting. To assist project managers, City West Water has developed a cost monitoring template.
Project reporting is generally facilitated by the Finance Department. Monthly and quarterly summaries are prepared for the Business Report, which is tabled to Board on a monthly basis. Project managers of major projects may be requested to prepare a separate detailed report to the Board.
Project implementation reviews
As outlined in City West Water’s Investment and Approvals Guidelines, it is a requirement that all City West Water projects be subject to a post implementation review (PIR). It is the responsibility of the relevant project managers to prepare the PIR after the completion of a project. The purpose of the PIR is to:
• review whether the project was completed on time and to budget and, if not, to determine the reasons why this was not the case
• assess whether the project benefits identified in the business case were actually achieved and
• capture the lessons learned from the project, for example what did and what didn’t work well.
City West Water requires that PIRs for any water, wastewater and recycling project greater than $1.5 million must be submitted to the Executive Management Committee. Additionally, any PIR of a Board approved project should also be submitted to the Board for review and consideration. For projects below the $1.5 million threshold, the PIR is to be reviewed at the General Manager level.
4.1.4 Operations planning
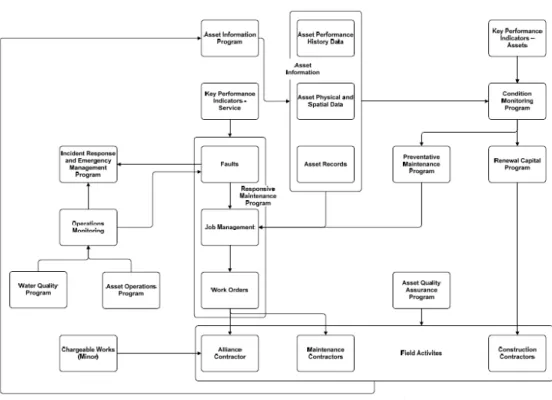
City West Water’s operations planning process is outlined in Figure 4.4 below. Figure 4.4: Operations planning process
Source: City West Water
As the above figure outlines, KPIs are the key input into City West Water’s operations planning process. City West Water’s KPIs not only drive the condition monitoring programs, which in turn drive the preventative maintenance and renewal capital programs, but they also drive the responsive maintenance program. Figure 4.4 also demonstrates how City West Water’s asset information program (which includes information such as performance history, physical and spatial data, and asset records), responsive maintenance program and field activities are intrinsically linked.
4.2 Service standards
4.2.1 Historical service standards
In the 2005 price determination, the ESC set service standards for each metropolitan and regional water business. The ESC approved 21 service standards for City West Water, ranging from water interruptions to sewer blockages, complaints to EWOV and minimum flow rates. City West Water further proposed (and the ESC approved) nine additional service standards.
City West Water met or exceeded most of their target service standards, on average, over the first regulatory period. The targets that City West Water did not meet (within a 5 per cent threshold) were:
Table 4.1: Service standards not met (2005/06 to 2007/08)
Service standard Target Actual Variance
Unplanned water supply interruptions restored within
five hours (per cent) 99 86 13% lower
Average unplanned customer minutes off water supply 41 48 16% higher Average duration of unplanned water supply
interruptions (minutes) 105 176 67% higher Number of complaints to EWOV per 1,000 customers 0.41 0.55 34% higher Telephone calls answered within 30 seconds (per cent) 82.4 78.6 5% lower Account enquiries answered within 30 seconds (per
cent) 80.0 74.5 7% lower
City West Water explained that it undertook a change of field practice where water mains are turned off immediately, which has adversely impacted its performance on the first three indicators in Table 4.1, although the current practice has the advantage of saving water. City West Water attributes its failure to meet telephone call answer time targets to an increased number of calls due to restrictions and a new billing system, which also adversely impacted the number of complaints to EWOV.
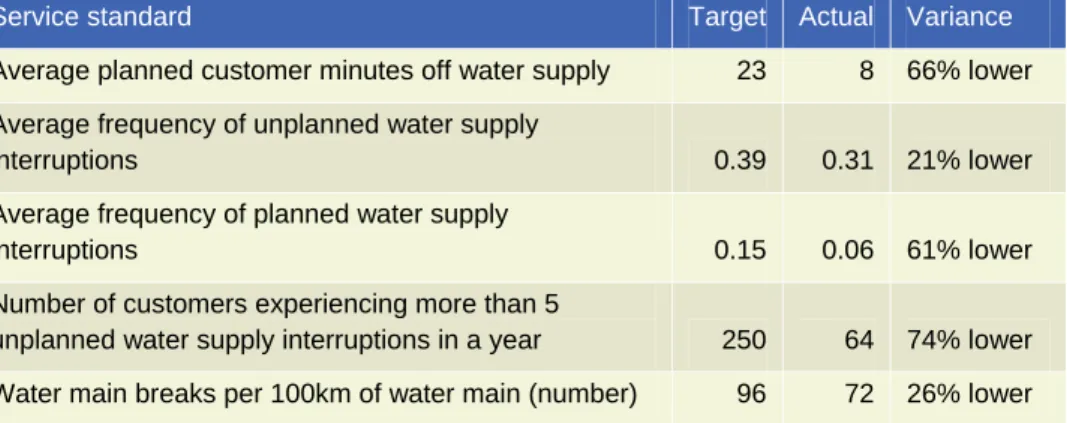
City West Water performed significantly better1 on several indicators compared to
target in the current regulatory period. These include:
Table 4.2: Service standards 20 per cent or more better than target (2005-06 to 2007/08)
Service standard Target Actual Variance
Average planned customer minutes off water supply 23 8 66% lower Average frequency of unplanned water supply
interruptions 0.39 0.31 21% lower
Average frequency of planned water supply
interruptions 0.15 0.06 61% lower
Number of customers experiencing more than 5
unplanned water supply interruptions in a year 250 64 74% lower Water main breaks per 100km of water main (number) 96 72 26% lower
4.2.2 Proposed service standards
City West Water has proposed service standard targets that mirror its average performance over the three years to 2007/08, with the exception of telephone calls and account enquiries answered within 30 seconds, for which it is proposing a target of 80per cent, which is above the three year average.
However City West Water advised that it was focusing on improving the efficiency of service delivery, which could be expected to result in a relative decrease in the cost of service provision. Whilst it is difficult to establish an exact relationship between cost and service standards, we note that both City West Water’s proposed maintenance and customer service forecasts are, for the most part, higher than what has been spent in the current regulatory period.
5 Generic
issues
5.1 Overview
This section discusses the engagement team’s approach to analysing certain issues which are generic across each of the businesses and in several cases apply to both operating and capital expenditure. These include:
• general cost escalation factors • labour cost increases
• productivity and other cost savings
• gainshare/painshare arrangements and other outcomes of alliance contracts.
5.1.1 Proposed price rises
A substantial augmentation program has been proposed, and indeed is underway, in order to increase the amount of water available to Melbourne customers. The augmentation projects, when combined with ongoing expenditure proposed by the businesses, will result in a dramatic increase in expenditure over the forthcoming regulatory period. The four metropolitan businesses’ Water Plan forecasts were for total expenditure of $10.8 billion over the regulatory period 2009/10 to 2012/13, including $4.3 billion of capital expenditure. Across the industry this represents a 64 per cent annual real increase in operating expenditure (including projected toll payments for the desalination plant) and a 35 per cent increase in capital expenditure over base year (2007/08) expenditure.
This increase in expenditure, when combined with reduced water use, results in a substantial increase in proposed water prices. Under the businesses’ proposals, prices will increase by almost 100 per cent in real terms over the five year period. Given this increase, in its issues paper the Commission has noted that, in addition to its usual examination of whether proposed expenditures is efficient and prudent, it will also consider: 2
• whether the proposed profile of capital expenditure should be smoothed to occur more evenly over the period, instead of being concentrated at the beginning of the period
• whether some expenditure could be deferred into the following regulatory period
• whether businesses have the capacity to deliver the proposed large capital program during the short timeframe proposed in their Water Plans
• stakeholders views on the trade-offs between reducing the proposed price increases and meeting environmental, drinking water quality and service reliability objectives.
It is not the role of this consultancy to directly address the issue of proposed price increases. However, given the Commission’s comments, in reviewing the businesses’ proposals we have been cognisant of the magnitude of the price rises proposed and therefore the importance of ensuring that discretionary expenditure is minimised or eliminated entirely.
5.1.2 The current economic climate
This review is taking place at a time of significant economic uncertainty. For the vast majority of the current regulatory period, the Australian and Victorian economies have been in a phase of strong growth. Economic conditions have been characterised by:
• a falling unemployment rate, which was around 4.25 per cent for the majority of 2008
• strong growth in real wages, particularly in professions impacted by the ‘mining boom’. This includes engineering and other technical skills engaged in infrastructure industries such as the water sector
• a relatively strong Australian dollar which almost reached parity with the US dollar in mid 2008
• increasing commodity prices, particularly in late 2007 and early 2008
• increasing oil prices, which had flow-on effects to oil by-products such as certain chemicals and plastics products
• steadily increasing domestic inflation and nominal interest rates.
We note that the ESC’s decision in relation to gas distribution prices, released in March 2008, took the view that continuing real increase in wages in the utilities industries were likely, and that non-labour cost inputs were also likely to rise. However, there has been a significant change in the global and domestic economic outlook since mid 2008. Widely attributed to failures in the US banking system, short to medium term economic conditions will be significantly different to those in previous years. Economic conditions are likely to reflect:
• substantially lower private sector capital investment, particularly in resource industries, although this may be partly offset by higher levels of Federal and State Government investment in capital infrastructure
• a weaker Australian dollar against most currencies • substantially lower commodity prices, including oil prices • lower interest rates and inflation
• relatively volatile property and housing prices, with significant falls in some areas.
In our Draft Report we noted that although economic growth had slowed some economic indicators had not yet moved. However, since our draft report more recent data shows that:
• full time employment is falling sharply. The Australian unemployment rate has now risen to 5.2per cent, with Victoria’s unemployment rate well above the average at 5.6per cent
• gross domestic product fell 0.5per cent in the December quarter – the first quarterly decline since 2000/01.
This data was released after the most recent economic forecasts released by the Australian Government3 and the RBA4. The Government’s forecast of key
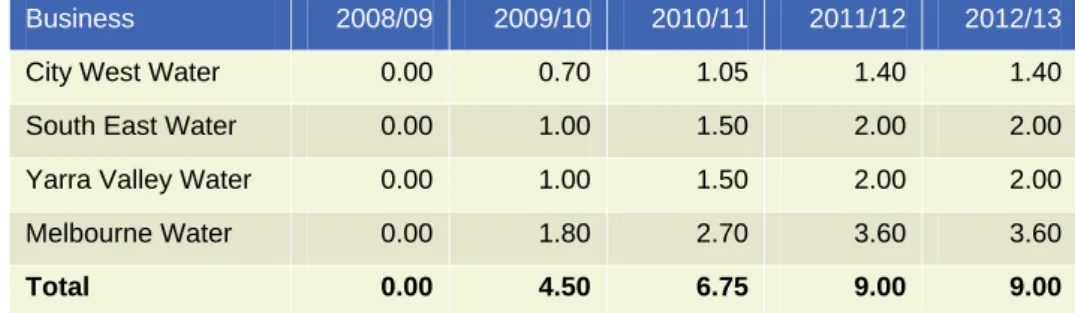
economic parameters is:
Table 5.1: Key economic parameters5
Parameter (year average percentage change)
2008/09 2009/10 2010/11 2011/12
Real GDP 1.0 0.75 3.0 3.0
Employment 1.0 -0.75 1.25 1.25
Wage Price Index 4.0 3.5 4.0 4.0
CPI 2.0 2.0 2.5 2.5
Nominal GDP 6.75 0.0 5.25 5.25
The Government has forecast that unemployment will reach 7per cent by June 2010.
3 Commonwealth of Australia, Updated economic and fiscal outlook, February 2009 4 Reserve Bank of Australia, Statement on Monetary Policy, 6 February 2009
The Reserve Bank’s forecasts are similar to the Government’s. In its forecast of upcoming economic conditions the Reserve Bank noted that:
• business investment is expected to fall throughout most of the forecast period, with falls in commodity prices and resource company share prices resulting in a substantial scaling-back of mining-related investment. Non-residential building is also forecast to contract significantly
• wage growth is likely to slow in line with conditions in the labour market. It is also worth noting that a clear feature of the current economic downturn has been that forecasts of economic activity have consistently proved overly optimistic. This includes both forecasts by government as well as independent commentators. Noting the above, two things are clear. Firstly, economic conditions experienced in the current regulatory period will not provide a good guide to economic conditions over the future regulatory period. Secondly, forecasts of certain input prices which were prepared in early to mid 2008 are unlikely to reflect current market conditions. In particular, impacts of the downturn are likely to include (compared to a 2007/08) baseline:
• equal or lower cost of materials such as steel, plastics-based pipes and chemicals
• equal or lower unit capital expenditure costs due to less competition from other large infrastructure projects, not only in the mining sector but in construction more generally
• equal or lower fuel costs • reduced pressure on wages.
Finally, we encourage the ESC to closely monitor the changing economic circumstances and take them into account in its decisions.
5.2 General cost escalation factors
5.2.1 General cost escalation factors
Aggregate operating and capital expenditure forecasts are a function of both the level of activity required in the forecast period, plus the forecast change in price of the individual cost inputs.
Individual price changes will differ across cost items. While some cost items will generally follow price levels in the economy (as measured by the CPI) others will be above or below CPI. Depending on the nature of the industry in question, cost escalation for a large proportion of input costs may differ markedly from the CPI.
City West Water’s assumed cost escalation factors for operating and capital expenditure are discussed below.
5.2.2 Capital expenditure
The Econtech report
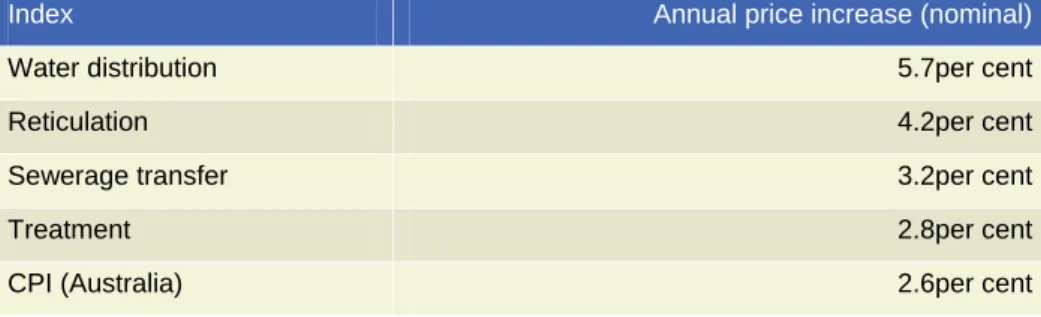
The businesses engaged economic consultants Econtech (now KPMG Econtech) to prepare a report that provided forecast increases for capital project prices. This report, finalised in July 2008, included forecasts for changes in water distribution, reticulation, sewerage transfer and treatment costs, as well as information on other economic indicators such as CPI, average earnings, etc. Each of the businesses has applied the data contained in the Econtech report to their forecasts in different ways. Econtech’s main forecasts are included below:
Table 5.2: Econtech forecast capital project prices 2008 to 2014
Index Annual price increase (nominal)
Water distribution 5.7per cent
Reticulation 4.2per cent
Sewerage transfer 3.2per cent
Treatment 2.8per cent
CPI (Australia) 2.6per cent
City West Water forecasts
City West Water has had reference to the Econtech forecasts when determining its capital escalation assumptions. City West Water has advised that, for simplicity, it has applied a single real increase of 2.5 per cent per annum to all capital expenditure (Water Plan, p.32), rather than allocate different escalators to different types of capital expenditure.
Discussion
It is clear that many of the assumptions and forecasts contained in the Econtech report are not appropriate. This is not to question the veracity, integrity or methodology underlying the Econtech report. It simply reflects the fact that the sudden (and generally unanticipated) change in economic conditions since the report was prepared means that it has been overtaken by events and is not longer relevant.
For example, a key assumption inherent in Econtech’s report is a “sustained increase” in oil and steel prices, which are key inputs to water infrastructure. When
the report was finalised in July 2008, this was a reasonable assumption, as both commodities had indeed experienced sustained increases for some time.
Since the Econtech report was finalised, however, there has been significant turmoil in global equity, credit and commodity markets. Section 6 of this report details the recent (i.e. post-July 2008) falls in global crude oil prices, which decreased by 53 per cent in real AUD terms between July 2008 and March 2009. Further, futures contracts for delivery in oil up to June 2013 are settling for around US$50-65, which is far less than AUD oil prices in July 2008.
Gauging the price of steel is a more difficult matter, because there are multiple steel products and markets throughout the world. One firm that does calculate a weighed steel price index is the CRU Group, which publishes its CRUspi index comprised of six carbon steel indices, together with indices for stainless steel and metallics. The below chart shows how the CRUspi global steel index has moved since July 2005 and shows a clear decline towards the present day.
Since July 2008, the CRUspi index has declined by 48 per cent. This mirrors the widely recognised Reuters/Jeffries CRB (global commodities) index, which has dropped 49 per cent since early July 2008.
Figure 5.1: CRUspi global steel prices index 1 July 2005 to 1 January 2009
117 167 217 267 317 1 J ul 0 5 1 S ep 05 1 N ov 05 1 J an 06 1 M ar 06 1 M a y 0 6 1 J ul 0 6 1 S ep 06 1 N ov 06 1 J an 07 1 M ar 07 1 M a y 0 7 1 J ul 0 7 1 S ep 07 1 N ov 07 1 J an 08 1 M ar 08 1 M a y 0 8 1 J ul 0 8 1 S ep 08 1 N ov 08 1 J an 09
Recommendations
It is clear that the Econtech assumption of a sustained increase in commodity prices, including steel and oil has not eventuated and indeed most commodities have experienced sharp falls in prices. Given steel and oil are key inputs to water infrastructure, it is also clear that City West Water’s capital escalation factors, based on Econtech’s forecasts, are too high and should be reduced.
Determining what the revised capital escalation factor should be is a difficult exercise. Even back in 2005 when there was clear evidence of increases in construction costs, in its 2005 Determination for Sydney Water, IPART commented that:
“Having carefully considered the evidence available to it, the Tribunal believes that while there may be short-term variations in the rate of growth in the CPI and Total Non-dwelling Construction costs, both of these price indices are likely to follow general movements in the Australian economy as a whole. With this in mind the Tribunal does not consider that the recent higher rate of growth in Total Non-dwelling Construction costs represents a long-term trend which requires special consideration in the 2005 determination period.
This was reiterated in IPART’s 2008 draft Sydney Water price decision (confirmed in the final decision), where IPART concluded:
“… there are significant uncertainties in the global equity markets and credit markets that could have a negative impact on construction activity. Construction activity (and costs) could also be dampened by anticipated further increases in domestic interest rates, which would increase borrowing costs for businesses.
On balance, IPART has decided against Sydney Water’s proposal to inflate the future capital expenditure by the construction cost index and, instead, proposes that this expenditure be escalated by the CPI.”
If a separate construction index is to be used then the issue of how that index should be determined will need consideration. The mix of input costs facing the Victorian metropolitan water businesses will be unique and an accurate index would need to consider such things as prices and parameters and weightings. Anecdotal evidence available to us suggests that the economic downturn has resulted in greater competition amongst contract maintenance and engineering/construction businesses in the water sector due to the downturn in the mining industry. This is supported by evidence from the RBA which noted in its February 2009 Statement on Monetary Policy that in the December 2008 quarter that there was “a significant fall in construction costs in Victoria”. However we
also note that this significant fall may be offset to some degree in future by the Australian Government’s stimulus package which will increase capital spending in the residential and education sectors in particular.
Given current economic circumstances and the difficulties in forecasting a new construction index, we therefore feel it is reasonable to adopt the CPI rather than a separate construction cost index as the basis for forward projections. While the CPI and a construction index will diverge over time, over the medium to longer term we believe the CPI provides the best measure of changes in input costs. Adopting CPI as the escalator in the next regulatory period also has the advantage of simplicity. If something other than CPI was used to inflate future prices, it would be necessary to identify escalators for different services and materials. Some may be forecast to rise relative to CPI, whereas others may fall relative to CPI. On balance, CPI is the best indicator to use, as it represents a bundle of goods and services and is easily accessible.
We have adopted the assumption that on average water sector construction costs will increase at the CPI – i.e. that there will be no real increase in prices. While there is arguably a strong case that increases in construction costs will be lower than CPI, a CPI-based increase reduces the risk that a below-CPI increase would provide to businesses.
Expenditure adjustment
Using City West Water’s price review template provided by the ESC, it was possible to reconstruct what its forecast capital expenditure program would have been had a single capital escalation factor of zero been applied. The capital escalation adjustment has taken account the capital expenditure brought forward for the Dunnings Road to Sneydes Road project (see section 7.5.3). There were Additional adjustments were required for four projects that had a 3.5per cent escalation in costs and these adjustments are reflected in the capital expenditure chapter.
The de-escalation of City West Water’s 2.5per cent increase results in a downward adjustment of $35.47 million over the next regulatory period. This adjustment is explained in the below table, with reference to City West Water’s original capital expenditure program (as per its Water Plan), our total revised capital expenditure program from Section 7 and our revised capital expenditure program once any escalation above CPI has been removed.
Table 5.3: Recommended capital expenditure adjustment ($m, 2008/09) 2008/09 2009/10 2010/11 2011/12 2012/13 Water Plan 90.37 139.80 159.55 109.03 61.49 Revised forecast (see section 7.6) 91.51 138.66 159.55 109.03 61.49 Revised forecast excl. escalation 88.11 133.12 148.16 98.77 54.35 Capital expenditure escalation Net change -2.26 -6.68 -11.39 -10.25 -7.14
Note: revised forecast excludes adjustment to the four projects where a 3.5per cent escalation was used
5.2.3 Operating expenditure
City West Water referred to the Econtech report and also sampled the prices in a number of recent tenders in order to determine operating cost escalation for the next regulatory period. Page 31 of City West Water’s Water Plan indicates that it applied a 2.5 per cent real increase per annum to all civil and scheduled maintenance costs.
City West Water provided a detailed list of its operating expenditure forecasts, on a line by line basis. We have identified a number of maintenance lines that would fall under either ‘civil’ or ‘scheduled’ maintenance and which are contracted out to third parties. These are:
• scheduled infrastructure maintenance (lab charges) • AMRS metering contract
• DMS metering contract
• preventative maintenance program – civil • preventative maintenance program – M&E • condition monitoring program – civil • responsive maintenance program – civil.
In our draft report we reduced City West Water’s forecast expenditure on these expenditure lines (which totalled $102 million over the next regulatory period) by removing the impact of the 2.5 per cent real escalation each year. City West Water did not respond to our draft report on this matter. Nothing the further deterioration in economic conditions since this time, and anecdotal evidence of reductions in contractor rates, we consider that our removal of this escalation
factor remains appropriate. This results in a recommended reduction to operating expenditure as per Table 5.4.
Table 5.4: Recommended operating expenditure adjustment ($m, 2008/09) 2008/09 2009/10 2010/11 2011/12 2012/13 Water Plan 24.35 24.62 25.15 25.93 26.64 Revised forecast 23.76 23.44 23.35 23.49 23.55 Operating cost escalation Net change -0.59 -1.19 -1.80 -2.44 -3.09
5.3 Labour cost increases
5.3.1 Benchmark increases
Initial business proposals
In their Water Plans, each of the businesses proposed increases above CPI for labour costs for the next regulatory period, with forecasts ranging from 1 per cent to 2.5 per cent per year. The businesses’ escalations in labour costs were determined via a number of means, including on the basis of:
• consistency with their respective EBAs and assumptions about inflation • independent forecasts of wage increases.
2008 price review for regional water businesses
In its price review which was concluded in June 2008, the ESC allowed for a 1.25 per cent real annual increase in labour costs over the regulatory period. This rate was applied as a benchmark across all businesses.
Mercer and Econtech labour cost forecasts
One of the retailers indicated that it had relied on information provided by recognised human resource consultants Mercer Human Resource Consulting when determining its proposed real annual increase in labour costs.
In a 2006 report Mercer established forecasts for base salary and employment costs for a range of ‘job families’ extending to 2008/09, with base salary increases for construction and engineering professions increasing by 6.0 per cent and 6.3 per cent (in nominal terms) respectively in 2008/09.6