COMMUNITY
DEVELOPMENT
Working Paper
FEDERAL RESERVE BANK OF SAN FRANCISCO
101 Market Street
San Francisco, California 94105
Homeownership at High Cost:
Foreclosure Risk and High Cost Loans in California
Laura Lanzerotti
Federal Reserve Bank of San Francisco
July 2006
Working Paper 2006-01
www.frbsf.org/community
Homeownership at High Cost:
Foreclosure Risk and High Cost Loans in California
A study conducted for the Federal Reserve Bank of San Francisco Laura Lanzerotti
Spring 2006
The author conducted this study as part of the program of professional education at the Goldman School of Public Policy, University of California at Berkeley. This paper is submitted in partial fulfillment of the course requirements for the Master of Public Policy degree. The judgments and conclusions are solely those of the author, and are not necessarily endorsed by the Goldman School of Public Policy, by the University of California, the Federal Reserve Bank of San Francisco, or by any other agency.
Executive Summary
The relatively low rate of mortgage default and foreclosure in California in recent years obscures the fact that many Californians have high-cost home loans that they cannot afford. High cost loans are particularly common in low-income and minority communities, suggesting that those who can least afford it are paying the most for credit. In communities where high cost lending is more prevalent, so is the prevalence of households that are defaulting on their mortgage.
Homeownership may be coming at too high a price for these households and communities.
Context
Promoting homeownership has long been a policy priority in America; increasing access to credit has been key to increasing the rate of homeownership overall, and particularly among low-income and minority households. Beginning in 1980, major changes in the financial services industry spurred growth in the subprime market.1 Subprime lenders share of the mortgage market remains relatively small, but their share has been growing rapidly. Growth in the subprime market has benefited many homebuyers who might not otherwise have been able to access the credit they needed to purchase homes; the downside to this trend is some of these households are paying more than they need to for their home loans, and are burdened with loans that they cannot afford.2
One of the key reasons for concern about subprime lending, in general, is its association with increased foreclosure risk. A number of studies have identified strong associations between the level of subprime lending and the number of foreclosure starts and actual foreclosures in an area.3 The incidence of foreclosure is in direct conflict with the vision of homeownership as an asset-building opportunity for households and a stabilizing force in communities.
Determining the extent to which there is a causal relationship between the level of subprime lending and level of foreclosure risk, and, further, the direction of that causality, is quite challenging. Lenders argue that subprime borrowers present a higher foreclosure risk, and therefore, that the higher interest rates and fees that they charge are legitimate and necessary; without these methods of mitigating financial risk, many households would not be able to get credit they need and want. On the other hand, subprime borrowers may be at greater risk of foreclosure because they are paying more for their home loans. For low income borrowers, who are spending a significant proportion of their incomes on housing costs, one can easily imagine that small increases in the interest rate of a loan can have a big effect on borrowers’ abilities to cover living expenses and keep up with their monthly payments.
1
Subprime lending refers to lending at rates that exceed the prime interest rate; subprime lenders lend to individuals with lower credit scores, generally between 680 and 575. Lenders charge subprime borrowers a “risk premium” in the form of higher interest rates and additional fees to compensate for greater perceived risk.
2
Some researchers have estimated that as many as 30 to 50 percent of subprime borrowers could have qualified for prime loans at lower cost. Carr, J. and Kolluri, L. (2001), p. 6.
3
Foreclosures are the ultimate, but not inevitable, ending to a chain of events that is set in motion when a household fails to make its mortgage payments.
California provides an interesting opportunity for investigating patterns of high cost lending, foreclosure risk, and the relationship between the two phenomena for several reasons. First, rising prices in the housing market have not stifled Californians’ interest in becoming
homeowners. Many households have entered the housing market by relying on subprime and high cost loans, and they are spending significant portions of their income on housing. Further, in recent years, the mortgage delinquency and foreclosure rate in California have been at historic lows. The general consensus among researchers is that, within California, rising home prices coupled with historically low interest rates as well as the emergence of “exotic” mortgage products (those with teaser rates, interest-only options, or other options for lowering initial monthly payments) have enabled more households who entered into unaffordable home loans to avoid foreclosure. Among those who anticipate a slow down in the California housing market, this is cause for concern. In the last few months the number of notice of mortgage defaults has been rising in most areas of the state. While it is too early to say whether this trend will continue, it does raise critical questions about the need for addressing foreclosure risk and high cost
lending before homeowners across the state find that they are unable to afford their monthly payments, yet are not able to sell or refinance to get out from under the weight of their home mortgage.
Research Scope
This research focuses on three counties in California – Alameda, Fresno, and Riverside – comparing census tracts based on the prevalence of high cost lending,4 Notices of Default,5 and socio-economic and demographic characteristics. Drawing on data from the Home Mortgage Disclosure Act (HMDA) 2004 dataset for these three counties, records of Notices of Default from January 2005 through February 2006, and data from the 2000 Census, the goal of this analysis is to investigate three key questions:
1) Which census tracts have the highest rates of high cost loans and what are the characteristics of these tracts?
2) Which census tracts have the highest levels of foreclosure risk and what are the characteristics of these tracts?
3) Controlling for key socio-economic characteristics that are associated with credit risk, to what extent is high-cost lending associated with foreclosure risk?
Key Findings
High Cost Loans
• As a percent of loans originated in 2004, high cost loans accounted for 16 percent of loans in Fresno, 12 percent in Riverside, and 4.9 percent in Alameda County.6 In 2004, Fresno and
4
This research focuses on a subset of the subprime market – loans that are “high cost.” For the first time in 2004, loans are identified as “high cost” in the Home Mortgage Disclosure Act (HMDA) dataset if the spread between the interest rate on the loan and the prime rate exceeded a specified amount (i.e. 3% for first-lien loans and 5% for second-lien loans).
5 Notices of Default inform households that they are delinquent on their mortgage and that the lender may pursue legal recourse; Notices of Default are public records, which are available at County Clerk Recorders’ offices.
6
Riverside County had a larger share of high cost home purchase and refinance loans as compared to the nation as a whole, and Alameda had a lower rate.7
• There are significant differences between census tracts where high cost lending is more prevalent and those in which high cost loans are a small percentage of lending activity. For the study sample as a whole, the percent of loans that are high cost is correlated with all but one of the census tract characteristics tested, including: the percent of residents who are non-white, below the poverty level, with less than a college diploma, unemployed, Hispanic, and recent immigrants, as well as with census tracts’ median household income and the median value of selected housing units.8 For each of these, there is a positive relationship, meaning the percent of high cost loans increased with every characteristic explored except for median household income and the median value of housing units; as median income and median home values increase, the percent of high cost loans decrease.
Foreclosure Risk
• The fourth quarter of 2005 marked the end of a nine-year trend for California in declining Notices of Default; while it is too early to determine if this is the beginning of a new trend, the number of Notices of Default in the state increased by nearly 16 percent in the final months of 2005. Riverside County had the highest actual number of Notices of Default in the fourth quarter of 2005. Fresno experienced a 20.5 percent increase in the number of Notices of Default; Alameda County was one of only four counties where the number of Notices of Default continued to decline.
• Like high cost lending, foreclosure risk9 is concentrated in specific areas. For example, areas with higher median incomes and median home values have lower levels of foreclosure risk; communities with higher percentages of non-white residents and residents with less than a college diploma have higher levels.
Relationship between Neighborhood Characteristics, High Cost Loans, and Foreclosure Risk • There is a significant relationship between the prevalence of high cost loans and the
prevalence of Notices of Default in the census tracts studied. Negative binomial regression models, in which socio-economic and demographic characteristics such as median home value, number of households, number of loans in 2004, percent of residents who are non-white, and residents’ median income are controlled, confirm that this relationship remains statistically significant and the strongest relationship among those tested. Considering each county separately, the results are consistent for Alameda, Fresno, and Riverside County.
Policy Implications and Recommendations
Findings from this analysis confirm that there are at least two policy problems to be addressed. First, high cost lending is concentrated in specific communities within the three county area – these include census tracts with higher percentages of low-income and minority populations, as well as areas with lower median home values and higher percentages of residents without a
7
In 2004, nationally, 11.5% of the home purchase loans were high cost loans and 15.5% of refinance loans were. Federal Reserve Bulletin, p. 364.
8
For this analysis, “selected” housing units refers to owner-occupied housing units with a mortgage.
9 Notices of Default are used as a proxy for foreclosure risk. Areas with a higher rate of Notices of Default (a larger number in proportion to the total number of owner-occupied housing units with a mortgage) are considered to have a higher level of foreclosure risk.
college diploma. Second, within the three counties, there is a relationship between high cost lending and foreclosure risk. While Notices of Default remain relatively rare in these three California counties, the fact that they are focused in neighborhoods with higher rates of high cost loans is cause for concern.
Based on a number of different policy options considered, three are advanced as strategies to address high cost lending and foreclosure risk in California: 1) make pre-purchase counseling available to every consumer who accesses a high cost loan; 2) learn from the experiences of other states that have restricted predatory and high cost lending; and 3) continue to monitor and assess high cost lending and foreclosure risk in California.
Given that there is still debate over the effectiveness of state laws that restrict high cost lending, particularly the extent to which these laws have the negative unintended consequence of limiting subprime borrowers’ access to credit, there is reason to proceed with caution in enacting new restrictive legislation in California. Further, there is little perceived urgency to enact new policies in the state, due to the still relatively low rate of default and foreclosure in California.
As a next step, policymakers should consider approaches to strengthening borrower protections for loans that are already covered by the state’s high cost lending laws. By requiring mandatory homebuyer counseling for those accessing high cost loans, policymakers could make strides toward further protecting borrowers who receive high cost loans without concern that there will be negative unanticipated consequences associated with further limiting lending practices in the state. At the same time, it is critical to continue to monitor patterns of high cost lending in the state as well as changes in the rate of Notices of Default.
Introduction
The relatively low rate of mortgage default and foreclosure in California in recent years obscures the fact that many Californians have high-cost home loans that they cannot afford. High cost loans are particularly common in low-income and minority communities, suggesting that those who can least afford it are paying the most for their loans. In communities where high cost lending is more prevalent, so is the prevalence of households that are defaulting on their mortgage. Homeownership may be coming at too high a price for these households and communities.
At the federal, state, and local level, there are a number of policy efforts currently underway to curb high cost lending. Most of these policy efforts are framed as “anti-predatory lending” campaigns and a key rationale for these efforts is the association between high cost lending and increased foreclosure risk.
Within the House of Representatives, two bills related to high cost lending are being debated. Ney-Kanjorski (H.R. 12945) would weaken existing federal law restricting high cost lending by raising the threshold for loans that are covered by the law, and it would prohibit states from regulating mortgage lenders by preempting state laws that have placed more stringent restrictions on lending practices. Miller-Watt-Franklin (H.R. 1182) would amend existing federal law by increasing requirements and restrictions on high cost loans. Within at least four states, legislators are considering enacting additional protections for borrowers: Rhode Island, Maryland, Illinois, and Ohio.
California provides an interesting opportunity for investigating patterns of high cost lending, foreclosure risk, and the relationship between the two trends for several reasons. Rising prices in the housing market have not stifled Californians interest in becoming homeowners; many have entered the housing market by relying on subprime and high cost loans, and they are spending significant portions of their income on housing costs. While recent years have seen historic low rates of loan delinquency and foreclosure, this may obscure the fact that many homeowners have high cost home loans that they cannot afford. Within the context of California’s strong housing market, homebuyers who find themselves unable to afford their mortgage payments are able to sell or refinance. As a result, the equity-stripping effects and problematic aspects of high cost and predatory lending are masked. If the housing market cools, as many have predicted, numerous households may face much greater risk of losing their greatest asset.
In recent months, the numbers of Notices of Default10 have been rising in most counties across California. While it is too early to say whether this trend will continue, it is worth examining which households and areas are most at risk of foreclosure. To the extent that there are discernible patterns in terms of which communities are affected, these areas may serve as the proverbial canaries in the coalmine, indicating where households may face the most trouble in the event of a slowdown in the California housing market.
10
A Notice of Default (NOD) is a formal notice to a borrower declaring that they have defaulted on their mortgage and that legal action may be taken. Notices of Default are recorded at the County Clerk-Recorders Office.
Lastly, questions about high cost lending and foreclosure risk have immediate policy relevance for California. At the federal and state level, a variety of new legislation is being considered which would change restrictions on lending practices that are deemed high-cost or predatory. In California, there have been several recent efforts at the local level (in Oakland and Los Angeles) and at the state-level to develop new legislation that would curb specific types of high cost lending practices. For this reason, it is valuable to explore the relationship between foreclosure risk and high cost loans to determine the extent to which there is a policy rationale for placing stronger restrictions on lending practices within the state.
This paper is comprised of three main chapters. The first chapter provides background
information critical to understanding why high cost lending and foreclosure risk are important policy issues. It addresses the importance of homeownership and the history of policy efforts to increase the rate of homeownership, and it describes the role of credit in expanding
homeownership and recent changes to the mortgage market that have expanded access to credit for many. The chapter also provides a frame for understanding why expansion in the subprime mortgage market may be cause for concern.
The second chapter provides an empirical analysis of high cost lending and foreclosure risk in California. The analysis focuses on three California counties – Alameda, Fresno, and Riverside. By analyzing patterns of high cost lending and foreclosure risk at the census tract level, new information is provided about the characteristics of communities where high cost lending is most prevalent and where there are the greatest number of Notices of Default; finally data are
analyzed to assess the relationship between high cost lending and increased foreclosure risk at the census tract level.
The final chapter evaluates several policy options for addressing high cost lending and foreclosure risk in California and provides recommendations.
Appendix A includes information on the data sources used for the empirical analysis; Appendix B provides further detail on how various policy options were evaluated.
Chapter 1
Borrowing for the American Dream:
Expanding Homeownership and the Rise of Subprime Lending
The Importance of Homeownership
Promoting homeownership has been a policy priority in America since the Great Depression;11 and a number of policy efforts at the federal, state, and local level have been directed toward this end. Homeownership is thought to benefit not only individuals and families but also
communities and the nation as whole. For most Americans, homes are their greatest assets, and homeownership is the strategy by which most Americans are able to build wealth. Home equity – alone – accounts for 45.2 percent of the net worth for all households in the United States.12 The persistent wealth gap between White and Black Americans can be attributed, to a great extent, to differences in the rates of homeownership within these two groups. As of 2004, the
homeownership rate for non-Hispanic white households was more than one and one-half times the rate of black households.13 Increasing the rate of homeownership within minority
communities is often seen as a key strategy to narrow the wealth divide.
Beyond the wealth-building potential of homeownership, researchers have found that
homeowners have a stronger sense of well-being and financial security.14 Homeownership also appears to have an effect on children’s well-being and academic achievement, for example, parental homeownership is associated with lower dropout rates and teen pregnancy.15 Children of homeowners are also more likely to become homeowners themselves.16
Homeownership is also considered to have direct community benefits, by helping to stabilize and improve neighborhoods. In one study that tested the relationship between homeownership rates and stability, researchers found that homeowners tend to stay in their properties longer than tenants do. Furthermore, higher rates of homeownership are associated with higher property values within an area. One study found that each 1 percent increase in the homeownership rate within an area was associated with a property value increase of $800.17 Residences that are owner-occupied contribute to an area’s “social capital”18 – homeowners are more likely to be involved in their communities and engage in more informal interaction with their neighbors than are renters.
Policy efforts to increase the homeownership rate and increase opportunities for minority and low-income Americans to become homeowners are in step with what most Americans and Californians want for themselves. According to a recent survey by the Public Policy Institute of
11
The Urban Institute and The Brookings Institution. (2003) “Rethinking Local Affordable Housing Strategies: Lessons from 70 years of Policy and Practice,” p. 39.
12
Ibid, p. 58. 13
In 2004, the homeownership rate of non-Hispanic white Americans was 75.7 percent; among Black Americans it was 49.5 percent. Ibid, p.38
14
Rossi, “The Social Benefits of Homeownership,” p. 13. 15
Haurin, Donald. “The Private and Social Benefits of Homeownership,” p. 13. 16 Ibid.
17
Rohe, “Homeowners and Neighborhood Stability,” p. 66 18
California (PPIC), many Californians share the dream of becoming homeowners; “nearly 90 percent of renters in California hold onto the hope of being homeowners someday.”19
The homeownership rate in the United States has been increasing. From 1950 to 2002, the homeownership rate grew from 47.8 percent to an all-time high of 67.9 percent.20 While most of those who became homeowners during this time were in white and middle- and upper-income households, in recent years, there has been a rapid increase in the rate of homeownership within minority and low-income homeowners. Between 1993 and 1998, home buying among Hispanics increased by 87 percent; among African-Americans it increased by 72 percent. At the same time, homebuying among low and moderate income households also increased by 64 percent.21
The homeownership rate in California has lagged behind that of the rest of the country. In part, this is a reflection of the fact that the state has the most expensive housing stock in the nation.22 In 2004, the homeownership rate was second lowest in the nation and 10 percent lower than the national rate (59.7 percent and 69.0 percent, respectively). Like the rest of the country, however, the homeownership rate in the state has risen to its highest level ever in recent years. Between 2003 and 2005, the homeownership rate in California rose by 2-percentage points, a greater increase than was experienced in all but a few other states.23 This is true, despite the fact that there is a growing gap between incomes and housing prices. As of December 2005, the median priced single-family home ($568,890) was affordable for only 14 percent of California’s households.24 Clearly, scores of families in the state are finding ways to “afford the unaffordable.”25
The Role of Credit in Affording the Unaffordable
Nearly all Americans borrow money in order to purchase a home, therefore, increasing access to credit has been key to increasing the rate of homeownership overall, and particularly among low-income and minority households. From 1993 to 2001, the share of home purchase loans made to lower-income households or households living in lower-income areas across the United States increased steadily, from 31 percent to 35 percent in 2001.26 During the same period, home purchase lending to white borrowers grew by just 29 percent, while lending to Hispanic
borrowers increased by 159 percent and African-American borrowers increased by 93 percent.27 Changing lending practices have enabled some Californians to become homeowners. In recent years, nontraditional mortgages have created opportunities for new homebuyers. Homebuyers who take out adjustable rate and/or interest-only mortgages are able to borrow more money than they would with a traditional 30-year fixed fully amortizing mortgage. Most new homebuyers are relying on adjustable rate loans, despite the fact that interest rates have been at historic lows during recent years; this enables them to have lower initial monthly payments, while trading off
19
PPIC, “Statewide Survey November 2004: Special Survey on Californians and Their Housing,” p.9 20
The Urban Institute and The Brookings Institution, p. 37 21
Apgar, W. and Calder, A. “The Dual Mortgage Market: The Persistence of Discrimination in Mortgage Lending,” p. 102 22
PPIC, “California’s Newest Homeowners: Affording the Unaffordable,” p. 11. 23
David Streitfeld, “'Interest-only' loans may be boon — or bust — for Calif. Homebuyers” 24
Department of Housing and Community Development, “California’s Deepening Housing Crisis, February 15, 2006,” p. 7 25
“Affording the Unaffordable” was the subtitle of a recent publication by the Public Policy Institute of California, “California’s Newest Homeowners: Affording the Unaffordable.”
26
Apgar W. and Calder, A. p. 102 27
long-term stability in their monthly housing costs. Furthermore, many of these adjustable rate mortgages are also interest-only loan products. According to one study conducted for the Los Angeles Times, as recently as 2001, interest-only loans constituted fewer than 2 percent of home purchase mortgages; as of 2004, 48 percent of the home purchase loans in California were interest-only.28
There has also been substantive growth in the percent of loans that require no down payment. In 1990, only 3 percent of conventional home purchase loans had down payments of 5 percent or less; as of 2004, 16 to 17 percent of loans had this characteristic.29 In some cases lenders are allowing higher debt-to-income ratios, enabling homebuyers with lower incomes to enter the housing market. Rather than limiting housing costs to no more than 30 percent of income, lenders are commonly qualifying homebuyers for loans that lead to housing costs of 40 percent of their income, and, in some cases, even 50 percent.30 Rising home prices have not only made these borrowing strategies necessary for many households looking to enter the housing market, it has also encouraged many to discount the risk that they are assuming by using these types of mortgage products; they are gambling that they will gain equity in their homes not by paying down the principal on their loan but because home prices will continue rise as well as that their incomes will rise to compensate for pending increases in their monthly payments.
Expansion of the subprime market has also brought substantial change in the housing market, by increasing access to capital for many who present higher credit risks. Prior to 1980, federally insured banks and thrifts dominated the home mortgage market. Demand for credit generally exceeded supply, so that only those with the best credit histories and highest ability to pay were able to borrow funds. Beginning in 1980, major changes in the financial services industry spurred growth in the subprime market; these changes included the securitization of home mortgages and the creation of new mortgage products.31 This increased the flow of capital to the mortgage market so that there was less competition among borrowers for credit; and it enabled lenders to create mortgage products that hedge their risk. Lenders charge subprime borrowers a “risk premium” in the form of higher interest rates and additional fees.
Subprime lenders share of the mortgage market remains relatively small, but it has been growing rapidly. In 1993, subprime lenders accounted for 1 percent of home purchase lending and less than 5 percent of all mortgage originations; by 2001, subprime lenders accounted for more than 6 percent of all home purchase lending and more than 13 percent of all mortgage originations. Nationally, home purchase loans by subprime lenders increased by 760 percent from 1993 to 1998, compared to 38 percent for prime lenders.”32There was an even larger increase in lending by subprime firms in the refinance market, where subprime lenders increased their loans by 890
28
Streitfeld, D, “'Interest-only' loans may be boon — or bust — for Calif. Homebuyers.” Los Angeles Times (April 9, 2005). 29
Joint Center for Housing Studies of Harvard University. (2005). “The State of the Nation’s Housing 2005,” p. 17. 30
PPIC, “CA’s Newest Homeowners,” p. 13 31
The Depository Institutions Deregulation and Monetary Control Act (DIDMCA) of 1980 pre-empts state usury ceilings on any “federally related mortgage loan” secured by a first lien on residential real estate. In 1983, the Alternative Mortgage Transaction Parity Act (AMTPA) pre-empts state laws that restrict mortgage financial arrangements such as balloon payments, negative amortizing loans, and variable-rate loans. Goldstein, D. (1999), 23.
32
Subprime Origination Growth (in Billions) $65.0 $96.8 $124.5 $150.0 $160.0 $138.0 $173.3 $213.0 $332.0 $0 $50 $100 $150 $200 $250 $300 $350 1995 1996 1997 1998 1999 2000 2001 2002 2003
Source: Inside Mortgage Finance 2004 Annual DataBook.
B&C originations are those with less than an A quality secured real estate loan.33
percent, at the same time that refinances by prime lenders grew by only 2.5 percent.34 In terms of loan volume, subprime loan originations grew from $35 billion in 1994 to $332 billion in 2003.35
A Closer Look at Subprime Lending
Subprime lending has increased access to credit for many who might not otherwise be able to get it. If the upside of the growth of the subprime market is that it has enabled many households to access capital, either to become homeowners or to utilize the assets in their homes to pay for other expenses, the downside that is some of these households are paying more than they need to for their home loans.
Some have characterized the mortgage market as a dual market – comprised of the prime and the subprime market – others have divided it into three – prime, “legitimate” subprime, and
predatory.36 Within this latter characterization, the prime market caters to low-risk borrowers, the majority of whom are middle- and upper-income and white. Most of the lenders in this market are traditional banks and thrifts.
The “legitimate” subprime market provides credit to individuals who present more risk, presumably due to their weaker or impaired credit histories. Most of the subprime lenders are nonbank entities, whose lending has been enabled by the widespread securitization of home mortgages. They are able to originate loans and sell them on the secondary market in order to get capital to make new loans. Subprime mortgages cost more for a variety of reasons. Origination costs are higher because loan amounts tend to be smaller; subprime loans are also harder to package for the secondary market because they are less standardized products than prime loans;
33
Data drawn from Ho, G. and Pennington-Cross, A. (2006), p.6. referencing information provided by Inside Mortgage Finance 2004 Annual Data Book.
34 Ibid. 35
Ibid, p. 108. 36
and they also present higher risk to investors. Subprime borrowers are more likely to prepay their mortgage and default on their loans, and these are accounted for in the higher price of credit.
The predatory market is somewhat more difficult to define. There is no bright line dividing the “legitimate” subprime market from the predatory loan market.37 Whether or not a loan is
predatory depends on the characteristics of the borrower, and the extent to which she will be able to repay the loan and is fully aware of the terms of the loan. It also depends on the characteristics and practices of the lender: Was the lender transparent in disclosing the terms and fees associated with the loan? Did the lender steer the borrower toward a loan that was not in her best interest? In general, does the lender try to take advantage of borrowers’ lack of financial sophistication, for example, by targeting specific groups such as the elderly, minorities, and households with limited English proficiency? Predatory lenders may fit one or more of these characterizations.
The predatory loan market is distinct from the “legitimate” subprime market in that lenders are not only charging higher interest rates and fees to compensate for the higher risk presented by borrowers, they are charging rates and fees that enable them to extract economic rent from consumers. Some of the practices commonly associated with predatory lending are: structuring loans so that they are not in the best interest of the borrower; rapidly “flipping” loans;38 charging exorbitant fees, and using fraudulent or deceptive practices to target and lure borrowers. Most of the borrowers in the subprime market are those with blemished credit histories, and include those who, because of discrimination or preference are cut off from the mainstream financial and credit markets; lenders are predominantly nonbank entities that are minimally regulated by the FTC.
Federal policy changes in the last two decades have generally had the effect of loosening
restrictions on lenders, prompting growth in subprime lending, and, some would say, opening the door to predatory lending practices. On the other hand, two key federal policies provide for monitoring of and restrictions to some types of very high cost loans. The primary federal law pertaining to high cost lending is the Home Ownership and Equity Protection Act (HOEPA), which amended the Truth in Lending Act (TILA) in 1994. HOEPA restricts refinancing and home equity loans which meet one of the following criteria: 1) the annual percentage rate (APR) on the loan exceeds the rate on Treasury securities of comparable maturity by more than eight percentage points if it is a first-lien loan and by more than ten percentage points if it is a second-lien loan; or 2) the fees and points payable by the consumer at or before closing exceed the greater of 8 percent of the loan amount or $528.39
HOEPA “covered” loans are restricted from having certain terms such as prepayment penalties, balloon payments for loans with terms of less than five years, and negative amortization. Further, the law requires lenders to disclose information to help borrowers understand the terms of their loan, and it prohibits lenders from making loans without regard to the borrower’s ability to repay the loan. As with other consumer protection laws, HOEPA overrides weaker state laws but allows for states to enact stricter laws.
37
Researchers generally agree that while not all subprime loans are predatory, most predatory loans are in the subprime market. 38
“Loan flipping” refers to lenders who encourage borrowers to rapidly refinance loans. This practice results in equity-stripping because refinancing costs money and often these charges are refinanced into the amount of the loan.
39 HOEPA does not pertain to home purchase loans, reverse mortgages, or home equity lines of credit. The $528 amount is for 2006 and is adjusted annual by the Federal Reserve Board based on changes to the Consumer Price Index.
HOEPA is criticized by many who are concerned about predatory and high cost lending because it does not apply to many types of loans, including home purchase loans, open-ended home equity loans, and reverse mortgages. Further, the threshold at which a loan is covered by HOEPA is extremely high, so that many lenders are able to profit off of very high cost loans that are not subject to HOEPA.
The Home Mortgage Disclosure Act (HMDA), enacted in 1975, is also a centerpiece to federal legislation pertaining to subprime lending. HMDA specifies the information that lenders are required to provide on loan applications and originations, and it has been greatly expanded in recent years, both in terms of the institutions that are required to participate and in the
information that they are required to submit. As of 2004, all loans that are covered by HOEPA are identified in the HMDA dataset. Furthermore, as of 2004, lenders are required to report pricing information for loans that are “high cost” at time of origination.40 Systematic collection of information on this subset of subprime lending means that advocates, researchers,
policymakers, and members of the public can put pressure on lenders and hold them accountable for their lending practices.41
Economics and Subprime Lending
While there are reasons to be concerned about the rapid rise of subprime lending, before assuming that all higher cost loans are problematic, it is useful to review why some borrowers are charged more for credit than others. The cost of credit is dependent on several different factors. First, the cost of funds is a significant determinant in the overall cost of prime rate loans as well as subprime and higher cost loans. Because many lenders sell loans to the secondary market, prices offered for mortgage-backed securities can also affect the pricing of loans to borrowers. Theoretically, lenders price loans based on the expected duration of the debt, credit risk, overhead costs, and servicing costs. Loans that involve greater credit risk cost more. A function of the creditworthiness of the borrower, credit risk is “a function of the equity in the home securing the loan, and the likelihood that proceeds of a foreclosure sale of the home will satisfy the obligation if default occurs.”42 The risk of prepayment is the risk associated with the possibility that a borrower will repay the loan before the term is over, so that lenders’ expected stream of interest income is interrupted. . Some loans cost more than others for lenders to underwrite, particularly loans that are provided without documentation of the borrower’s employment or income. Finally, servicing costs include costs associated with monitoring
accounts, particularly in the case of borrowers who default on their mortgage. In some cases, and particularly in the subprime market, borrowers obtain loans through brokers. Brokers have an incentive to get borrowers to agree to loans that are higher prices than are warranted. Through “yield spread premiums,” brokers are able to benefit if borrowers that qualify for lower priced loans agree to loans at higher cost.
40
Loans are identified as “high cost” in the Home Mortgage Disclosure Act (HMDA) dataset if the spread between the interest rate on the loan and the prime rate exceeded a specified amount (i.e. 3% for first-lien loans and 5% for second-lien loans). 41 Wells Fargo has recently been a target of criticism for its subprime lending practices. See, for example,
http://sanfrancisco.bizjournals.com/sanfrancisco/stories/2006/04/24/daily39.html 42
Evidence of Discrimination and Market Inefficiencies
Patterns in who gets subprime loans confirm concerns that that loan pricing is not entirely based on borrowers’ risk-characteristics. Today, the problem of redlining, “the systematic denial of mortgage credit”43 to individuals and groups in low-income and minority neighborhoods has shifted; advocates are concerned less about access to credit and more about access to credit on fair and equal terms.
In a study that drew upon 1998 HMDA data,44 researchers at HUD found subprime loans were three times more likely in low-income neighborhoods than in high-income areas.45 This is despite the fact that lower-income households do not necessarily present higher credit risks.46 Such findings have led researchers to believe that the greater level of subprime lending to lower-income households is not entirely justified based on credit quality.47
Subprime lending is also concentrated within minority and black neighborhoods, in particular. The HUD study found that subprime loans were five times more likely in black neighborhoods than in white neighborhoods. Homeowners in black neighborhoods, regardless of their income level were far more likely to get subprime loans than homeowners in white neighborhoods. Homeowners in high-income black neighborhoods were six times more likely than homeowners in high-income white neighborhoods to have subprime loans and twice as likely as homeowners in low-income white neighborhoods.48 The level of subprime lending to black households far exceeds the measured level of credit problems experienced by these households. A 1999 Freddie Mac study found that black households had roughly twice the credit problems as comparable white households, yet were four times as likely to rely on subprime loans for mortgage credit.49
A large percentage of subprime borrowers are paying more for their home loans than they need to be based on the credit risk they present to their lenders; and many of these borrowers are low-income and minority households. One researcher estimated that between 15 and 35 percent of subprime borrowers could have qualified for a prime rate loan; Fannie Mae and Freddie Mac have estimated that between 30 and 50 percent could.50
Why would so many borrowers who could qualify for a lower rate end up paying more for their mortgage? Researchers cite reasons ranging from borrowers’ lack of financial sophistication to discrimination by lenders. On the borrower side, a number of different factors – beyond credit risk – are related to the type of loan consumers are likely to obtain. These include factors such as: search behavior, including susceptibility to aggressive sales tactics; age; level of education; and level of familiarity with different types of mortgages. Further, dispelling notions that the
43
Joint Center, “25 years of CRA,” p. 121 44
Congress enacted HMDA in 1975; originally, HMDA only applied to depository institutions and their direct subsidiaries, but is has expanded over time to include “most mortgage lending institutions, including savings and loans, independent mortgage banking companies, and mortgage banking subsidiaries of commercial bank holding companies. Today, HMDA reporting captures most mortgage market transactions.” The Urban Institute and the Brookings Institution, p. 44.
45
Carr, J. and Kolluri, L. (2001), p. 6 46 Ibid. 47 Ibid. 48 Ibid, p. 7. 49
Carr, J. and Kolluri, L. (2001), p. 7 50
subprime market is a steppingstone into the prime market, a borrowers’ “previous type of loan is a primary determinant in whether a borrower got a prime or subprime loan.”51 While one might think that subprime borrowers who are able to purchase a home and make their monthly
mortgage payments would be able to transition to a lower cost loan once they had built equity in their home and established a track record for making regular payments, this does not appear to be borne out by reality.
There is a substantial information asymmetry between lenders and borrowers. While lenders’ are required to disclose information about the terms and details of the loan at the time of closing, the stack of paperwork that has to be reviewed and signed by borrowers is incomprehensible and overwhelming to many. As one researcher characterized it, if every document was actually read by the borrower, the closing process would take more than a day.
On the lender side, there is evidence of rent-seeking and discriminatory behavior. One study found that “roughly one-half of the interest rate premium paid by subprime borrowers – 100 basis points – cannot easily be explained by the higher levels of risk associated with these types of loans.”52 This estimate did not include origination points and fees, which also tend to be higher for subprime borrowers. Researchers concluded this was evidence of “possible inefficiency in the subprime sector.”53
Numerous studies have documented the fact that different types of lenders specialize in different market segments. Subprime lenders tend to service borrowers in minority and low-income communities, and prime lenders provide credit to higher income, white borrowers. This segmenting has led some to characterize mortgage lending to lower-income and minority communities “as an isolated line of business, in which the focus is on the short-term transaction and associated fees.54
High Cost Loans and Foreclosure Risk
One of the key reasons for concern about subprime lending is its association with increased foreclosure risk. Determining the extent to which there is a causal relationship between subprime lending and foreclosure starts, and, further, the direction of that causality, is quite challenging. Lenders argue that subprime borrowers present a higher foreclosure risk, and therefore, higher interest rates and fees are a legitimate approach to mitigating lenders’ financial risk. On the other hand, subprime borrowers may be at greater risk of foreclosure because they are paying more for their home loans. For low income borrowers, who are paying a significant proportion of their incomes on monthly housing costs, one can easily imagine that small increases in the interest rate of a loan can have a big affect on borrowers’ abilities to cover living expenses and keep up with their monthly payments. While some lenders may be willing to extend a loan with a high risk of default, this may not be in the individual homebuyer’s or the general public’s interest.
A number of studies have identified strong associations between the level of subprime lending
51
Courchane, M., Surette, B. and Zorn, P. (2004), p. 375. 52 Courchane, M., Surette, B. and Zorn, P. (2004), p. 375. 53
Lax, H., Manti, M., Raca, P. and Zorn, P. (2004), p. 369. 54
and the number of foreclosure starts and actual foreclosures in an area. The threat of foreclosure is in direct conflict with the vision of homeownership as an asset-building opportunity for households and a stabilizing force in communities. Borrowers are most directly affected by costs such as the loss of their down payment and any paid principal; penalties and fees charged during the period of delinquency and default; and legal fees associated with the foreclosure process. Indirect costs include increased future credit costs as a result of diminished credit quality and moving expenses. Borrowers may also suffer from non- pecuniary costs such as the “emotional and physical stress of managing the foreclosure process…reduction in socioeconomic status; and negative effects on children in households forced to move as a result of foreclosure.”55
Foreclosures also affect neighbors – property owners, renters, and businesses – located in close proximity. Indirect costs borne by neighbors include such things as loss of rent and reduced sales by local businesses.56 Foreclosures can have a negative impact on local property values and raise mortgage interest rates for future borrowers. Higher rates of foreclosure are also associated with increased crime rates.57 Researchers studying FHA (Federal Housing Administration)
foreclosures in Minneapolis estimated average city costs per foreclosures to be $27,000 and neighborhood costs of $10,000.58 In a study of foreclosures in Chicago in 1997 and 1998, researchers’ most conservative estimate of the neighborhood effect of each conventional
foreclosure was a 0.9 percent decline in property value. They estimated that the cumulative effect of 3,750 foreclosures in 1997 and 1998 was that nearby property values were reduced by a total of more than $598 million, for an average single-family property value effect of $159,000 per foreclosure.59
55
Apgar, W. and Duda, M. (2005). p. 9 56
Ibid. 57 Ibid. 58
Immergluck, D and Smith, G. (April 7, 2005), p. 4 59
Chapter 2:
High Cost Homeownership in California
Subprime and High Cost Lending in California
Many California homeowners have subprime and high cost loans. Based on a review of SEC filings, one policy advocacy group estimates that California homeowners hold 25-50 percent of the nation’s subprime loans.60 In 2004, twenty percent of the high-cost loans61 originated nationally went to California homebuyers; these borrowers received an estimated $47.48 billion in high-cost loans. In total, California homeowners received 264,348 higher-cost loans.62
Californians with high cost loans are paying a significant amount more on a monthly basis than they would be with a prime rate loan. For example, in 2004, according to Freddie Mac, the average interest rate on a 30-year fixed rate home loan was 5.84%.63 The average higher-cost home loan in California carried an Annual Percentage Rate (APR) of approximately 9.81%. Comparing a borrower who qualifies for a prime loan of $275,000 and a high-cost loan, the borrower with the high cost loan would pay “$691.76 more per month…and $249,035.95 more in interest payments over the life of the loan” than a borrower with a prime loan.64
A study of recent homebuyers conducted by the Public Policy Institute of California confirms that more Californians have chosen to become “house poor.” Forty percent of households with mortgages in the state, and 52 percent of recent homebuyers pay more than the HUD
recommended guideline of spending 30 percent of their income on housing costs. Twenty percent spend more than half of their income on their housing costs.65 Among low- and
moderate-income homebuyers, three-quarters are spending more than 30 percent of their incomes and one-third are spending more than 50 percent of their incomes on housing costs. As a result, when these households face an unanticipated or emergency expense, they are likely to have little funds available to cover these costs.66 These researchers conclude, “what is new in the latest run-up of California home prices appears to be the financial degree to which Californians are willing to go to buy a house and the willingness of financial institutions to accommodate that desire.”67 For those who anticipate a slowdown in the California housing market, this information is cause for concern. Where is the tipping point at which households, particularly those with high cost loans, will find they cannot keep up with their mortgage payments?
60
Stein, K. (2005), p.8 61
Loans are identified as “high cost” in the Home Mortgage Disclosure Act (HMDA) dataset if the spread between the interest rate on the loan and the prime rate exceeded a specified amount (i.e. 3% for first-lien loans and 5% for second-lien loans). 62 Stein, K. (2005), p. 8 63 Ibid, p. 8. 64 Ibid, p. 9.
65 Johnson, H. and Bailey, A. (2005) p. 11 66
Ibid, p. 12 67
Foreclosure Risk in California
Current low rates of loan delinquency and foreclosure in California may obscure the fact that many homeowners have high-cost home loans that they cannot afford. Within California, a relatively small proportion of families and neighborhoods have been threatened by foreclosures in recent years. The end of 2003 marked a nine-year low in the number of Notices of Default68 in the state of California. California is in the lowest-risk category with regard to the rate of serious delinquency compared to the rest of the nation; among subprime borrowers, only 1.05 percent had serious delinquencies as compared to rates of between 7.5 and 10.37 percent in states such as South Carolina, Indiana, and Ohio.69
The general consensus among researchers is that, within California, rising home prices coupled with historically low interest rates as well as the emergence of “exotic” mortgage products (those with teaser rates, interest-only options, or other options for lowering initial monthly payments) have enabled more households who entered into unaffordable home loans to avoid foreclosure. Some of these households do so by selling a home that has appreciated enough to enable them to pay off their loan; others refinance, taking out new loans that are, at least in the short-term, more affordable. This means these borrowers either sold their home before they paid off their
mortgage, or they refinanced. Unlike foreclosures, which clearly signal trouble for households and communities, it is unclear how to interpret data on the prevalence of mortgage prepayment and refinancing. This is because it is impossible to separate those homeowners who willingly prepaid their loan from those who did so to avoid foreclosure. Nonetheless, it is reasonable to assume that some sizeable number of California homeowners has been forced to refinance or sell their homes to avoid defaulting on their mortgage. While these events have a less dramatic effect on households and neighborhoods than foreclosure, these outcomes can also have
wealth-stripping effects. With the anticipated downturn in California’s housing market, these households may face the even more devastating consequence of defaulting on their mortgage and losing their home to foreclosure.
This study provides an opportunity to examine the relationship between high cost lending and foreclosure risk in three counties in California at this time, when Notices of Default are at a historic low and while high cost lending is on the rise. Evidence that high cost lending and foreclosure risk are concentrated in specific areas now can provide an early warning of which neighborhoods and homeowners are most likely to be at risk if the housing market changes significantly.
68 A Notice of Default is a formal notice to a borrower declaring that a default has occurred and that legal action may be taken. Notices of Default are recorded at the County Clerk-Recorders Office.
69
This research seeks to answer several distinct questions:
1. Which census tracts have the highest rates of high cost loans and what are the characteristics of these tracts?
2. Which census tracts have the highest levels of foreclosure risk and what are the characteristics of these tracts?
3. Controlling for key socio-economic characteristics that are associated with credit risk, to what extent is there a statistically significant relationship between the prevalence of high-cost lending and foreclosure risk?
Despite the uniqueness of California’s housing market, the hypothesis underlying this study is that similar patterns will be detected as have been found in other areas of the country in which high cost lending and foreclosure risk have been studied in greater detail. In short,
neighborhoods with higher levels of minority and low-income residents will have a greater share of high cost loans and Notices of Default.
Scope of Analysis
The scope of this study was narrowed from California as a whole to three specific counties – Alameda, Fresno, and Riverside – so that closer attention could be paid to intra- and inter-county differences. The three selected counties are in different regions of the state, and they differ based on their socio-economic characteristics and housing markets. The counties also rank differently in terms of the level of foreclosure risk and high cost lending that is present. In essence, the three counties were selected because they represent some of the diversity of California, although they are not presumed to be representative of the state as a whole. In most cases, data are presented separately for the different counties, and then for the study group as a whole.
Data Sources
A number of different data sources were used to assess the relationship between socio-economic and demographic characteristics, high cost lending, and foreclosure risk in Alameda, Fresno, and Riverside Counties. The unit of analysis for this study is the census tract. As of 2000, there were a total of 321 census tracts in Alameda County, 158 tracts in Fresno, and 341 in Riverside County.
For data on high cost loans, this study relies on HMDA (Home Mortgage Disclosure Act) data from 2004; for information on foreclosure risk, this study relies on listings of addresses that have received a Notice of Default between January 2005 and February 2006, which are still active as of February 2006. This information was culled from foreclosure.com, an online provider of information on pre-foreclosed and foreclosed properties. Neighborhood-level information on socio-economic and demographic characteristics was downloaded from Census 2000. Appendix A includes a detailed description of these data sources as well as their strengths and limitations.
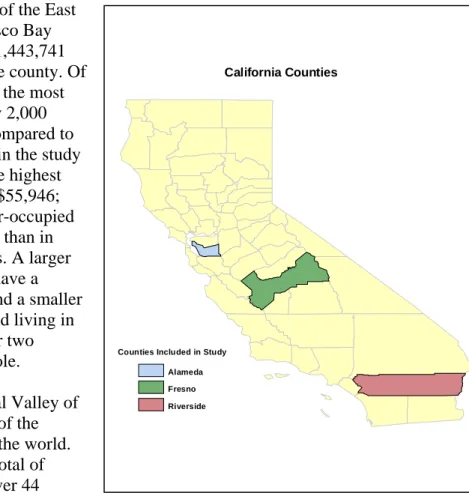
California Counties
Counties Included in Study Alameda Fresno Riverside
Introduction to Alameda, Fresno and Riverside Counties
This study encompasses three distinct counties – Alameda, Fresno, and Riverside – which are located in different regions of the state and have distinct socio-economic and demographic characteristics.
Alameda County forms much of the East Bay portion of the San Francisco Bay Area. As of 2000, there were 1,443,741 residents in the racially diverse county. Of the three counties, Alameda is the most densely populated, with nearly 2,000 residents per square mile as compared to the state average of 217. Within the study sample, the county also has the highest median household income, at $55,946; and the median value of owner-occupied housing is significantly higher than in Fresno and Riverside Counties. A larger percentage of adult residents have a college or advanced degree, and a smaller percentage are unemployed and living in poverty, compared to the other two counties and the state as a whole.
Fresno County is in the Central Valley of California, an area that is one of the richest agricultural regions of the world. As of 2000, the county had a total of 799,407 residents, of which over 44
percent were Hispanic/Latino. The poverty rate in the county is nearly 23 percent and the unemployment rate is also quite high at 11.8 percent.
Riverside is in the southeastern part of California and is part of the Greater Los Angeles Area. Along with neighboring San Bernardino County, it is one of the fastest growing counties in the State. Many residents have moved to Riverside in pursuit of less expensive housing, while they commute to other parts of the Greater Los Angeles Area to work. The homeownership rate in Riverside is the highest among the three counties at 68.8 percent. As of 2000 the population was 1,545,387, but it was estimated to have grown to 1,871,950 by 2004.
Table 1 below provides some key details about the three counties included in this study as well as data for the state of California as a whole.
Table 1
Overview of Alameda, Fresno, and Riverside Counties, Compared to California as a Whole*
Alameda Fresno Riverside California
Total population (2000) 1,443,741 799,407 1,545,387 33,871,648
Estimated population (2004) 1,455,235 866,772 1,871,950 35,893,799
Number of households 523,787 253,304 506,781 11,512,020
Population density (people per square mile) 1,957 134 214 217
Percent White (non-Hispanic) 40.8% 39.6% 50.9% 46.6%
Percent Black/African-American 14.4% 5.0% 6.0% 6.3%
Percent Asian, Hawaiian, and Pacific Islander 20.8% 7.9% 3.6% 11.1%
Percent Hispanic/Latino 19.0% 44.1% 36.2% 32.4%
Percent other race/multiracial 5.0% 3.5% 3.2% 3.6%
Percent with no high school diploma or GED** 23.5% 25.0% 32.5% 17.6%
Percent with a bachelors or graduate/prof. degree** 26.6% 16.6% 17.5% 34.9%
Median household income (1999) $55,946 $34,725 $42,887 $47,493
Poverty rate 11.0% 22.9% 14.2% 14.2%
Unemployment rate 5.5% 11.8% 7.5% 7.0%
Homeownership rate 54.7% 56.5% 68.8% 56.9%
Median value for specified owner-occupied housing units***
$303,100 $104,900 $146,500 $211,500 * All data are for 2000, except where noted otherwise (Census 2000).
**Only includes adults 25+ years of age.
*** Owner occupied housing units that are a one family home detached from any other house or a one family house attached to one or more houses on less than 10 acres with no business on the property.
Home Mortgage Lending in Alameda, Fresno, and Riverside Counties in 2004
The 2004 HMDA dataset includes a total of 252,275 first-lien loan originations in Alameda, Fresno, and Riverside Counties for owner-occupied residences. Of these, more than half (55.3 percent) were originated in Riverside County, 30.4 percent were originated in Alameda, and 14.3 percent were originated in Fresno. Most of these loans were prime loans or subprime loans with interest rates below the threshold that triggers mandated reporting of the rate spread.
As a percent of loans originated in 2004, high cost loans accounted for 16.0 percent of loans in Fresno, 12.0 percent in Riverside, and 4.9 percent in Alameda County. Examining the different types of loans separately, it is clear that, for each type of loan, Fresno census tracts have a greater percentage of high cost loans than the other two counties. In 2004, Fresno and Riverside County
had a larger share of high cost home purchase and refinance loans as compared to the nation as a whole;70 Alameda had a lower rate.
Table 2
Prevalence of High Cost Loans, by County
Percent of Loans That Were High Cost, By Type of Loan and County
Home purchase Home improvement Refinancing
Alameda 4.9% 5.7% 5.0%
Fresno 16.0% 18.3% 18.2%
Riverside 12.1% 13.4% 12.7%
On average, the rate spread between the interest rate for high cost loans and prime loans at time of origination was 3.83 (median = 3.60). At the county level, the rate spread was slightly greater for loans in Fresno County as compared to Riverside and Alameda County. While the difference between the average rate spread seems relatively small, over the life of a 30-year loan, the amount a borrower with an interest rate that is 3.93 percent higher than prime versus one with an interest rate that is 3.78 percent above prime pays can be significant.71
Table 3
Rate Spread for High Cost Loans, by County
Rate Above the Prime Rate
Alameda (n=3,776) + 3.79%
Fresno (n=5,750) + 3.93%
Riverside (n=16,777) + 3.80%
Overall (n=26,303) + 3.83%
Across all three counties, 81 loans (.05 percent of the total number of loans for refinancing and home improvement purposes) carried interest rates such that they were “covered” under HOEPA legislation.72
Characteristics of Census Tracts With Higher Rates of High Cost Loans
There are significant differences between census tracts where high cost lending is more prevalent and those in which high cost loans are relatively rare. Correlations provide information about the degree to which two continuous variables covary.73
For the study sample as a whole, the percent of all loans74 that are high cost is correlated with all census tract characteristics tested except for the percent of residents who are black. For each of
70
In 2004, nationally, 11.5 percent of home purchase loans were high cost and 15.5 percent of refinance loans were. Federal Reserve Bulletin, p. 364.
71
Over the life of a loan of $250,000, compared to a borrower who pays 3.93% over prime, a borrower who pays 3.78% over prime will pay roughly 10,000 less in interest payments over the life of a 30-year loan.
72
HOEPA only applies to closed-ended refinancing and home improvement loans. While this appears to be a low percentage, it is more than ten times higher than for the nation as a whole, which was .003%.
73
A positive correlation signifies that as the value of one variable increases so does the value of the other variable. A negative correlation indicates that as one variable increases, the other decreases. Correlation estimates range form –1 to 1; the stronger the positive correlation between two variables, the closer the correlation estimate will be to 1; likewise, the stronger the negative correlation, the closer the value will be to –1.
these, there is a positive relationship, meaning the percent of high cost loans increased with every characteristic explored except for median household income and the median value of housing units; as median income and median home values increase, the percent of high cost loans decrease.
Table 4 shows correlations for each county separately and for the study sample as a whole, and the findings are relatively comparable except for the variables related to race and ethnicity. Examining the data for the counties separately provides insight into why, for the study sample as a whole, the percent of residents who are black is not strongly correlated with the percent of loans that are high cost. The level of high cost lending is lower in Alameda County than in the other two counties and the percent of residents who are black is greater. While there is a statistically significant correlation between the percent of residents who are black and the level of high cost lending within Alameda County, this relationship is obscured when the data are viewed within the larger dataset.
Table 4
Positive Correlations Between Census Tract Characteristics and Percent of Loans that Are High Cost
Correlation with Percent of High Cost Loans
Percent of residents who are… Alameda Fresno Riverside All Three Counties
Hispanic 0.57*** 0.65*** 0.62*** 0.71***
UnemployedX 0.58*** 0.65*** 0.55*** 0.65***
No college diploma 0.63*** 0.64*** 0.55*** 0.64***
Below the poverty level 0.42*** 0.67*** 0.62*** 0.59***
Non-white 0.56*** 0.71*** 0.69*** 0.30**
Recent immigrantsXX 0.11* 0.60*** 0.49*** 0.11***
Black 0.60*** 0.42*** 0.36*** 0.06
XMale and female residents in civilian labor force, over 16; XXForeign-born with year of entry between 1990 and 1999
*** Significant at .001; **Significant at .01; *Significant at .05
Table 5
Negative Correlations Between Census Tract Characteristics and Percent of Loans that Are High Cost
Correlation with Percent of High Cost Loans
Alameda Fresno Riverside All Three Counties
Median household income (1999) -0.46*** -0.62*** -0.54*** -0.57***
Median value housing units (2000)X -0.61*** -0.62*** -0.24*** -0.62***
XSelected owner occupied housing units
*** Significant at .001; **Significant at .01; *Significant at .05
Assessing Foreclosure Risk Through Notices of Default
Notices of Default (NODs) are an official record that a borrower is behind on her mortgage payments and that her lender is initiating legal action. A relatively small percentage of homeowners who receive Notices of Default actually lose their homes to foreclosure. One
74
The number of high cost loans in a census tract is, to some extent, a factor of the total number of loans made in that area in 2004. The number of high cost loans in an area should increase with the overall lending/borrowing activity in that area. By comparing census tracts based on the percent of loans that were high cost, we can see more clearly the relationship between neighborhood-level socio-economic and demographic characteristics and the prevalence of high cost lending. Loans considered in this analysis are first-lien loans on owner-occupied residences, not including manufactured housing.
estimate is that 10 percent of homeowners who receive a Notice of Default actually lose their homes to foreclosure. The remaining 90 percent are able to bring their payments current or sell their home.75 In California, where actual foreclosures currently are rare occurrences, Notices of Default provide important information about the extent to which homeowners have home loans that they cannot afford. They are not a perfect indicator, however, because many households that have home loans they cannot afford do not ever get to the point where they receive a Notice of Default. Some homeowners are able to refinance or sell their home before receiving this official warning. Throughout this analysis, the term “foreclosure risk” is used as shorthand to describe areas in which households have received Notices of Default. Areas are described as having a “higher level of foreclosure risk” if they have a higher rate of Notices of Default.76
Non Judicial Foreclosure Timeline77
Pre-Lien Lien Notice of Default Notice of Sale Trustee Sale REO
Borrower gets behind in payments Lender files a claim against property as security for money owed
Lender files a “Notice of Default” with the county. Borrower can be anywhere from 15 days to 12 months (or more) behind in payments
The lender (or trustee for the lender) files a Notice of Trustee Sale with the county.
Public auction held by lender (or trustee for the lender)
If no one bids minimum amount set by lender, the property reverts to the lender. The property becomes a R.E.O (real estate owned) by lender
Between 1995 and 2004, the number of Notices of Default declined in California to a historic low.78 A more detailed look at the number of Notices of Default by county for the period from 2001 to 2004 illustrates this trend more clearly. Between 2001 and 2004 the number of Notices of Default dropped in every county in the state except for Santa Clara; some counties, such as Alameda, did not experience a steady decline over the time period. Overall, the number of Notices of Default decreased by 8.8 percent from 2001 to 2004 in Alameda, by 49.9 percent in Fresno, and by 20.2 percent in Riverside.
75
DQ News, “California Foreclosure Activity Stops Declining,” August 12, 2005. 76
In general, census tracts are compared based on the rate of Notices of Default (the number of Notices of Default within the census tract normalized by the number of owner-occupied housing units with a mortgage within the census tract).
77
Timeline from RealtyTrac, http://www.realtytrac.com/education/noframes/JForeclosureTimeline.html?accnt=12921 78
DQNews, August 12, 2005.
Pre Lien
Lien NOD Notice
of Sale Trustee Sale REO 30 days 21-25 days 30 days 90 days If unsold
Table 7
Notices of Default by County, 2001-2004
2001 2002 2003 2004 Alameda 2,662 3,193 3,102 2,429 Contra Costa 2,484 2,953 2,758 2,183 El Dorado 290 368 358 280 Fresno 3,849 3,545 2,660 1,929 Kern 3,120 2,779 2,295 1,733 Los Angeles 24,531 22,113 25,806 13,297 Madera 630 529 396 317 Marin 267 341 277 248 Merced 672 640 677 502 Monterey 428 414 449 384 Napa 182 184 128 101 Orange County 3,660 3,456 3,909 2,754 Placer 666 802 640 526 Riverside 6,378 6,092 7,145 5,089 Sacramento 4,832 4,229 3,589 2,880 San Bernardino 8,640 7,214 8,843 5,677 San Diego 3,412 3,654 4,364 3,263 San Francisco 470 504 538 427 San Joaquin 2,277 2,870 2,936 2,213
San Luis Obispo 336 345 321 205
San Mateo 746 965 930 684 Santa Barbara 597 572 527 320 Santa Clara 2,046 2,960 3,127 2,520 Santa Cruz 263 348 311 260 Solano 1,169 1,208 1,219 1,019 Sonoma 541 684 645 495 Stanislaus 1,539 1,689 1,563 1,267 Tulare 2,566 2,395 2,266 1,477 Ventura 1,395 1,393 1,543 883 Yolo 354 345 278 233 All California 81,003 78,784 83,600 56,125
Source: Dataquick Real Estate News, http://www.dqnews.com/
It is still too early to determine if the fourth quarter of 2005 marked the beginning of a new trend, or if it marks the return to some baseline amount of Notices of Default after an unnaturally low rate of such occurrences.79 Regardless, it was the first time in nine years in which there was a
79
Some argue that, like unemployment, some foreclosure activity is normal in any market and that current rates of foreclosure in California are unnaturally low at present.