O R I G I N A L I N V E S T I G A T I O N
Open Access
Impact of metabolic syndrome and its
components on cardiovascular disease event
rates in 4900 patients with type 2 diabetes
assigned to placebo in the field randomised trial
Russell Scott
1*, Mark Donoghoe
2, Gerald F Watts
3, Richard O
’
Brien
4, Christopher Pardy
2, Marja-Riitta Taskinen
5,
Timothy ME Davis
3, Peter G Colman
4, Patrick Manning
6, Gregory Fulcher
7and Anthony C Keech
2, for
The FIELD Study Investigators
Abstract
Background:Patients with the metabolic syndrome are more likely to develop type 2 diabetes and may have an increased risk of cardiovascular disease (CVD) events.We aimed to establish whether CVD event rates were influenced by the metabolic syndrome as defined by the World Health Organisation (WHO), the National
Cholesterol Education Program (NCEP) Adult Treatment Panel III (ATP III) and the International Diabetes Federation (IDF) and to determine which component(s) of the metabolic syndrome (MS) conferred the highest cardiovascular risk in in 4900 patients with type 2 diabetes allocated to placebo in the Fenofibrate Intervention and Event Lowering in Diabetes (FIELD) trial.
Research design and methods:We determined the influence of MS variables, as defined by NCEP ATPIII, IDF and WHO, on CVD risk over 5 years, after adjustment for CVD, sex, HbA1c, creatinine, and age, and interactions between
the MS variables in a Cox proportional-hazards model.
Results:About 80% had hypertension, and about half had other features of the metabolic syndrome (IDF, ATPIII). There was no difference in the prevalence of metabolic syndrome variables between those with and without CVD at study entry. The WHO definition identified those at higher CVD risk across both sexes, all ages, and in those without prior CVD, while the ATPIII definition predicted risk only in those aged over 65 years and in men but not in women. Patients meeting the IDF definition did not have higher risk than those without IDF MS.
CVD risk was strongly influenced by prior CVD, sex, age (particularly in women), baseline HbA1c, renal dysfunction,
hypertension, and dyslipidemia (low HDL-c, triglycerides > 1.7 mmol/L). The combination of low HDL-c and marked hypertriglyceridemia (> 2.3 mmol/L) increased CVD risk by 41%. Baseline systolic blood pressure increased risk by 16% per 10 mmHg in those with no prior CVD, but had no effect in those with CVD. In those without prior CVD, increasing numbers of metabolic syndrome variables (excluding waist) escalated risk.
Conclusion:Absence of the metabolic syndrome (by the WHO definition) identifies diabetes patients without prior CVD, who have a lower risk of future CVD events. Hypertension and dyslipidemia increase risk.
* Correspondence: russell.scott@cdhb.govt.nz 1
Lipid & Diabetes Research Group, Christchurch Hospital, Christchurch, New Zealand
Full list of author information is available at the end of the article
Introduction
Patients with the metabolic syndrome (MS) events are also more likely to develop type 2 diabetes and may have an increased risk of future cardiovascular disease (CVD) [1].
The most commonly used guidelines for definitions of MS are those developed by the National Cholesterol Edu-cation Program (NCEP) Adult Treatment Panel III (ATPIII) in 2001 [2], the World Health Organization (WHO) in 1999 [3], and more recently, the International Diabetes Federation (IDF) definition [4], and the harmo-nized definition [5]. The various components of MS do not contribute equally to CVD risk in those without frank dia-betes, and the relative importance of clusters of these risk factors in the setting of established diabetes is less clear.
In the Fenofibrate Intervention and Event Lowering in Diabetes (FIELD) study [6,7], 9795 patients with type 2 diabetes, with or without prior CVD, were recruited and followed up for an average of 5 years. Of these, 4900 were randomized to placebo, providing a sample size sufficient to explore whether CVD event rates were influenced by the presence of MS components (hyper-tension, dyslipidemia, and waist circumference) or clus-ters, according to the 4 current definitions. This study also allowed us to assess whether various MS compo-nents affected the risk of CVD equally or differently in those with and those without prior CVD and in prede-fined age and sex subgroups.
Methods
In the FIELD study, 9795 patients with type 2 diabetes, aged 50 to 75 years, from Australia, New Zealand, and Finland were randomly assigned to treatment with pla-cebo or fenofibrate for a planned duration of 5 years. The trial has been described in detail elsewhere [6]. To be eligible, patients had to have an initial plasma total cholesterol level of 3.0-6.5 mmol/L, plus a total choles-terol/HDL-c ratio of≥ 4.0 or plasma triglyceride 1.0-5·0 mmol/L, with no clear indication for lipid-modifying therapy at study entry. Exclusion criteria included renal impairment (creatinine > 130μmol/L), chronic liver dis-ease or symptomatic gallbladder disdis-ease, and a cardio-vascular event within 3 months before recruitment.
In this further study of FIELD participants, we exam-ined whether the presence of MS, and its various compo-nents, increased cardiovascular disease events over 5 years. In addition, we examined which components of MS contributed most to cardiovascular risk. This analysis was confined to the placebo group (n= 4900, including 1833 women), who did not receive fenofibrate during the trial, and of whom 1016 had known CVD at study entry.
The prevalence at baseline of the MS components for referenced definitions (ATPIII, IDF, and WHO) was
determined (Table 1). The harmonized definition data added nothing to the conclusions regarding the IDF defi-nition, so were not considered further. High blood pres-sure was defined as a self-reported history of hypertension and documented use of medication for hypertension, or a mean of 3 blood pressure values at baseline above 130/85 mm Hg for the IDF, ATPIII and harmonized definitions, or above 140/90 mm Hg for the WHO definition [3-5,8]. In the WHO MS definition, dyslipidemia is a single com-ponent, and patients can have either raised blood triglycer-ide (≥1.7 mmol/L) or low HDL-c levels (< 0.9 mmol/L for men and < 1.0 mmol/L for women). If both were present, this was counted as a single risk factor in all analyses using the WHO definition, whereas the other definitions allowed each to be counted individually. Thus, if HDL-c levels were low and triglyceride was high, both risk factors were counted separately for IDF and ATPIII. Type 2 diabetes was a core component for each of the definitions, and waist measurement was included as a requirement of the IDF definition.
Outcome was defined as the first CVD event over the duration of the study (CVD death, nonfatal coronary events, stroke, and coronary and carotid revascularizations). Event rates for those meeting or not meeting MS cri-teria were established in subgroups based on the prespe-cified cut-off age of 65 years, sex, and the presence or absence of prior CVD. The effects of baseline blood pressure, waist circumference, HDL-c, and triglyceride levels on CVD event rates were analysed by quintile.
Statistical analysis
We established the CVD risk associated with the various MS components in a Cox proportional-hazards model with categorical data from this cohort using the WHO definition, with adjustment for age, sex, prior CVD, hemoglobin (Hb) A1c, and creatinine. A separate Cox
proportional-hazards model with continuous variables was used to determine the CVD risk associated with gradients in waist-hip ratio, blood pressure, HDL-c, tri-glyceride concentrations, and urine albumin-creatinine ratio, with the same adjustment variables. In both mod-els, all possible two-way interactions between predictors were considered for inclusion and retained ifP < 0.05. For predictors interacting with continuous variables, the hazard ratio at the median of each continuous variable is presented. All variables used in the analyses were measured at study entry.
Results
Prevalence of the individual metabolic syndrome components in the FIELD cohort
met criteria for MS, regardless of definition. Hyperten-sion was common. The WHO definition led to more similar proportions of men and women having MS than the other classifications, which identified higher preva-lence rates of the various features in women than men, particularly for waist criteria. There was no difference in the prevalence of MS or its components in those with or without CVD at study entry (data not shown).
The WHO definition was the most discriminatory for prediction of future CVD events, and predicted higher risks across all predefined subgroups (men and women, age under 65 years or 65 and over, and prior CVD or no prior CVD). (Table 2). The presence of MS by the WHO definition conferred significantly higher CVD risk even among patients who had prior CVD at study entry,
whereas the IDF and ATPIII definitions did not identify this subgroup as having increased risk. ATP III criteria were limited to identifying higher risk only in men and those over 65 years. Furthermore, patients meeting the IDF MS definition did not have significantly higher CVD risk than patients without IDF MS and none of the prespecified subgroups were associated with increased CVD risk. These conclusions did not change if the study population was confined to the 3837 patients without prior CVD.
Effect of various metabolic syndrome components on cardiovascular disease risk
The effects of metabolic-syndrome and other variables on CVD events were modelled in a Cox regression
Table 1 Prevalence of features of metabolic syndrome at baseline in patients assigned to placebo in the FIELD study (points of difference in criteria are shown in bold)
Feature of metabolic syndrome Men Women All patients
(n = 3067) (n = 1833) (n = 4900)
ATPIII criteria (any 3)
Diabetes or impaired fasting glucose 100 100 100
High waist measurement (M > 102 cm, F > 88 cm) 54.5 80.6 64.3
Hypertension history or BP≥130/85 mmHg 82.2 85.8 83.6
High triglycerides (≥1.7 mmol/L) 50.0 54.1 51.5
Low HDL cholesterol (M < 1.03 mmol/L, F < 1.29 mmol/L) 54.8 66.2 59.1
Metabolic syndrome according to ATPIII 78.3 90.3 82.8
IDF criteria (waist + any 2)
Diabetes or impaired fasting glucose 100 100 100
High waist measurement (M≥94 cm, F≥80 cm) 83.9 95.0 88.0
Hypertension history or BP≥130/85 mmHg 82.2 85.8 83.6
High triglycerides (≥1.7 mmol/L) 50.0 54.1 51.5
Low HDL cholesterol (M < 1.03 mmol/L, F < 1.29 mmol/L) 54.8 66.2 59.1
Metabolic syndrome according to IDF 80.5 92.5 85.0
Harmonized criteria (any 3)
Diabetes or impaired fasting glucose 100 100 100
High waist measurement (M≥94 cm, F≥80 cm) 83.9 95.0 88.0
Hypertension history or BP≥130/85 mmHg 82.2 85.8 83.6
High triglycerides (≥1.7 mmol/L) 50.0 54.1 51.5
Low HDL cholesterol (M < 1.03 mmol/L, F < 1.29 mmol/L) 54.8 66.2 59.1
Metabolic syndrome according to harmonized definition 87.6 94.7 90.3
WHO criteria (diabetes + any 2)
Diabetes or impaired fasting glucose 100 100 100
High waist-hip ratio (M > 0.9, F > 0.85) or BMI > 30 88.5 80.5 85.5
Hypertension history or blood pressure≥140/90 mmHg 68.5 73.3 70.3
High triglycerides (≥1.7 mmol/L) and/orlow HDL-c (M < 0.9 mmol/L, F < 1.0 mmol/L) 58.9 59.0 58.9
Microalbuminuria (urine albumin/creatinine≥3.4 mg/mmol) 23.6 20.8 22.6
Metabolic syndrome according to WHO 82.6 80.7 81.9
* IDF criteria for hypertension, high triglyceride, and low HDL-c are the same as those for ATPIII.
†Harmonized criteria are the same as for IDF except metabolic syndrome does not require high waist measurement.
‡Ethnic and sex-specific cut-offs for waist circumference define high risk in the harmonized definition. This analysis, for a population mainly of European origin, used the“Caucasian”waist cut-off.
analysis (Table 3). Non-MS variables of sex, age, prior CVD, baseline HbA1c, and creatinine had major
influ-ences on CVD outcomes. The effects of MS variables on CVD events were calculated after adjustment for these variables. While increases in triglyceride (0.5 mmol/L) and waist circumference (10 cm) did not have significant effects, both a decrease of HDL-c and an increase in sys-tolic BP were associated with significant CVD disadvantage.
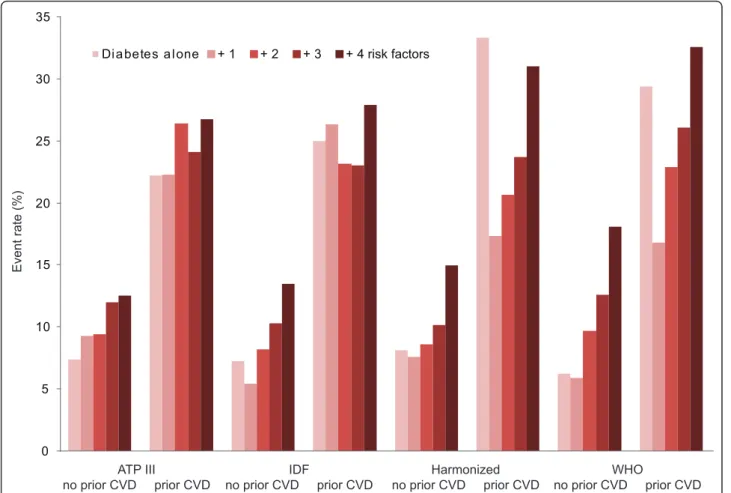
Hypertension in patients without prior CVD more than doubled CVD risk in a categorical Cox regression model (data not shown). In those without prior CVD, increasing numbers of MS variables escalated risk regardless of the MS definition being applied (Figure 1); those with diabetes
plus all MS components had two to three times the risk of those with diabetes alone (regardless of definition).
The CVD risk of the 1063 patients with prior CVD was 25-26% if they met criteria for MS (any of the definitions; Table 2). Prior CVD roughly tripled the risk of future events in this group compared with those without prior CVD, even when up to two MS risk factors were present. Increasing numbers of MS variables in those with prior CVD did not so clearly increase risk (Table 2, Figure 1).
MS variables by quintile and CVD events
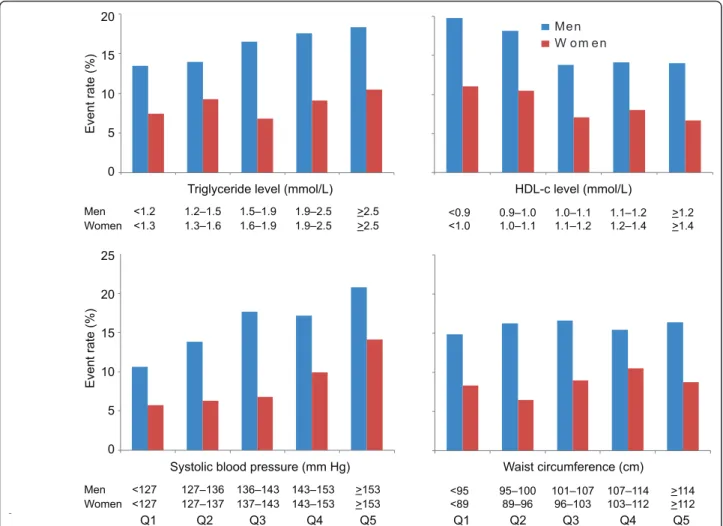
Men had a higher CVD risk if their HDL-c was below 0.95 mmol/L. No strong gradient of risk was observed for women, although those with HDL-c < 0.98 mmol/L
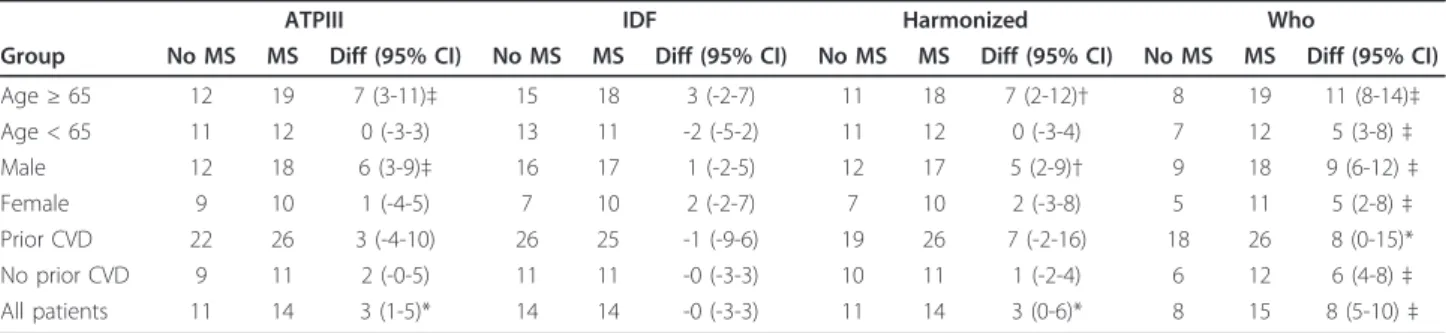
Table 2 Total CVD event rates (%, 95% CI) by presence of metabolic syndrome with different definitions in patients assigned to placebo in the FIELD study
ATPIII IDF Harmonized Who
Group No MS MS Diff (95% CI) No MS MS Diff (95% CI) No MS MS Diff (95% CI) No MS MS Diff (95% CI)
Age≥65 12 19 7 (3-11)‡ 15 18 3 (-2-7) 11 18 7 (2-12)† 8 19 11 (8-14)‡
Age < 65 11 12 0 (-3-3) 13 11 -2 (-5-2) 11 12 0 (-3-4) 7 12 5 (3-8)‡
Male 12 18 6 (3-9)‡ 16 17 1 (-2-5) 12 17 5 (2-9)† 9 18 9 (6-12)‡
Female 9 10 1 (-4-5) 7 10 2 (-2-7) 7 10 2 (-3-8) 5 11 5 (2-8)‡
Prior CVD 22 26 3 (-4-10) 26 25 -1 (-9-6) 19 26 7 (-2-16) 18 26 8 (0-15)*
No prior CVD 9 11 2 (-0-5) 11 11 -0 (-3-3) 10 11 1 (-2-4) 6 12 6 (4-8)‡
All patients 11 14 3 (1-5)* 14 14 -0 (-3-3) 11 14 3 (0-6)* 8 15 8 (5-10)‡
*P< 0.05,†P< 0.01,‡P< 0.001 for the absolute risk difference for metabolic syndrome compared with no metabolic syndrome. The larger the difference, the greater the risk discrimination provided by the definition.
CVD, cardiovascular disease; FIELD, Fenofibrate Intervention and Event Lowering in Diabetes; MS, metabolic syndrome; ATPIII, Adult Treatment Panel III; IDF, International Diabetes Federation; WHO, World Health Organization;
Table 3 Cox regression model* for the effect of continuous variables, including features of the metabolic syndrome as defined by ATPIII, on the risk of total CVD events in patients assigned to placebo in the FIELD study
Variable† Hazard ratio (95% CI) P
Predictive variable
Female (at 62 years) 0.70 (0.55-0.88) 0.003
Age (per 10 years): male 1.21 (1.06-1.39) < 0.001
Age (per 10 years): female 1.74 (1.38-2.19)
Prior CVD (at 140 mmHg SBP, 6.85% HbA1c) 2.14 (1.81-2.53) < 0.001
Hemoglobin A1c(per 1%): no prior CVD 1.18 (1.10-1.26) < 0.001
Hemoglobin A1c(per 1%): prior CVD 1.03 (0.95-1.13)
Creatinine (per 20μmol/L) 1.21 (1.09-1.35) < 0.001
Metabolic syndrome variable‡
Waist -hip ratio (per 0.1) 1.03 (0.91-1.17) 0.60
Systolic BP (per 10 mmHg): no prior CVD 1.16 (1.09-1.24) < 0.001
Systolic BP (per 10 mmHg): prior CVD 1.01 (0.94-1.09)
Triglycerides (per 0.5 mmol/L) 1.03 (0.99-1.07) 0.19
HDL-c (per 0.1 mmol/L) 0.94 (0.90-0.97) < 0.001
Urine albumin-creatinine ratio (per doubling) 1.06 (1.02 - 1.10) 0.002
* Cox proportional-hazards assumptions were met.
†All variables were centered at medians. Standard deviations for distributions of the continuous variables were: age, 6.9 years; HbA1c, 1.35%; creatinine, 15.8
μmol/L; waist, 13 cm; systolic BP, 15 mmHg; triglycerides, 0.88 mmol/L; HDL-c, 0.26 mmol/L. ‡Corrected for age, sex, prior CVD, baseline HbA1cand creatinine.
had higher event rates than those with HDL-c > 1.41 mmol/L (Figure 2). For men, a progressive rise in risk occurred as triglyceride levels rose through the quintiles. For women, there was no significant risk gradient. Base-line systolic BP was associated with CVD risk in both sexes across quintiles, but waist measurements were not significantly associated with risk.
Discussion
In the placebo cohort of FIELD, the absolute risk of a CVD event was higher in those with more MS compo-nents, provided they did not have prior CVD. Patients with prior CVD had a less clear risk gradient related to the presence or absence of MS features.
The WHO definition of metabolic syndrome outper-formed the other definitions in predicting CVD. It does not include waist measurement, which was not a signifi-cant risk factor in any case (replaced by waist-hip ratio and also not a significant risk factor). Its hypertension cut-off is higher than that of the other definitions, and
it combines the triglyceride criterion (not predictive in women) with the lower and sex-specific HDL-c criter-ion. Our findings are in line with those of the Strong Heart Study, also in diabetes, with the WHO definition performing best[9].
The prevalence of MS features, as defined by ATPIII, IDF, and WHO classifications, was high, particularly for treated hypertension or high blood pressure at study entry. Over 80% met MS criteria irrespective of defini-tion, and 60% had at least 3 MS components, in addi-tion to type 2 diabetes.
The protective effect of sex was strong, with women having a 30% lesser CVD risk than men, after adjust-ment. This is consistent with previous reports, first, that type 2 diabetes doubles in men and triples in women the relative risk of various CVD events [10,11], and sec-ond, that men with MS are more likely to have a CVD event than women [12,13]. However, there are also some reports that women are at higher risk of CVD than men [14,15]. In FIELD, for every 10 years of age, at 0
5 10 15 20 25 30 35
Di a betes a l one + 1 + 2 + 3 + 4 risk factors
ATP III
no prior CVD prior CVD
IDF
no prior CVD prior CVD
Harmonized no prior CVD prior CVD
WHO
no prior CVD prior CVD
Event rate (%)
baseline, CVD risk was 74% higher in women and 21% higher in men. Although truncal obesity was prevalent, particularly in women, high waist circumference and waist-hip ratio were not significant CVD risk factors, in contrast to other studies in more general populations [16,17]. This may reflect the greater importance of this component in a prediabetes setting. Although truncal fat is an important driver of insulin resistance [18], and adjustment for WHR has been shown, for example, to influence the relationship of HOMA-index with left ven-tricular mass in people without diabetes [19], once dia-betes is present, it is possible that excess truncal fat no longer predicts future CVD events. However, fatness, adipocytokine release and inflammation are tightly inter-linked, and an effect on CVD event rates would have been predicted [20,21]. The most important MS predic-tor of CVD events in the Framingham Offspring Study was blood pressure [13], followed by HDL-c level, and not waist measurement, consistent with the findings of this FIELD analysis. Waist circumference is a required
component of the IDF definition, which may explain its lesser discrimination of risk in comparison with the har-monized version. Of interest, another group has reported an association between prevalence of MS and higher levels of within-normal-limits liver function [22].
The presence of dyslipidemia contributed to CVD risk. All MS definitions apply sex-specific levels for HDL-c, with the triglyceride level set at 1.7 mmol/L, above which LDL particles tend to be of smaller size and greater density, properties that reflect higher atherogeni-city [23]. In the FIELD cohort, there was a gradient of risk as triglyceride levels increased above 1.5 mmol/L in men, but in women no change in risk was observed across the quintiles except for a suggestion of higher risk at levels over 2.5 mmol/L. These data support the possibility of a triglyceride risk differential by sex in dia-betes, although this was not the finding of the recent meta-analysis of the Emerging Risk Factors Collabora-tion [24]. It would appear that there is also a strong sex difference with respect to cut-offs for the HDL-c levels
Me n W o m e n
25
20
15
10
5
0 20
15
10
5
0
Q1 Q2 Q3 Q4 Q5 Q1 Q2 Q3 Q4 Q5
HDL-c level (mmol/L) Triglyceride level (mmol/L)
Waist circumference (cm) Systolic blood pressure (mm Hg)
Event rate (%)
Event rate (%)
Men <1.2 1.2–1.5 1.5–1.9 1.9–2.5 >2.5 Women <1.3 1.3–1.6 1.6–1.9 1.9–2.5 >2.5
<0.9 0.9–1.0 1.0–1.1 1.1–1.2 >1.2 <1.0 1.0–1.1 1.1–1.2 1.2–1.4 >1.4
Men <127 127–136 136–143 143–153 >153 Women <127 127–137 137–143 143–153 >153
<95 95–100 101–107 107–114 >114 <89 89–96 96–103 103–112 >112
that escalate risk. Higher CVD risk in men was asso-ciated with HDL-c levels below 0.95 mmol/L, a value similar to that used in these definitions of MS. In women, the FIELD data suggest that the defined levels for HDL-c should be set lower than specified by ATPIII (for example, < 1.0 mmol/L) to select diabetes patients with higher CVD risk. This may partly explain why the WHO definition came out as the most predictive (although it also captured as having MS those with higher blood pressure and microalbuminuria). Thus, the most aggressive risk factor management for diabetes patients might be guided by levels of HDL-c and trigly-ceride that are sex-specific. For both men and women, an HDL-c level below 1.0 mmol/L seems to best identify highest risk. For triglycerides, a level above 1.5 mmol/L seems appropriate for men, but for women, a much higher value, such as > 2.5 mmol/L, might be necessary to identify higher risk.
The limitations to the study are that the analysis was based on data at study entry, and the proportion of sub-jects lacking MS features was relatively small. Compari-sons between those with and without MS thus might have over- (or under-) estimated effects, but is consis-tent with other reports[25]. In addition, the average rate of uptake of statins in the placebo group during follow-up was substantial (17% over 5 years) [26], and those with more marked dyslipidemia were most likely to have had this treatment initiated (21%).
Conclusion
An increasing number of MS variables increased future CVD risk, and for all definitions, other than the IDF definition, the risk of CVD among patients defined as having MS was significantly higher than among those without. The two MS variables that contributed most to this risk were HDL-c and hypertension. Waist measure-ment was not a material contributor. Of current defini-tions of MS, the WHO definition, which includes albuminuria, was consistently the best discriminator of risk, whereas the IDF definition was not significantly predictive. These results can help guide clinicians in identifying patients with diabetes at high CVD risk.
Abbreviations
ATP III: Adult Treatment Panel III; CVD: cardiovascular disease; FIELD: Fenofibrate Intervention and Event Lowering in Diabetes; HDL: high-density lipoprotein; IDF: International Diabetes Federation; LDL: low-density lipoprotein; MS: metabolic syndrome; NCEP: National Cholesterol Education Program; WHO: World Health Organisation.
Acknowledgements
The FIELD study was supported by a grant from Laboratoires Fournier SA, Dijon, France (now part of Abbott) and the National Health and Medical Research Council (NHMRC) of Australia, and was coordinated independently by the NHMRC Clinical Trials Centre, University of Sydney. The authors thank
Rhana Pike from the NHMRC Clinical Trials Centre, for assistance with the manuscript.
Author details 1
Lipid & Diabetes Research Group, Christchurch Hospital, Christchurch, New Zealand.2NHMRC Clinical Trials Centre, University of Sydney, Sydney, Australia.3School of Medicine and Pharmacology, University of Western Australia, Perth, Australia.4School of Medicine, University of Melbourne, Melbourne, Australia.5Department of Medicine, Helsinki University Central Hospital and Biomedicum, Helsinki, Finland.6Department of Medical and Surgical Sciences, Dunedin School of Medicine, Dunedin, New Zealand. 7Department of Diabetes, Endocrinology and Metabolism, Royal North Shore Hospital, Sydney, Australia.
Authors’contributions
RS designed this study, wrote the manuscript, MD contributed to the discussion, analysed the data, revised the manuscript; GFW contributed to the discussion, revised the manuscript; ROB contributed to the discussion, revised the manuscript; CP contributed to the discussion, analysed the data, revised the manuscript; MRT contributed to the discussion, revised the manuscript; TMED contributed to the discussion, revised the manuscript; PGC contributed to the discussion, revised the manuscript; PM contributed to the discussion, revised the manuscript; GF contributed to the discussion, revised the manuscript; ACK designed the study, contributed to the discussion, wrote the manuscript; all authors read and approved the final manuscript.
Authors' interests
The authors declare that they have no competing interests.
Received: 17 August 2011 Accepted: 21 November 2011 Published: 21 November 2011
References
1. Klein BE, Klein R, Lee KE:Components of the metabolic syndrome and risk of cardiovascular disease and diabetes in Beaver Dam.Diabetes Care 2002,25:1790-1794.
2. NCEP Expert Panel:Summary of the third report of the National Cholesterol Education Program (NCEP) Expert Panel on detection evaluation, and treatment of high blood cholesterol in adults (Adult Treatment Panel III).JAMA-Journal Of The American Medical Association 2001,285:2486-2497.
3. Alberti KG, Zimmet PZ:Definition, diagnosis and classification of diabetes mellitus and its complications. Part 1: diagnosis and classification of diabetes mellitus provisional report of a WHO consultation.Diabetic
Medicine1998,15(7):539-553.
4. Alberti KG, Zimmet P, Shaw J:The metabolic syndrome–a new worldwide definition.Lancet2005,366(9491):1059-1062.
5. Alberti KG, Eckel RH, Grundy SM, Zimmet PZ, Cleeman JI, Donato KA, Fruchart J-C, James WPT, Loria CM, Smith SCJ:Harmonizing the Metabolic Syndrome: a joint interim statement of the International Diabetes Federation Task Force on Epidemiology and Prevention; National Heart, Lung, and Blood Institute; American Heart Association; World Heart Federation; International Atherosclerosis Society; and International Association for the Study of Obesity.Circulation October2009, 120(16):1640-1645.
6. FIELD study investigators:Effects of long-term fenofibrate therapy on cardiovascular events in 9795 people with type 2 diabetes mellitus (the FIELD study): randomised controlled trial.Lancet2005,
366(9500):1849-1861.
7. FIELD study investigators:Fenofibrate Intervention and Event Lowering in Diabetes (FIELD) study: baseline characteristics and short-term effects of fenofibrate [ISRCTN64783481].Cardiovascular Diabetology2005,4(1):13. 8. Adult Treatment Panel III:Executive summary of the Third Report of the
National Cholesterol Education Program (NCEP) Expert Panel on Detection, Evaluation, and Treatment of High Blood Cholesterol in Adults (Adult Treatment Panel III).JAMA2001,285(19):2486-2497. 9. de Simone G, Devereux R, Chinali M, Best L, Lee E, Galloway J, Resnick H,
of obesity and diabetes: the Strong Heart Study.Diabetes Care2007, 30(7):1851-1856.
10. Knowler WC, Pettitt DJ, Saad MF, Charles MA, Nelson RG, Howard BV, Bogardus C, Bennett PH:Obesity in Pima Indians: its magnitude and relationship with diabetes.American Journal of Clinical Nutrition1991, 53:1543S-1551S.
11. Must A, Spadano J, Coakley EH, Field AE, Colditz G, Dietz WH:The disease burden associated with overweight and obesity.JAMA1999,
282:1523-1529.
12. Lakka HM, Laaksonen DE, Lakka TA, Niskanen LK, Kumpusalo E, Tuomilehto J, Salonen JT:The metabolic syndrome and total and cardiovascular disease mortality in middle-aged men.JAMA2002, 288(21):2709-2716.
13. Wilson PWF, D’Agostino RD, Parise H, Sullivan L, Meigs JB:Metabolic syndrome as a precursor for cardiovascular disease and type 2 diabetes mellitus.Circulation2005,112:3066-3072.
14. Becker A, Bos G, de Vegt F, Kostense PJ, Dekker JM, Nijpels G, Heine RJ, Bouter LM, Stehouwer CDA:Cardiovascular events in type 2 diabetes: comparison with nondiabetic individuals without and with prior cardiovascular disease 10-year follow-up of the Hoorn Study.European
Heart Journal2003,24:1406-1413.
15. Juutilainen A, Kortelainen S, Lehto S, Ronnemaa T, Pyorala K, Laakso M: Gender difference in the impact of type 2 diabetes on coronary heart disease risk.Diabetes Care2004,27:2898-2904.
16. Arsenault BJ, Lemieux I, Despres J-P, Wareham NJ, Kastelein JJP, Khaw K-T, Boekholdt SM:The hypertriglyceridemic-waist phenotype and the risk of coronary artery disease: results from the EPIC-Norfolk Prospective Population Study.CMAJ2010,182(13):1427-1432.
17. de Simone G, Chinali M:The issue of body size between methods and substance.Journal of Hypertension2008,26(2):178-181.
18. Abate N, Garg A, Peshock RM, Stray-Gundersen J, Grundy SM:Relationships of generalised and regional adiposity to insulin sensitivity in men.
Journal of Clinical Investigation1995,96:88-98.
19. de Simone G, Devereux R, Palmieri V, Roman M, Celentano A, Welty T, Fabsitz R, Contaldo F, Howard B:Relation of insulin resistance to markers of preclinical cardiovascular disease: the Strong Heart Study.Nutr Metab
Cardiovasc Dis2003,13(3):140-147.
20. De Lorenzo A, Del Gobbo V, Premrov MG, Bigioni M, Galvano F, Di Renzo L: Normal-weight obese syndrome: early inflammation?American Journal of
Clinical Nutrition2007,85(1):40-45.
21. Robinson LE, Graham TE:Metabolic syndrome, a cardiovascular disease risk factor: role of adipocytokines and impact of diet and physical activity.Canadian Journal of Applied Physiology2004,29(6):808-829. 22. Steinvil AS, I , Ben-Bassat O, Cohen M, Vered Y, Berliner S, Rogowski O:The
association of higher levels of within-normal-limits liver enzymes and the prevalence of the metabolic syndrome.Cardiovasc Diabetol2010, 9:30.
23. Feingold KR, Grunfeld C, Pang M, Doerrler W, Krauss RM:LDL subclass phenotypes and triglyceride metabolism in non-insulin-dependent diabetes.Arteriosclerosis and Thrombosis1992,12(12):1496-1502. 24. Emerging Risk Factors C:Diabetes mellitus, fasting blood glucose
concentration, and risk of vascular disease: a collaborative meta-analysis of 102 prospective studies.The Lancet2010,375(9733):2215-2222. 25. Alexander CL, Teutsch S, Haffner S, Third National Health and Nutrition
Examination Survey (NHANES III), National Cholesterol Education Program (NCEP):NCEP-defined metabolic syndrome, diabetes, and prevalence of coronary heart disease among NHANES III participants age 50 years and older.Diabetes Care2003,52(5):1210-1214.
26. Simes R, Voysey M, O’Connell R, Glasziou P, Best J, Scott R, Pardy C, Byth K, Sullivan D, Ehnholm C,et al:A novel method to adjust efficacy estimates for uptake of other active treatments in long-term clinical trials.PLoS One2010,5(1):e8580.
doi:10.1186/1475-2840-10-102
Cite this article as:Scottet al.:Impact of metabolic syndrome and its components on cardiovascular disease event rates in 4900 patients with type 2 diabetes assigned to placebo in the field randomised trial. Cardiovascular Diabetology201110:102.
Submit your next manuscript to BioMed Central and take full advantage of:
• Convenient online submission
• Thorough peer review
• No space constraints or color figure charges
• Immediate publication on acceptance
• Inclusion in PubMed, CAS, Scopus and Google Scholar
• Research which is freely available for redistribution