THE EFFECTS OF COMPLEX TRAUMA ON HUMAN CAPITAL AMONG VULNERABLE YOUTH
C. Joy Stewart
A dissertation submitted to the faculty at the University of North Carolina at Chapel Hill in partial fulfillment of the requirements for the degree of Doctor of Philosophy in the
School of Social Work.
Chapel Hill 2020
Approved by: Dean F. Duncan Hye-Chung Kum Roderick A. Rose
ABSTRACT
C. Joy Stewart: The Effects of Complex Trauma on the Human Capital among Vulnerable Youth
(Under the direction of Dean F. Duncan)
This dissertation is comprised of two related studies with the first study laying the foundation for the second study. Study 1 assessed the validity and reliability of the Project Broadcast screening tool, which is intended to measure complex trauma, in a sample 13,714 who were assessed for maltreatment in North Carolina. Overall, findings supported the tool as a valid and reliable measure of complex trauma in the study sample. The underlying constructs of the tool showed that there was some divergence of trauma types between general trauma that was non-sexual versus sexual maltreatment and related symptoms and that symptoms were along the two constructs of externalizing and internalizing symptoms. Study 2 used the Project Broadcast tool in a structural equation model to measure the effects of complex trauma on human capital as well as the role played by out-of-home care in a sample of 3,796 school-aged children who were assessed for
DEDICATION
ACKNOWLEDGEMENTS
TABLE OF CONTENTS
LIST OF TABLES ... viii
LISTOFFIGURES ... ix
LISTOFABBREVIATIONS ... x
INTRODUCTION ... 1
STUDY 1: VALIDITY AND RELIABILITY OF THE PROJECT BROADCAST TRAUMA SCREEN ... 4
METHOD ... 6
Data and Measures ... 6
Procedures ... 6
Analysis ... 8
RESULTS ... 13
Sample Description ... 13
Random Split ... 15
Exploratory Factor Analysis ... 15
Confirmatory Factor Analysis ... 21
Internal consistency reliability ... 26
DISCUSSION ... 28
STUDY 2: THE IMPACT OF COMPLEX TRAUMA ON HUMAN CAPITAL ... 32
HUMAN CAPITAL THEORY AND EDUCATION ... 32
TRAUMA EFFECTS ON EDUCATION ... 34
RESEARCH QUESTIONS ... 36
METHOD ... 39
Data and Measures ... 39
Sample Selection ... 41
Analysis ... 43
RESULTS ... 44
Sample Description ... 44
Measurement Model ... 46
Structural Regression ... 50
DISCUSSION ... 59
CONCLUSION ... 61
APPENDIX A:2015PROJECT BROADCAST TRAUMA SCREENING TOOL (AGE 6-21)... 63
APPENDIX B:TRAUMA SCREENING COMPANION GUIDE 2018EXCERPTS ... 64
APPENDIX C:ITEM RECODING ... 87
APPENDIX D:TETRACHORIC CORRELATIONS FOR THE PROJECT BROADCAST SCREENING TOOL ITEMS ... 89
APPENDIX E:NORTH CAROLINA EDUCATION DATA CENTER (NCERDC) MATCHING SUMMARY ... 91
APPENDIX F:MISSING DATA ANALYSIS ... 95
APPENDIX G:MODEL 2INDIRECT EFFECTS ... 96
APPENDIX H:CORRELATIONS BETWEEN STUDY VARIABLES ... 99
LISTOFTABLES Table
1. Construct validity study overall sample characteristics ... 13
2. Construct validity study overall sample traumatic events and symptoms ... 14
3. Eigenvalues from the initial EFA model ... 16
4. Rotated factor loadings for initial EFA model ... 18
5. Rotated factor loadings for final EFA model ... 20
6.
Model comparison (goodness-of-fit tests between nested models)………. 247. Internal consistency reliability for the Project Broadcast screening tool ... 27
8. Correlations among subscales ... 28
9. SEM study sample characteristics ... 45
10. Rotated factor loadings for final Study 2 EFA model ... 47
LIST OF FIGURES
Figure 1 – Screen plot from initial EFA model ... 17 Figure 2 – Initial CFA model based on final EFA model ... 22 Figure 3 – Final CFA model ... 25 Figure 4 – Conceptual model and hypothesized relationships between variables .... 38 Figure 5 – Matching and sample selection for Study 2 ... 43 Figure 6 – Study 2 final CFA/SEM measurement model ... 49 Figure 7 – Model 1: Initial structural regression model of effects between trauma,
LIST OF ABBREVIATIONS CFA Confirmatory factor analysis
EFA Exploratory factor analysis PB Project Broadcast
INTRODUCTION
Other than play, education is the largest occupation of childhood. In Western countries, and increasingly worldwide, education is seen as an economic investment yielding returns for both individuals and societies – a notion derived from human capital theory (Gillies, 2017). Through education, children acquire human capital in the form of knowledge and skills that will translate into greater opportunities in life. While criticism of this view of education abounds, human capital is a helpful way to conceptualize the assets of education as well as the mechanisms that disrupt the accumulation of those assets. Complex trauma is one such mechanism. Complex trauma refers to the experience of traumatic events as well as their impacts on life outcomes (National Child Traumatic Stress Network, 2018). Assessing complex trauma involves more than just knowledge of whether or not a child was maltreated, but also requires understanding the type, frequency, and chronicity of adverse events as well as their effects across attachment, emotional, behavioral, and health domains (Kisiel, Fehrenbach, Torgersen, Stolbach, McClelland et al. 2014).
increased criminality, lower educational achievement, higher unemployment, and lower income in adulthood even when controlling for demographic and other risk factors, such as low socioeconomic status, family instability, and childhood psychiatric disorders (Copeland et al., 2018; Metzler, Merrick, Klevens, Ports, & Ford, 2017).
While intended to prevent further harm, children receiving child welfare services, especially ones placed into out-of-care, may be placed at risk for more problems. A study found worse mental health and behavioral problems for foster youth compared to youth with similar maltreatment histories who were not placed into care (Lawrence, Carlson, & Egeland, 2006). Another study found that children on the margin of placement (as opposed to those at high risk) had better outcomes related to delinquency, teen motherhood, and employment when they remained in the home, especially older children (Doyle, 2007). Finally, a study found that preschool children placed into out-of-home care had greater odds of substance abuse, mental health disorders, neurodevelopmental disorders, and criminal convictions compared to a matched comparison group not placed into care (Cote, Orri, Marttila, & Ristikari, 2018).
Rather than causing harm, it may actually be that child welfare intervention is not sufficient to meet the needs of youth, especially in addressing the effects of trauma. One study of young adults who were in foster care as teenagers found that this group
This dissertation is comprised of two related studies with the first study laying the foundation for the second study. Study 1 assessed the validity and reliability of the Project Broadcast screening tool, which is intended to measure complex trauma (Sullivan, Preisler, Ake, Potter, & Beck, 2013). The psychometric properties of the tool have not been
STUDY 1: VALIDITY AND RELIABILITY OF THE PROJECT BROADCAST TRAUMA SCREEN
The first study explored the validity and reliability of the Project Broadcast (PB) screening tool, a complex trauma screen that assesses both trauma history and trauma symptoms in a sample of 13,714 child welfare-involved children. This study was the first to test the psychometric properties of the PB screening tool. Methods included an exploratory factor analysis of the screen to examine the factor structure of the tool, which is believed to reflect a child’s trauma history and a constellation of trauma symptoms across multiple domains, including behavioral, emotional, and school. A confirmatory factor analysis was then conducted on the theoretical factor structure suggested by the exploratory factor analysis to provide more evidence of construct validity. In this analysis, the original sample was randomly split so that the EFA and CFA could be performed on separate samples. In addition, the internal consistency reliability of the tool was measured by the coefficient alpha.
The PB tool is believed to measure complex trauma. Assessing complex trauma goes well beyond simple indicators of whether or not a child has been maltreated to include a history of potentially traumatic events and symptoms or reactions to traumatic stress that are collected by reports from youth, child welfare workers, and/or caregivers (Conradi, Wherry, & Kisiel, 2011; Lang et al., 2017). The tool was created for use in a federally
leaders believed that existing tools were too long or complicated for use by front-line staff in county agencies. The project team based the PB tool on the format and features of several other measures, including the CTAC (Henry, Black-Pond, & Richardson, 2010) and the NCTSN Core Clinical Characteristics Trauma Detail Form, as well as the clinical expertise of the project team (Lang et al., 2017).
Training and implementation of the screening tool was guided by a Learning Collaborative framework based on the Institute for Healthcare Improvement’s (2003) Breakthrough Series Model. In this model, intervention designers and key leaders from organizations implementing the intervention collaborate to develop multiple aspects of implementation including goals to guide implementation, metrics to track effectiveness, a selection process to identify the best teams to implement the intervention, and any
preparation needed for participation in Learning Sessions. Usually three members of the implementation teams attend several Learning Sessions over the implementation period and these involve intervention designers presenting the ideal implementation model in the first session and subsequent sessions are focused on successes, barriers, and lessons
learned as team members implement the model. In between these sessions are Action Periods in which team members implement and monitor effectiveness through small tests-of-change, also known as Plan-Do-Study-Act cycles.
and resulted in more appropriate placements and less repeat maltreatment for children in counties that participated in the project (NC DHHS).
In this study, I assessed the validity and reliability of the PB screen which is
intended to measure complex trauma. The validity assessment involved a two-step process. In the first step, an exploratory factor analysis identified the optimal factor structure of the tool. In the second step, a confirmatory factor analysis was used to confirm the structure suggested in the first step and lend support to the construct validity of the tool. Reliability of the final factor solution was assessed by Cronbach’s coefficient alpha, inter-item
correlations, and factor correlations.
Method Data and Measures
Trauma and symptoms. The PB trauma screen is a brief screening tool for social workers to assess trauma history and symptoms in children (Lang et al., 2017; Preisler et al., 2018). The tool combines features from several existing screens into a one-page
screening form, the responses to which are primarily based on worker or caregiver
Procedures
After social workers completed the trauma screening tool, each county faxed completed forms on a regular basis to researchers at UNC-CH. Due to the confidential nature of the data, the only identifiers on the faxed form were the county name and a unique identifier assigned by NC DSS to associate services to the child in the social services administrative data system. Data from the screening forms were entered into a study database. These data were cleaned to eliminate errors in data entry such as forms being entered more than once. In January 2016, UNC-CH established a new data collection
process in which county social workers enter the forms directly into an online survey format rather than faxing paper forms to UNC-CH. This process has increased the speed of data collection and reduced errors in data entry. The survey format includes data validation on the most important fields of the form, such as the unique identifier.
UNC-CH researchers maintain longitudinal datasets of NC DSS administrative data on a secure server as part of the Management Assistance project (Duncan et al., 2018). The screening data were matched to these datasets by the NC DSS identifier to produce a dataset of unique children with demographics and child welfare history along with the screening information. Approximately 90% of screens were matched to the administrative data. Analysis and reports from these data were shared on an ongoing basis with NC DSS and demonstration counties.
these items were recoded to be indicated. In addition, the behavioral, emotional, and school symptoms that were type not otherwise specified were reviewed for possible recoding into more descriptive symptoms. These items include a text response so that respondents could describe the behavior, emotion, or school symptom. Upon inspection, it appeared that some of these items could be recoded based on item descriptions as well as instructions in the companion guide for the tool (Preisler et al., 2018; Appendix B). Based on text analysis, other behavioral, emotional, and school items were recoded into more descriptive items for 682 or 5% of observations and this process is described in more detail in Appendix C, Item Recoding.
All traumatic event types and symptoms were entered into models as binary variables with 0 (not indicated) and 1 (indicated). Given that 1% or less of the sample experienced natural disaster or immigration traumatic event types, these types along with human trafficking were recoded to “other” trauma resulting in 43 items available for factor analysis.
Analysis
This study utilized factor analytic techniques. Researchers use factor analysis to identify a smaller set of factors or latent constructs from a large number of items or
indicators (Worthington & Whitaker, 2006). One of the most common uses of factor analysis is to assess the construct validity of an instrument, e.g. does the instrument measure the intended constructs? Further, factor analysis identifies the underlying structure of the items by revealing the number of constructs measured and the defining features of the constructs (Tabachnick & Fidell, 2001).
analysis given the recommendation that EFA and CFA be performed on separate samples (Cabrera-Nguyen, 2010; Worthington & Whittaker, 2006). EFA allows all items to relate to the underlying factors. Results can then be used to identify items that poorly measure the constructs or measure multiple constructs and can be eliminated from the analysis. In CFA, the researcher defines a priori the factor structure including the number of factors, the items loading on each factor, and whether or not the factors are correlated. The structure defined by the researcher may be based on theory, prior research, or EFA results, as will be the case in this study. This structure is then evaluated to see how well it fits the sample data.
Factor analysis assumes univariate and multivariate normality (Pett et al., 2003). In practice, this assumption is often violated through the widespread use of Likert-type scales and binary items, such as yes/no responses or check-off lists like the items in the Project Broadcast screening tool. These items affect the choice of factor extraction methods1 and estimators used in the analysis. In exploratory factor analysis, Costello & Osborne (2005) recommend principal axis factoring (PAF) over maximum likelihood (ML) when data are significantly non-normal. As a non-statistical estimation method, PAF does not make assumptions about data distribution (Kaplan, 2009; Schmitt, 2011). The drawback of PAF is that it does not produce standard errors that allow for statistical tests of model fit and factor loadings. The current study took a more modern approach to address non-normality by using estimation with robust least squares (LS) or robust weighted least squares (WLS) that uses tetrachoric correlations2 (versus Pearson correlations) in which standard errors
are available for model and parameter testing (Rhemtulla, Brosseau-Liard, Savalei, 2012; Schmitt, 2011).
Sample size adequacy. Various recommendations exist for the minimum sample size needed for factor analysis, but their usefulness has been seriously questioned as they do not take into account all of the aspects that affect statistical power and precision, such as data distribution, model complexity, strengths of relationships between items and factors, and so on (MacCallum, Widaman, Zhang, & Hong, 1999; Marsh, Hau, Balla, & Grayson, 1998; Schmitt, 2011). Formal methods are available for estimating sample size, such as Monte Carlo studies, but require knowledge of population parameters from theory or previous research, which may not be available in the case of new instruments like the one in the current proposed study (Muthén & Muthén, 2002). In general, I followed the
recommendation of Costello & Osborne (2005) that caution that factor analysis is a large sample method and that subject to item ratios above 20:1 are superior unless the study data are of unusually high quality. In the current study, the PB trauma screen has 45 items and under a 20:1 ratio would require at least 900 subjects in the sample. This threshold is greatly exceeded by the available sample of 6,857 subjects with over 150 subjects per item.
EFA procedures. First, I evaluated the factorability of the Project Broadcast trauma screen items by reviewing item correlations and the results of the Bartlett’s Test of
Sphericity and the Kaiser-Meyer-Olkin Measure of Sampling Adequacy (KMO) (Pett et al., 2003). Each item should have at least one and preferably more correlations over 0.30 and all correlations should be under 0.90. The Bartlett test should be significant at p < 0.05 and the KMO measure of at least 0.60.
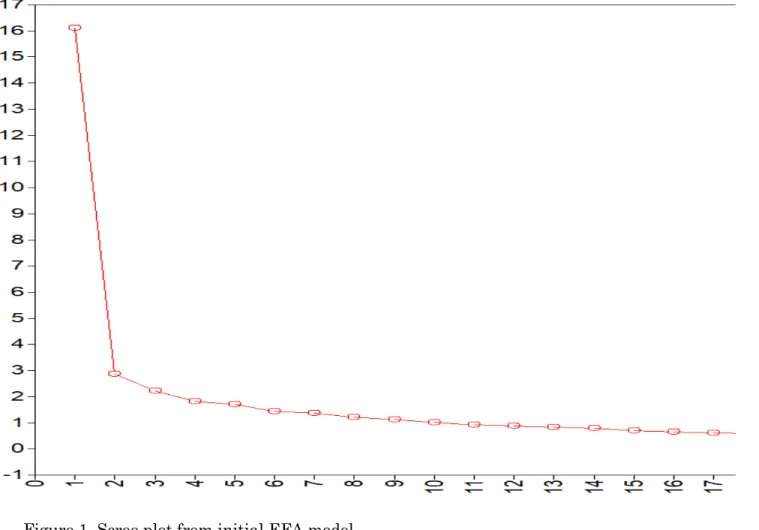
number of factors to be retained. With the WLSMV estimator, model fit statistics between models with a varying number of factors can be compared with better fit indicated by model x2 or exact-fit test p > 0.05, root mean square error of approximation (RMSEA) less than 0.06, standardized root mean square residual (SRMR) less than 0.08, and comparative fit index (CFI) greater than 0.95 (Bentler, 2007; Hu & Bentler, 1999). It must be noted that the exact-fit test is particularly sensitive to model-data discrepancies in samples larger than 200 to 300 observations, as is the case for this study, and thus the test will indicate poor fit when that may not be the case (Kline, 2016). That is why it was also important to include the other fit indices which are less sensitive to sample size. The number of factors to be retained was also evaluated by eigenvalues greater than 1.0 and examination of a scree plot with the number of points above the break point in the data indicating how many should be obtained (Costello & Osborne, 2005).
I used the Geomin oblique rotation method to aid in interpreting the factor structure as oblique rotation allows factors to be correlated as one might expect of constructs related to human behavior (Costello & Osborne, 2005). Through an iterative process, items were evaluated and eliminated if they had weak loadings (<0.32) or cross loadings on multiple factors (>= 0.32) and factors were considered for elimination if they had fewer than three loadings of >= 0.50 (Costello & Osborne, 2005). Fit statistics were also reviewed after items and factors were eliminated. Overall, the final factor solution, in addition to having
acceptable statistical fit, was interpretable in that factors were logically coherent and theoretically consistent.
analysis (Worthington & Whittaker, 2006). Like in the EFA, I employed the WLSMV estimator in Mplus and then evaluated the fit with the model x2, RMSEA, SRMR, and CFI. If the model has acceptable fit, then the validity of the tool is supported.
Internal consistency reliability. Internal consistency reliability is the degree of interrelatedness among items of an instrument or its subscales (DeVellis, 2012; Pett et al. 2003). Cronbach’s coefficient alpha is a widely used internal consistency measure which shows the proportion of total variance that is attributed to a common source, in other words the latent variable of interest, and any remaining variation is considered error (DeVellis). Instruments with high internal consistency have less error and thus are more reliable.
Coefficient alpha is calculated as follows:
𝛼𝛼=𝑘𝑘 −𝑘𝑘1�1−∑ 𝜎𝜎𝑖𝑖2 𝜎𝜎𝑥𝑥2 �
Where α = coefficient alpha, k = number of items in the scale, ∑ 𝜎𝜎𝑖𝑖2 = sum of the variances of the items, 𝜎𝜎𝑥𝑥2 = variance of the scale’s composite score. Because Cronbach’s coefficient alpha is intended to be used with at least ordinal level data, the Kuder-Richardson 20 (KR-20) formula is used with dichotomous or binary data, as is the case with the PB tool (Pett et al., 2003). In this formula, 𝜎𝜎𝑖𝑖2 is substituted with the variance of the binary item (𝑝𝑝
𝑖𝑖𝑞𝑞𝑖𝑖): 𝛼𝛼=𝑘𝑘 −𝑘𝑘 1�1−∑ 𝑝𝑝𝜎𝜎𝑖𝑖𝑞𝑞𝑖𝑖
𝑥𝑥2 �
Where p = proportion of respondents who have a score of 1 on item i, q = proportion of respondents who have a score of 0 on item i, 𝜎𝜎𝑥𝑥2 = variance of the scale’s composite score.
1996; Taber, 2017). These measures are reported in the results along with the overall alpha and all analyses will be conducted with IBM SPSS Statistics Version 26 or Mplus software.
Results Sample Description
The overall sample consisted of 13,714 children screened for trauma with the 6 to 21 version of the tool. The sample was comprised of 50% males and 50% females and 42% were white, 37% were Black, 14% were Latinx, and 7% were of other race or ethnicity (see Table 1). The average age was 11.6 (SD=3.5) and ranged from 5 to 21.
Table 1. Construct validity study overall sample characteristics (N=13,714).
% or Mean (Range), SD
Gender
Male 50%
Female 50%
Race/Ethnicity
White 42%
African American 37%
Latinx 14%
Other 7%
Age 11.6 (5.0-21.0), 3.5
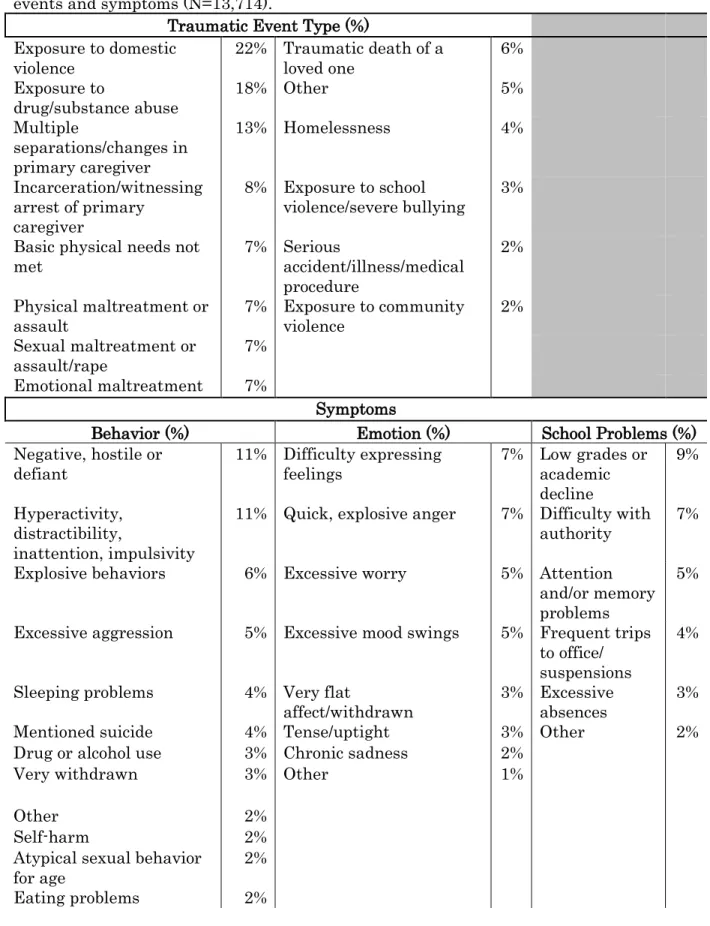
The most common traumatic events experienced by the sample were exposure to domestic violence (22%), exposure to substance abuse (18%), and multiple separations from primary caregiver (13%) (see Table 2). Between 5% and 8% of the sample had events
including incarceration or witnessing arrest of the primary caregiver, unmet physical
Table 2. Construct validity study overall sample traumatic
events and symptoms (N=13,714).
Traumatic Event Type (%)
Exposure to domestic
violence 22% Traumatic death of a loved one 6%
Exposure to
drug/substance abuse 18% Other 5%
Multiple
separations/changes in primary caregiver
13% Homelessness 4%
Incarceration/witnessing arrest of primary
caregiver
8% Exposure to school
violence/severe bullying 3%
Basic physical needs not
met 7% Serious accident/illness/medical procedure
2%
Physical maltreatment or
assault 7% Exposure to community violence 2%
Sexual maltreatment or
assault/rape 7%
Emotional maltreatment 7%
Symptoms
Behavior (%) Emotion (%) School Problems (%)
Negative, hostile or
defiant 11% Difficulty expressing feelings 7% Low grades or academic decline
9%
Hyperactivity, distractibility,
inattention, impulsivity
11% Quick, explosive anger 7% Difficulty with authority 7% Explosive behaviors 6% Excessive worry 5% Attention
and/or memory problems
5%
Excessive aggression 5% Excessive mood swings 5% Frequent trips to office/ suspensions
4%
Sleeping problems 4% Very flat
affect/withdrawn 3% Excessive absences 3%
Mentioned suicide 4% Tense/uptight 3% Other 2%
Drug or alcohol use 3% Chronic sadness 2%
Very withdrawn 3% Other 1%
Other 2%
Self-harm 2%
Atypical sexual behavior
for age 2%
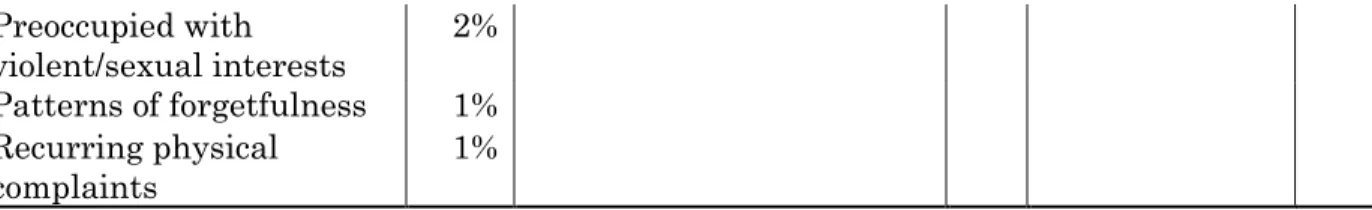
Preoccupied with
violent/sexual interests 2%
Patterns of forgetfulness 1%
Recurring physical
complaints 1%
Table 2 also includes behavioral, emotional, and school symptoms indicated for the sample. The most frequent behavioral symptoms were negative or hostile behavior (11%), hyperactivity or inattention (11%), explosive behaviors (6%), and excessive aggression (5%). Other behavioral symptoms exhibited by less than 5% of sample were sleeping problems, mentioned suicide, drug or alcohol use, very withdrawn, self-harm, atypical sexual behavior for age, eating problems, preoccupied with violent/sexual interests, forgetfulness, recurring physical complaints, and a type not otherwise specified. Common emotional symptoms were difficulty expressing feelings (7%), explosive anger (7%), excessive worry (5%), and
excessive mood swings (5%). Somewhat less common symptoms at under 5% of the sample were flat affect, tension, chronic sadness, and a type not otherwise specified. The most frequently cited problems in school were low grades (9%), difficulty with authority (7%), and attention or memory problems (5%) with less than 5% having frequent trips to the office or suspensions, excessive absences, or a type not otherwise specified.
Random Split
I used the random selection procedure in the IBM SPSS Statistics Version 26 software program to split the sample into approximately half with 6,817 subjects for the EFA sample and 6,897 for the CFA sample.
Review of the item tetrachoric correlation coefficients showed that each item had at least one correlation over 0.30 and that all correlations were under 0.90. The correlation matrix is displayed in Appendix D and item descriptions are shortened given that many data points are shown.
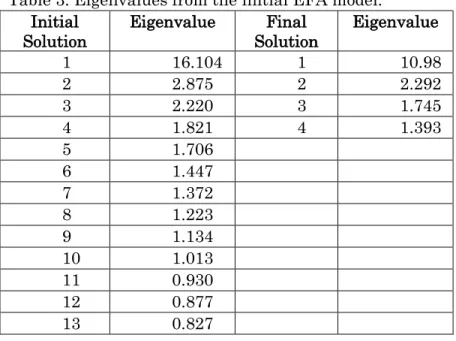
Initial solution. The initial EFA model included all 43 items. Eigenvalues indicated that 10 factors should be retained from the initial solution while the scree plot was difficult to discern (see Table 3 and Figure 1). Model fit statistics, particularly the model chi-square, indicated that 13 factors should be retained (χ2 (422) = 470.218, p. = 0.05;
RMSEA=0.004[90% CI 0.000, 0.006; SRMR=0.028; CFI =0.999). Fewer factors resulted in a significant model χ2, although other fit statistics still had good fit. The eigenvalues showed that much of the variance in the items was explained by a single factor while the remaining factors contributed less overall. Table 4 displays the rotated factor loadings for the initial solution.
Table 3. Eigenvalues from the initial EFA model. Initial
Solution Eigenvalue Solution Final Eigenvalue
1 16.104 1 10.98
2 2.875 2 2.292
3 2.220 3 1.745
4 1.821 4 1.393
5 1.706
6 1.447
7 1.372
8 1.223
9 1.134
10 1.013
11 0.930
12 0.877
Table 4. Rotated factor loadings for initial EFA model
Item Item Description 1 2 3 4 5 6 7 8 9 10 11 12 13
trauma1 Emotional maltreatment 0.081 0.132 0.049 0.084 0.071 -0.047 0.015 -0.027 0.222* -0.049 0.261 0.495* -0.029 trauma2 Accident/illness -0.123 0.465* -0.022 0.015 -0.031 -0.018 0.037 0.05 -0.032 -0.246 0.288 -0.03 0.433* trauma3 Physical needs 0.017 0.149 -0.021 0.031 -0.012 0.028 0.03 0.008 0.442* -0.041 0.535* 0.156 -0.057 trauma4 Community violence 0.103 -0.018 0.049 0.016 0.079 0.169 -0.015 -0.024 0.274* 0.014 -0.027 0.067 0.401* trauma5 Death of loved one -0.04 0.13 0.145 -0.113 0.079 0.244* 0.06 -0.111 0.152 -0.011 0.029 -0.016 0.358* trauma6 Other 0.185 0.013 -0.072 0.061 0.249* -0.011 -0.086 0.369* -0.15 -0.009 -0.024 -0.043 0.276* trauma7 Substance abuse -0.049 0.036 0.283* -0.058 -0.019 0.225* -0.055 0.058 0.748* 0.002 -0.012 0 -0.006 trauma8 Domestic violence -0.014 -0.003 -0.016 0.003 -0.005 -0.009 0.035 0.037 0.563* 0.076 -0.252 0.438* -0.011 trauma9 Homelessness -0.001 0.238 -0.151 0.021 0.012 0.08 0.044 -0.118 0.379* 0.043 0.373* -0.014 0.005 trauma10 Parent incarceration/arrest
0.178 -0.011 -0.035 0.067 -0.014 -0.017 -0.024 0.032 0.594* 0.037 -0.024 -0.036 0.311* trauma11 Physical maltreatment
0.072 0.015 -0.016 0.054 0.019 0.079 0.041 0.024 0.026 -0.007 0.016 0.725* 0.007 trauma12 School violence/bullying
0.134 0.184 0.165 0.084 -0.007 -0.03 0.152 -0.049 0.012 0.287* -0.154 0.009 0.246* trauma13 Separations
0.226* -0.015 0.006 0.120* 0.126* -0.009 0.021 -0.084 0.453* -0.095 0.131 0.061 0.096 trauma14 Sexual maltreatment
Final solution. I proceeded with the 13 factor model through several iterations of removing weak loadings, cross-loadings, and factors with fewer than three loadings of >= 0.50. The final best fitting solution was a 4 factor model (χ2 (227) = 692.860; p. = 0.000; RMSEA=0.017[90% CI 0.016, 0.019]; SRMR= 0.044; CFI =0.987) with 26 items. While the model x2 was significant, the other fit indices were all very good. Again eigenvalues indicated that much of the variance was explained by a single factor (see Table 3). Traumatic event type items that were not included in the final model were accident or illness, death of loved one, and other type. Excluded behavior items were drug or alcohol use (by youth), forgetfulness, other type, self-harm, sleeping, and suicidal ideation. Worry, tense, (difficulty) expressing feelings, and other type emotion items were also not retained. Finally, most school items were not included, specifically, attention, absences, other type, and (trips to) office or suspensions.
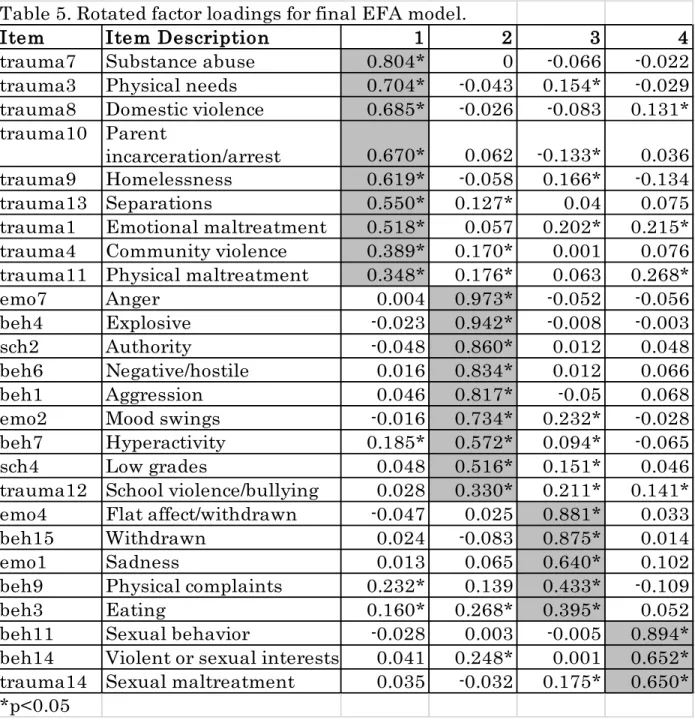
Table 5 displays the final model rotated loadings sorted by largest to smallest loadings on each factor. In general, traumatic event type items tended to load together while symptom items loaded across domains. The first factor had 9 traumatic event type loadings including (exposure to) substance abuse, physical needs (not met), domestic violence, parent incarceration or arrest, homelessness, separations, emotional
Factor 2 had some of the strongest loading items including (quick, explosive) anger, explosive (behaviors), (difficulty with) authority, negative/hostile/defiant behaviors,
(excessive) aggression, mood swings, hyperactivity (distractibility, inattention, impulsivity), and low grades. One traumatic event type – (exposure to) school violence and/or severe bullying also loaded on this factor, albeit weakly. Most of these types of items are often characterized as externalizing symptoms (Achenbach & Edelbrock, 1978). Symptoms that
Table 5. Rotated factor loadings for final EFA model.
Item
Item Description
1
2
3
4
trauma7
Substance abuse
0.804*
0
-0.066
-0.022
trauma3
Physical needs
0.704*
-0.043
0.154*
-0.029
trauma8
Domestic violence
0.685*
-0.026
-0.083
0.131*
trauma10 Parent
incarceration/arrest
0.670*
0.062 -0.133*
0.036
trauma9
Homelessness
0.619*
-0.058
0.166*
-0.134
trauma13 Separations
0.550*
0.127*
0.04
0.075
trauma1
Emotional maltreatment
0.518*
0.057
0.202*
0.215*
trauma4
Community violence
0.389*
0.170*
0.001
0.076
trauma11 Physical maltreatment
0.348*
0.176*
0.063
0.268*
emo7
Anger
0.004
0.973*
-0.052
-0.056
beh4
Explosive
-0.023
0.942*
-0.008
-0.003
sch2
Authority
-0.048
0.860*
0.012
0.048
beh6
Negative/hostile
0.016
0.834*
0.012
0.066
beh1
Aggression
0.046
0.817*
-0.05
0.068
emo2
Mood swings
-0.016
0.734*
0.232*
-0.028
beh7
Hyperactivity
0.185*
0.572*
0.094*
-0.065
sch4
Low grades
0.048
0.516*
0.151*
0.046
trauma12 School violence/bullying
0.028
0.330*
0.211*
0.141*
emo4
Flat affect/withdrawn
-0.047
0.025
0.881*
0.033
beh15
Withdrawn
0.024
-0.083
0.875*
0.014
emo1
Sadness
0.013
0.065
0.640*
0.102
beh9
Physical complaints
0.232*
0.139
0.433*
-0.109
beh3
Eating
0.160*
0.268*
0.395*
0.052
may be characterized as more internalizing symptoms loaded on Factor 3. These items included flat affect/withdrawn, withdrawn (or excessively shy), sadness, physical complaints, and eating problems.
The next section describes results from a confirmatory factor analysis based on the structure suggested by the EFA.
Confirmatory Factor Analysis
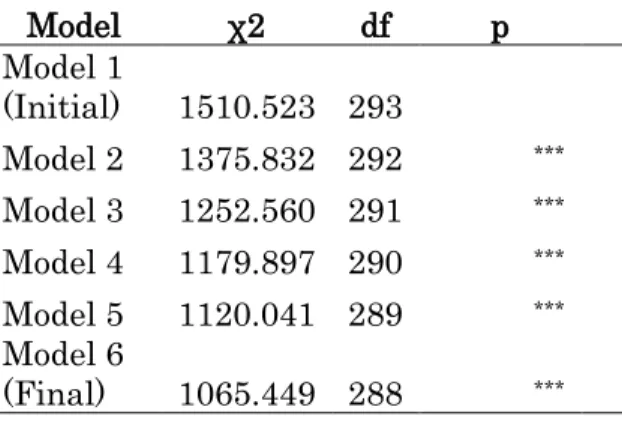
Based on the EFA structure, 26 items loading on four factors with no cross-loadings were entered into a CFA model. The model fit indices were mixed with a significant chi-square (χ2 (293) = 1510.523, p. = 0.00) showing poor fit while other indices
With this in mind, I made several successive re-specifications starting with the largest modification index that was substantively meaningful. The modifications included correlating the error term of the withdrawn or shy behavior item (beh15) with the flat affect or withdrawn emotion item (emo4) as they likely share unique variance given that both items specify “withdrawn” as a symptom (MI = 147.373). The next modification concerned allowing the physical maltreatment item (trauma11) to cross-load on both the general trauma factor (f1) and the externalizing symptoms factor (f2) (MI = 130.413). That physical maltreatment might also be associated with symptoms, such as anger, explosive behaviors, and aggression, appeared reasonable. Next, I allowed the error term to be correlated between the anger (emo7) and explosive behaviors (beh4) items as an association between these items seems likely (MI = 74.332). Then I allowed the error term to be correlated between unmet physical needs (trauma3) and homelessness (trauma9) as these items likely shared unique variance (MI = 62.220). The final re-specification was to allow emotional maltreatment (trauma1) to cross-load on both the general trauma factor (f1) and the sexual trauma and symptoms factor (f4) as an association between this item and factor seemed reasonable (MI = 53.750).
over-Table 6: Model comparison (goodness-of-fit tests between nested models)
Model χ2 df p
Model 1
(Initial) 1510.523 293 Model 2 1375.832 292 *** Model 3 1252.560 291 *** Model 4 1179.897 290 *** Model 5 1120.041 289 *** Model 6
(Final) 1065.449 288 ***
Overall, these findings support the construct validity of the Project Broadcast tool in measuring trauma and symptoms in the children screened. That most traumatic event types loaded on one factor suggests that the tool was measuring an underlying general trauma construct. The underlying sexual trauma construct was more complex in that sex-related symptoms also loaded on this factor. However, most symptoms did load together and not along with traumatic event types. Symptoms did not tend to fall along the
behavioral, emotional, or school domains outlined in the tool itself. Rather they loaded with either an externalizing symptoms or an internalizing symptoms construct. This finding is consistent with a large body of research that supports this constellation of symptoms along those two dimensions. Many of the original items were not retained in the final model which suggested several avenues for adjusting the PB tool. The implications of these findings are explored further in the discussion section below.
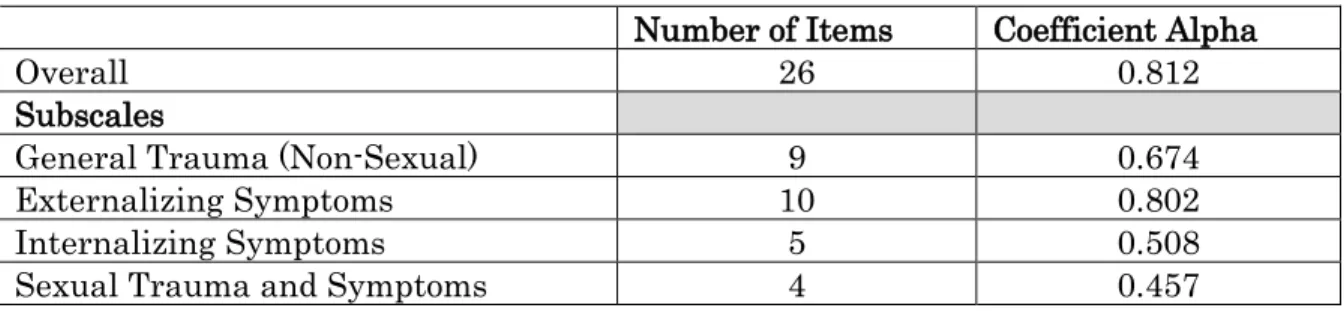
Internal Consistency Reliability
Table 7. Internal consistency reliability for the Project Broadcast screening tool
Number of Items Coefficient Alpha
Overall 26 0.812
Subscales
General Trauma (Non-Sexual) 9 0.674
Externalizing Symptoms 10 0.802
Internalizing Symptoms 5 0.508
Sexual Trauma and Symptoms 4 0.457
Inter-item correlations were also reviewed for the overall scale as well as each subscale. The inter-item correlations for the overall scale ranged from 0.167 to 0.893 and were all significant at p < 0.01. For general trauma (non-sexual), inter-item correlations ranged from 0.217 to 0.650 and were all significant at p < 0.000. For the externalizing symptoms subscale, the inter-item correlations ranged from 0.352 to 0.893 and were all significant at p < 0.000. Inter-item correlations for the internalizing symptoms subscale ranged from 0.375 to 0.780 and were all significant at p < 0.000. Finally, for the sexual trauma and symptoms subscale, inter-item correlations ranged from 0.383 to 0.748 and were all significant at p < 0.000.
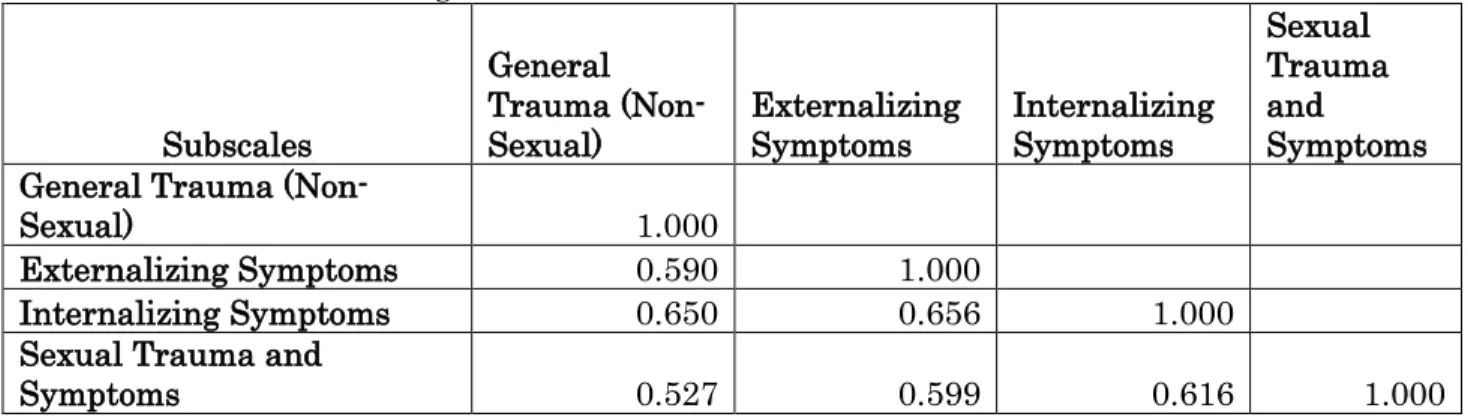
Table 8. Correlations among subscales.
Subscales
General Trauma
(Non-Sexual) Externalizing Symptoms Internalizing Symptoms
Sexual Trauma and
Symptoms General Trauma
(Non-Sexual) 1.000
Externalizing Symptoms 0.590 1.000
Internalizing Symptoms 0.650 0.656 1.000
Sexual Trauma and
Symptoms 0.527 0.599 0.616 1.000
Based on these analyses, I concluded that the Project Broadcast tool has acceptable reliability overall.
Discussion
sex-related symptoms for older youth in particular. These items could include sexually high risk behaviors, such as having older or multiple partners, evidence of sexually-transmitted diseases, pregnancy, and instances in which the youth has engaged in sexually aggressive or offending behaviors.
Of the 43 original items, the final model only retained 26 items. This finding suggested that the dropped items were not good measures of the underlying constructs. However, I do not recommend dropping any of the traumatic event types from the tool. These forms are used by social workers to document a child’s case history and it would still be important to know if a child had experienced a serious accident or illness or traumatic death of a loved one. In addition, having a way to capture traumatic event types that are less common in the other type description is important. Future research should analyze these events to see if a pattern emerges suggesting a new traumatic event type needs to be added.
many common items between these tools so a combined analysis of the two versions could also be conducted. In addition, a future study should test the screen’s measurement invariance or the degree to which the tool operates equivalently across different groups, such as gender, age and race. In other words, is the tool measuring something different in one group versus another? Finally, alternative models should be tested and compared to this study’s models. For example, a study could explore the possibility that a higher order model in which one common factor explains all of the covariation between the four first-order factors identified in this study has a better fit to the data.
There are potential limitations associated with the study. First, the design of the PB tool as a check-off list means that it is not possible to know if an item is missing rather than just not indicated. Thus, any effects of missing data for trauma and symptoms cannot be estimated and addressed in the study. Next, there was some loss of information when screens did not match to child welfare administrative data. In addition, ideal scale development involves conducting an EFA on one sample followed by a CFA on a second, separate sample. Replication of the hypothesized factor structure in a new sample provides key support to the validity of the scale (Worthington & Whitaker, 2006). While I attempt to address this concern in this study by randomly splitting the available sample between the two types of factor analyses, it is difficult to know how the results in this study may differ from one conducted with an entirely new sample. An alternative to randomly splitting the sample could be to use earlier screening data for the EFA and later screening data for the CFA or compare data between different counties. However, rather than solving problems, this approach could introduce systematic variation between the samples, such as
In conclusion, the results of this study provided important evidence for the PB tool’s validity and reliability as well as offered guidance for improvements. This study is
STUDY 2: THE IMPACT OF COMPLEX TRAUMA ON HUMAN CAPITAL
The second study evaluated the relationship between complex trauma, as measured by the Project Broadcast tool, and human capital for a sample of school-aged children. Human capital is conceptualized as encompassing both the “hard” (academic or technical) and “soft” skills (socio-emotional competencies) that children need to succeed in the school environment and beyond. Higher human capital results in better long-term educational as well as employment outcomes. Complex trauma has been associated with lower educational achievement. The mechanisms by which trauma affects education and a range of other outcomes are just beginning to be understood by researchers. In addition, while child welfare intervention is intended to prevent further harm, its effectiveness at healing trauma and improving human capital are not clear. The proposed study will advance research in this area by exploring how complex trauma may disrupt children’s
accumulation of human capital and the role of child welfare intervention may play in this process through the use of structural equation modelling.
Human Capital Theory and Education
The popular view of education in Western countries is that of an economic investment yielding returns for both individuals and societies (Gillies, 2017). Human
capital theory undergirds this line of thinking. From the economist’s viewpoint, spending on education, training, and medical care, for example, are investments in human capital
physical and financial assets. Thus, even in the absence or loss of other assets, individuals can retain their human capital that can be translated into greater opportunities in life.
Human capital theory’s definition of capital is similar to that of Marx in that it is seen as an investment with an expected return, but diverges significantly in the sense that laborers and not just owners have an opportunity to invest through their own education and training (Lin, 1999). Rooted in neoclassical economics, human capital theory has several propositions including: Acquired skills are a form of capital – human capital; human capital is obtained through deliberate investments in education; these skills contribute to economic production; and earnings reward an individual’s productivity (Fitzsimons, 2017; Little, 2003). In this theory, both individuals and firms (or larger social entities, such as, nations) benefit from investments in education. In the context of children’s education, parents are investors as well.
Research support. Higher human capital results in improved long-term employment and earnings outcomes. In addition to being more likely to be employed, individuals with higher education levels have greater earnings (Baum, Ma, Payea, 2013). For example, individuals working full-time who had a bachelor’s degree had median earnings $20,000 more than high school graduates in 2011. Even individuals with some college but no degree reported higher earnings than high school graduates. Unsurprisingly, the lowest earners are those without a high school diploma who earn about $10,000 less than high school graduates.
predicting performance in education and employment, among other outcomes (Kautz, Heckman, Diris, t. Weel, & Borgans, 2014). Lippman et al. (2015) identified five key soft skills associated with successful employment for youth including higher-order thinking, self-control, positive self-concept, social skills, and communication skills.
Criticism. Critiques of human capital theory, as with neoclassical economics in general, coalesce around the treatment of the economy and individual choices as separate from cultural and political forces and the key assumption that individuals act rationally to maximize rewards (Fitzsimons, 2017). Empirical findings from the field of behavioral economics show that individuals often act in ways that are against their economic interests (Knoll, 2010). In addition to individual factors, such as intellectual or learning disabilities, many factors impinge on children’s engagement in school and the quality of the education available to them that are outside of their control, such as interpersonal and family violence, community violence, family instability, poverty, and school and neighborhood deprivation. Many of these factors are part of a constellation of adverse traumatic events and their impact on education is explored in the following section.
Trauma Effects on Education
Chapman, Spetz, & Brindis, 2017; Overstreet & Mathews, 2011). These findings support a comprehensive measure of trauma, like the Project Broadcast screening tool, that is
inclusive of a range of adverse events as well as symptoms.
Child welfare population. A large body of research shows that the school performance of maltreated children, especially those placed into out-of-home care, is
generally worse than that of their non-maltreated peers. Achievement test scores tend to be lower while grade retention and dropout rates are higher for maltreated children (Barrat & Berliner, 2013; Berger, Cancian, Han, Noyes, & Rios-Salas, 2015; Clemens & Tis, 2016; Fantuzzo & Perlman, 2007; Fantuzzo, Perlman, & Dobbins, 2011; Smithgall, Gladden, Howard, Goerge, & Courtney, 2004; Scherr, 2007; Stone, 2007). Studies also show that maltreated children struggle more than their peers in non-academic areas as well, such as having more emotional or behavioral problems, lower attendance rates, higher discipline and suspension rates, and greater difficulties with classmates (Fantuzzo et al., 2011; Scherr, 2007; Smithgall et al., 2004).
with particularly vulnerable periods near the time that the child enters care and a greater effect when placement co-occurs with a change in school (Clemens, Klopfenstein, Lalonde, & Tis, 2018; Olsen & de Montgomery, 2018).
Researchers have examined variation in effects on school performance by age of onset, duration, and type of maltreatment. Early and chronic maltreatment tends to be associated with worse outcomes (Fantuzzo et al., 2011; Leiter & Johnson, 1997; Slade & Wissow, 2007). Results related to type of maltreatment have been less consistent with some evidence suggesting that neglected children tended to perform less well overall relative to other types of maltreatment while physically abused children had more behavioral
problems in school (Eckenrode et al., 1993; Leiter & Johnson, 1994; Kendall-Tackett & Eckenrode, 1996; Fantuzzo et al., 2011; Stone, 2007).
Research Questions
The primary objective of the proposed study is to examine the effects of complex trauma on the human capital of school-aged children involved in child welfare. The secondary objective is to examine the role, if any, that out-of-home care plays in this process. The conceptual model and hypotheses are addressed below.
Model and Hypotheses
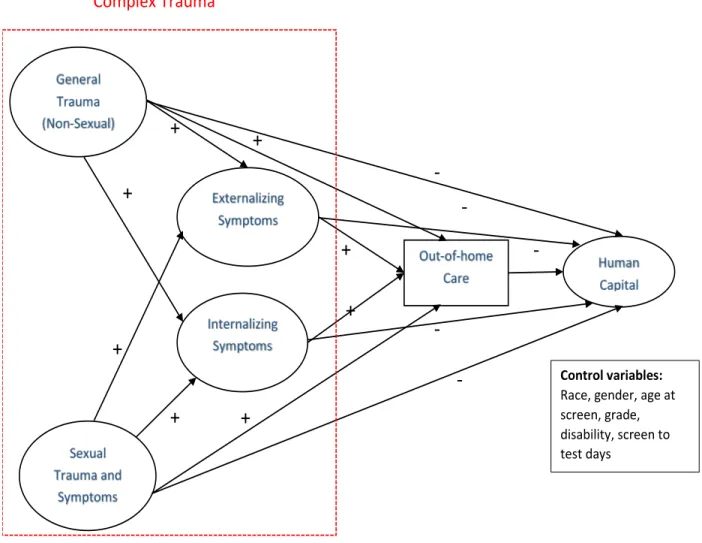
This study was informed by the results of the first study of the construct validity of the Project Broadcast screening tool in defining the structure of complex trauma (trauma history and trauma symptoms) in the study’s conceptual model (see Figure 4). That study showed complex trauma as made up of four factors including general trauma (non-sexual), sexual trauma and related symptoms, externalizing symptoms, and internalizing
In the model, complex trauma is represented by the latent exogenous variables of general trauma (non-sexual) and sexual trauma and related symptoms and the endogenous variables of externalizing and internalizing symptoms. General trauma includes many traumatic event types which were non-sexual, such as substance abuse, unmet physical needs, domestic violence, witnessing parent incarceration and so on. Sexual trauma and related symptoms include sexual maltreatment and sex-related symptoms like sexual behavior not typical for a child’s age. Externalizing symptoms include more outwardly expressed emotions and behaviors, such as anger, explosive behaviors, difficulty with authority, and negative/hostile behavior, among others. Internalizing symptoms include more internal emotions or behaviors, such as flat affect, withdrawn, sadness, physical complaints, and eating problems. Out-of-home care is defined as a child being in foster care at the time of the screening based on the case type indicated on the form or the dates of entry into care3. Human capital is comprised of cognitive and non-cognitive measures of human capital in school-aged children, including end of grade reading scores, math scores, and absences4. Finally, exogenous control variables include race, gender, age at screen, grade, disability, and days between screen and test.
Based on prior research, I hypothesized the following relationships among variables: 1) general trauma and sexual trauma will have direct effects on externalizing symptoms, internalizing symptoms, out-of-home care, and human capital that is characterized by
3 Originally, I intended to use a measure of child welfare intervention to include a range of services
increasing symptoms and out-of-home care and decreasing human capital; 2) general trauma and sexual trauma will also have indirect effects on out-of-home care and human capital through externalizing and internalizing symptoms; 3) externalizing and
internalizing symptoms will have direct effects on out-of-home care (increasing) and human capital (decreasing); 4) out-of-home care will be associated with decreasing human capital; and 5) general trauma, sexual trauma, externalizing symptoms, and internalizing
symptoms will have indirect effects on human capital through out-of-home care. Hypothesized directions (+/-) of relationships are also noted on Figure 4.
Figure 4. Conceptual model and hypothesized relationships between variables.
+
+
+
-
+
+
-
-
-
-
+
+
+
Complex Trauma
Temporal precedence is necessary to make any claims about the causal effects of complex trauma and out-of-home care on human capital (Kline, 2016). To meet this requirement, the study design will look at measures of human capital that were assessed after a child was screened for trauma and symptoms and was in out-of-home care.
Temporal precedence is not sufficient to claim causality as other aspects of research design must also support such a claim. Since they were measured concurrently with trauma history, only indirect effects on human capital through symptoms and out-of-home care could be claimed as opposed to a mediational role. For a variable to be established as a mediator, as opposed to just an indirect effect, it must be truly intervening by occurring between one variable and a third variable (Kline). There were too few cases in the dataset in which entry into out-of-home care clearly occurred between screening and end-of-grade testing.
Method Data and Measures
The study used trauma history and symptoms data from the Project Broadcast screening tool (see detailed description in the Study 1, Method section). The measures were based on the factor structure suggested by Study 1 which was tested again in factor
General trauma (non-sexual). This measure included 9 traumatic event type items of substance abuse, unmet physical needs, exposure to domestic violence, parent incarceration or witnessing a parent’s arrest, homelessness, multiple separations from primary
caregivers, emotional maltreatment, community violence, and physical maltreatment. Sexual trauma and symptoms. This measure consisted of 3 items that included the sexual maltreatment traumatic event type and symptoms of sexual behavior not typical for child’s age and violent or sexual interests.
Externalizing symptoms. This measure included 8 symptom items and 1 traumatic event type. These items were explosive anger, explosive behaviors, difficulty with authority, negative/hostile/defiant behavior, excessive aggression, excessive mood swings,
hyperactivity/distractibility/inattention/impulsivity, low grades or academic decline, and the exposure to school violence and/or severe bullying traumatic event type.
Internalizing symptoms. This measure consisted of 5 symptom items including flat affect or withdrawn behavior, withdrawn or excessively shy, chronic sadness, recurring physical complaints, and eating problems.
Out-of-home care. This measure was defined as a binary variable with indicating 0 if a child was not in foster care or 1 the child was in foster care at the time of the screening based on the case type indicated on the form or the dates of entry into care from the child welfare administrative data.
beginning in 3rd grade until 8th grade. Soft skills were represented by the number of absences during the school year.
Control variables5. Currently available education statistics and past research suggested potential control variables for the human capital measures. Race was included given persistently higher scores for White students compared to Black and Latinx students in math and reading tests (U.S. Department of Education, 2018). In the study, race
included Black, Latinx, other race or ethnicity, and White as the reference group. For gender, while national test scores between girls and boys are similar, North Carolina data show girls tend to have higher reading scores than boys (U.S. Department of Education, 2018). In the study, males served as the reference group.
Both age at the time of screening and grade were included to control for increases in scores due to maturation. Disability was included given that students with disabilities6 have lower test scores and foster care children are over-represented in this population (Scherr, 2007; U.S. Department of Education, 2018). In the study, disability was a binary variable with 1 indicating a disability and 0 indicating none. Finally, the number of days between when a child was screened and tested was also used as a control given that, while there had to be at least one day between, there was no upper limit set.
Sample Selection
The sample were selected from a subset of the trauma screen population that were matched to the education data records by North Carolina Education Research Data Center
5 Prior year test scores were also considered as control variables to account for children’s past
(NCERDC) and are in the 3rd to 8th grades. Figure 5 shows the matching and selection process in detail. The sample were part of a large group of children who received human services sent by the Management Assistance project at UNC-CH (Duncan et al., 2018) to the NCERDC for matching to educational records (see Appendix E for a description of matching procedure and results). UNC-CH included unique identifiers to be used in matching as well as a randomly-generated pseudo-identifier to link back to study datasets as data released by the NCERDC after linking included only de-identified data. Of the 17,706 children with screening data sent for matching, 10,969 children were matched to the screening data, which was the largest loss of children in the initial dataset. However, 84% of the 6,737 of children who were not matched had the under 6 version of the tool which suggested that they were not yet old enough at the time of matching to have an educational record in the NCERDC data which begins with 3rd grade testing. The sample was then reduced by 3,247 to 7,772 because these children had testing data during the years 2013-2017 in which screening data were collected. I discovered 341 duplicates in the sample which was reduced to 7,381 unique children. The pool was then reduced to 4,166 to exclude 3,215 children who did not have 3rd through 8th testing data, which were the EOGs of interest in the study.
children with disabilities. These students likely had significant disabilities that affected their scores so like children who are not able to take the tests due to their disabilities, they were not included in the sample. Finally, an additional 2.4% of the initial sample were not included because the screen used was the under 6 version. Even with these exclusion criteria 91% of the children were retained and the final sample consisted of 3,796 children. If a child had multiple screens associated with multiple tests, then I used data from the most recent screen and test pair.
Figure 5. Matching and sample selection in Study 2.
Analysis
causal effects of latent variables. It should be noted that the use of SEM in a study alone does not mean that causality can be claimed as other aspects of research design, such as random selection, have to be present as well. One chief advantage of SEM over other techniques, such as multiple regression, is the explicit inclusion of measurement error that can be associated with both observed variables and latent factors (Kline, 2016). Residual terms are represented as latent variables in the model since error variance is estimated rather than being observed directly in the raw data. Maximum likelihood estimation is one of the more common estimation methods in SEM (Kline, 2005). However, given the study’s use of binary data and thus violation of maximum likelihood’s requirement of multivariate normality, I will employ the robust weighted least squares estimator in the Mplus software (Muthén & Muthén, 1998-2017).
I followed a two-step modeling (Anderson and Gerbing, 1988) approach for testing the SEM model. In two-step modeling, the model is first re-specified as a measurement model and confirmatory factor analysis (CFA) is used to determine the model’s fit to the data. The measurement model may need to be refined by deleting non-significant factor loadings or correlating error terms, for example, in order to obtain a good fit. When a good measurement model is found, the second step involves running a general SEM as a path analysis. The general SEM model can then be re-specified by adding or deleting indirect effects or adding non-recursive relationships and comparing the fit of the various models to the original SEM model.
Results Sample Description
= 2.2) ranging from 5.3 to 17.5 years. The distribution across grade was 29% in 3rd, 15% in 4th, 14% in 5th, 15% in 6th, 13% in 7th, and 13% in 8th grade. Ten percent of the sample were in out-of-home care at the time of screening and 19% were students with disabilities. The average number of days absent in the school year was 9.4 (S.D. = 9.5) ranging from 0 to 93 days. The average number of days between the screen and test was 222.5 (S.D. = 221.6) and a range of 1 to 1371 days. The average raw score for reading was 443.3 (S.D. = 12.3) with a range of 410 to 482 and for mathematics was 445.5 (S.D. = 9.2), ranging from 424 to 477. Only two variables in this dataset had missing data which included out-of-home care and absences. The analysis of the patterns of missing data concluded the assumption missing completely at random was appropriate for study (see Appendix F).
Table 9. SEM study sample characteristics (N=3,796).
% or Mean (Range), SD
Gender
Male 50%
Female 50%
Race/Ethnicity
White 40%
Black 39%
Latinx 14%
Other 7%
Age 10.9 (5.3-17.5), 2.2
Grade
3 29%
4 15%
5 14%
6 15%
7 13%
8 13%
Out-of-Home Care 10%
Measurement Model
EFA. I performed an exploratory factor analysis with the original 43 items to see if the factor structure of the PB tool suggested by the construct validity study fit well for the Study 2 sample, which was a subset of Study 1’s sample. I added the human capital
measures of reading scores, math scores, and absences to this analysis. The final best EFA model had 5 factors with 27 items and fit statistics were χ2 (226) = 358.595, p. = 0.00;
RMSEA=0.012[90% CI 0.010, 0.015; SRMR=0.057; CFI =0.992) which, with the exception of the exact fit test, were all very good. Table 10 shows the rotated factor loadings for this model. The factor structure was similar to Study 1’s final EFA model with four factors emerging as general trauma (non-sexual) (Factor 1), sexual trauma and related symptoms (Factor 4), externalizing symptoms (Factor 2), and internalizing symptoms (Factor 3) (see Table 5 for comparison).
CFA. The items from the EFA were then used in the CFA also known as the
measurement model for SEM. The initial SEM measurement model tested showed that the reading score and math scores were too highly correlated. Thus, the latent human capital
Table 10. Rotated factor loadings for final Study 2 EFA model.
Item Item Description 1 2 3 4 5
trauma7 Substance abuse 0.850* 0.002 -0.093 -0.037 0.053
trauma10
Parent
incarceration/arrest
0.711* 0.078 -0.033 -0.076 0.002
trauma8 Domestic violence 0.660* 0.058 0.036 -0.025 0.056*
trauma3 Physical needs 0.654* -0.031 0.071 0.112 -0.096*
trauma13 Separations 0.560* 0.061 0.121 0.111 0.029
trauma9 Homelessness 0.530* -0.140* 0.133 0.143 -0.171*
trauma4 Community violence 0.428* 0.239* -0.1 0.002 0
sch2 Authority -0.032 0.961* -0.206 0.139 0.01
emo7 Anger 0.053 0.923* 0.094 -0.176 0.012
beh4 Explosive -0.048 0.914* 0.195 -0.123 -0.013
beh1 Aggression 0.061 0.824* 0.045 -0.05 0.013
beh6 Negative/hostile 0.041 0.793* 0.081 0.109 0.009
sch6 Office/suspensions 0.082 0.776* -0.243 0.149 -0.094*
beh2 Drug/alcohol use -0.045 0.540* 0.007 0.236 0.127*
beh15 Withdrawn 0.002 -0.088 0.869* -0.029 0.028
emo1 Sadness 0.057 -0.004 0.782* 0.086 0.098
emo4 Flat affect/withdrawn -0.104 0.118 0.769* 0.126 -0.057
emo3 Worry 0.256* 0.009 0.605* -0.049 0.051
beh9 Physical complaints 0.268* 0.092 0.503* 0.049 -0.007
beh3 Eating 0.155 0.201 0.472* 0 -0.049
beh5 Forgetfulness 0.206* 0.098 0.376* 0.1 -0.053
emo8 Other 0.036 0.034 0.359* -0.019 -0.071
beh11 Sexual behavior -0.025 0.021 -0.028 0.920* 0.015
beh14 Violent or sexual interests 0.071 0.085 0.081 0.825* -0.031
trauma14 Sexual maltreatment 0.034 -0.03 0.246* 0.619* 0.049
srdsc Reading score -0.021 0.022 -0.009 0.091 0.802*
smasc Math score 0.044* -0.136* 0.037 -0.025 0.689*
Figure 6. Study 2 final CFA/SEM measurement model
50
Structural RegressionModel 1. In the initial structural regression, both general trauma and sexual trauma were defined as exogenous variables that were allowed to co-vary. Externalizing symptoms and internalizing symptoms were endogenous variables with direct effects from general trauma and sexual trauma that were tested. Externalizing symptoms and internalizing symptoms were allowed to co-vary. All of the exogenous and endogenous variables had direct effects on math scores that were tested. Indirect effects were tested on math scores from both general trauma and sexual trauma though both externalizing and internalizing symptoms.
Figure 7 shows the results of the initial structural regression with standardized parameter estimates and only significant paths displayed. The fit estimates were acceptable at χ2 (266) = 518.592, p. = 0.000; RMSEA=0.016[90% CI 0.014,0.018;
SRMR=0.073; CFI =0.985). Consistent with hypotheses, general trauma had direct positive effects on externalizing symptoms (0.497, z = 10.000) and internalizing symptoms (0.486, z = 8.645) at p=0.000 with standardized estimates showing that, for every one standard deviation increase in general trauma, externalizing symptoms increased by 0.422 and internalizing symptoms by 0.474. Sexual trauma also had significant direct positive effects on externalizing symptoms (0.297, z = 5.689) and internalizing symptoms (0.305, z = 4.889) at p=0.000 with standardized estimates showing that, for every one standard deviation increase in sexual trauma, externalizing symptoms increased by 0.277 and internalizing symptoms by 0.328. The model r2 showed that 36% of the variation in
externalizing symptoms and 47% of the variation in internalizing symptoms was explained by levels of general and sexual trauma.
Figure 7. Model 1: Initial structural regression model of effects between trauma, symptoms, and math scores (standardized estimates with only significant paths displayed).
In terms of the human capital measure, consistent with hypotheses, externalizing symptoms had significant negative effects on math scores (-3.169, z = -6.759, p=0.000) with one standard deviation increase in externalizing symptoms decreasing math scores by -0.296. Internalizing symptoms also had a significant direct effect on math scores, but not in the direction hypothesized. Internalizing symptoms had a significant effect on math scores (1.738, z = 2.183, p<0.05) with one standard deviation increase in internalizing symptoms associated with 0.141 increase in math scores. Contrary to hypotheses, direct effects from general trauma (0.502, z = 0.947, p=0.344) and sexual trauma (-0.141, z = -0.222, p=0.824) to math scores were not significant.
However, there were significant indirect effects. While the total indirect effect from general trauma through externalizing and internalizing symptoms was not significant (-0.731, z = -1.785, p = 0.074), the specific indirect paths through the endogenous variables were significant with a negative effect (-1.575, z = -5.670, p=0.000) through externalizing symptoms, which was according to hypotheses, while the indirect path through
internalizing symptoms was significantly positive (0.844, z = 2.244, p<0.05) and not consistent with the hypothesized direction. For sexual trauma, the total indirect path (-0.409, z = -1.330 , p= 0.184) and the specific indirect path through internalizing symptoms (0.531, z = 1.958, p=0.05) were not significant. As predicted, there was a significant negative indirect path through externalizing symptoms (-0.940, z = -4.238, p=0.000).
Overall, r2 estimates showed that only 6% of the variation in math scores was explained by the model.
estimates and significant paths only). The fit statistics were a bit worse with this model at χ2 (286) = 623.584, p. = 0.000; RMSEA=0.018[90% CI 0.016,0.020; SRMR=0.075; CFI
=0.981. As predicted, there were significant positive direct effects from general trauma (0.756, z = 11.865, p=0.000) and sexual trauma (0.176, z = 2.361, p=0.000) on out-of-home care with an increase in one standard deviation of general trauma and sexual trauma associated with an increase of 0.756 and 0.176 in out-of-home care, respectively. The direct effect from internalizing symptoms was significant, but in a negative direct which was contrary to hypotheses (-0.362, z = -2.462, p<0.05) and associated with a standardized decrease of -0.279. The direct effect from externalizing symptoms on out-of-home care was not significant (0.038, z = 0.715, p=0.474). The r2 showed that 51.5% of the variation in out-of-home care was explained by this model.
The pattern of direct effects from variables to the math scores were similar to Model 1. There were not significant direct effects from general trauma (0.262, z = 0.513, p=0.608) and sexual trauma (-0.085, z = -0.212, p=0.832) to math scores. There was still a significant negative direct effect from externalizing symptoms (-1.637, z = -6.001, p=0.000) and a standardized decrease of -0.296. The direct effect from internalizing symptoms was no longer significant (1.170, z = 1.879, p=0.060). Most importantly for this model, there was no significant direct effect from out-of-home care to math scores (0.020, z = 0.052, p=0.959). This model did not improve the amount variance explained for math scores with r2 still at 6%.
symptoms from general trauma (-0.150, z = -2.378, p<0.05) and sexual trauma (-0.100, z = -2.038, p<0.04) though in a negative direction, which contradicted hypotheses.
Figure 8. Structural regression model with foster care case type (standardized estimates, significant paths only).
x2 (286)= 623.584, p.=0.000; RMSEA 0.018(0.016,0.020); SRMR = 0.075; CFI = 0.981
Final model. In the final model, several control variables were added to the model based on at least one significant correlation with human capital measures at p<0.05. These correlations are included in Appendix H. While days absent was not retained in the models
Figure 9. Final structural regression model with covariates (structural part only, standardized estimates, significant paths only)