TE
A
C
H
E
R P
A
G
E
S
i
Copyright © 2013 National Math + Science Initiative, Dallas, Texas. All rights reserved. Visit us online at www.nms.org.
Chemistry
MATERIALS AND RESOURCES
EACH GROUP calculator, graphing graduated cylinders,
10 mL
graduated cylinders, 50 mL
paper towels
pipette, serological, 10 mL
pipette, serological, 5 mL
Discovering
Equilibrium
Observing a Dynamic
Demonstration
ABOUT THIS LESSON
T
his lesson is designed to introduce students to the concept of equilibrium and lay the foundation for the law of mass action. Though written as a student-performed demonstration,the activity can be easily adapted as a full lab investigation if time and equipment allow.
OBJECTIVE
Students will:
• Discover and develop the concept of equilibrium using simple laboratory equipment
• Use mathematical reasoning to evaluate and predict equilibrium conditions for the physical system
LEVEL
TE
A
C
H
E
R P
A
G
E
S
i i
Copyright © 2013 National Math + Science Initiative, Dallas, Texas. All rights reserved. Visit us online at www.nms.org.
NEXT GENERATION SCIENCE STANDARDS
PLANNING/CARRYING OUT INVESTIGATIONS
ANALYZING AND INTERPRETING DATA
STABILITY
AND CHANGE SCALE, PROPORTION, AND QUANTITY
PS2: FORCES AND INTERACTION
ASSESSMENTS
The following types of formative assessment are embedded in this lesson:
• Discussion of prior knowledge of equilibrium ideas
• Visual and verbal responses regarding student predictions
• Visual observations of student analysis of data
The following additional assessments are located on our website:
• Chemistry Assessment: Equilibrium
REFERENCES
Luoman, John and Yochum, Susan. Journal of College
TE A C H E R P A G E S
i i i
Copyright © 2013 National Math + Science Initiative, Dallas, Texas. All rights reserved. Visit us online at www.nms.org.
Chemistry – Discovering Equilibrium
COMMON CORE STATE STANDARDS
(LITERACY) RST.9 -10.4
Determine the meaning of symbols, key terms, and other domain-specific words and phrases as they are used in a specific scientific or technical context relevant to grades 9–10 texts and topics.
(LITERACY) RST.9 -10.7
Translate quantitative or technical information expressed in words in a text into visual form (e.g., a table or chart) and translate information expressed visually or mathematically (e.g., in an equation) into words.
(LITERACY) WHST.9 -10.1
Write arguments focused on discipline specific content.
(MATH) HSA- CED. A . 2
Create equations in two or more variables to represent relationships between quantities; graph equations on coordinate axes with labels and scales.
CONNECTIONS TO AP
6
CHEMISTRYCHEMISTRY
AP
AP
A .1 In many classes of reactions, it is
important to consider both the forward and reverse reaction.
A . 2 The current state of a system undergoing
a reversible reaction can be characterized by the extent to which reactants have been converted to products. The relative quantities of reaction components are quantitatively described by the reaction quotient, Q
A .3 When a system is at equilibrium,
all macroscopic variables, such as concentrations, partial pressures, and temperature, do not change over time. Equilibrium results from an equality between the rates of the forward and reverse reactions, at which point Q = K.
A .4 The magnitude of the equilibrium
constant, K, can be used to determine
TE A C H E R P A G E S i v
Copyright © 2013 National Math + Science Initiative, Dallas, Texas. All rights reserved. Visit us online at www.nms.org.
TEACHING SUGGESTIONS
T
his demonstration is designed to introduce a unit on equilibrium. It could be used before the equilibrium animations athttp://introchem.chem.okstate.edu/DCICLA/ERGBM.htm.
Set up two stations for this demonstration, separate from each other but visible to all students in the class. Each group will label two graduated cylinders as “A” and “B,” with A to the left of B from the perspective of the audience. Assign three people to each of the 50.0 mL graduated cylinders:
• One for transferring the liquid • One for reading the volume
• One for recording the volume on the board
Have the students place the 10.0 mL pipette next to Cylinder A and the 5.0 mL pipette next to Cylinder B. Instruct the groups to fill their graduated cylinders with water according to the following:
• Group I: Fill graduated Cylinder A with 50.0 mL of water
• Group II: Fill graduated Cylinder B with 50.0 mL of water
Explain to the students that they will be transferring amounts of water between the two cylinders using the pipettes until the volume readings normalize, or stay constant.
On the board or projection screen, have students help you design the data table to record volume
measurements for Cylinder A and Cylinder B. You will need to duplicate the data table so that each group has a copy. Ask the recorder for each cylinder to record the initial volume of A and B before any transfer has occurred in each group.
At a mock station set up for you, demonstrate the proper technique for transferring the water. Emphasize that the transfer between graduated cylinders should take place simultaneously.
If you are modeling this by yourself, hold the 10.0 mL pipette in your left hand and the 5.0 mL pipette in your right hand. Lower them into their respective cylinders, allow the water to reach its maximum height in each pipette, and place your index fingers over the ends of the pipettes to create a seal. Keeping the seal with your finger, lift the pipettes out of the water and cross your arms over each other. With the tip of the 5.0 mL pipette over Cylinder A and the tip of the 10.0 mL pipette over Cylinder B, lift your index fingers to allow the water from the pipettes to dispense into the cylinders. Uncross your arms and put the pipettes down next to their respective cylinders.
Allow students performing the demonstration to do this task at their station. After a successful transfer, they should be able to record new volume data in their tables. At this point when students have a better grasp on how the demonstration will work, ask students to come up with a prediction for the outcome of each scenario. What do they predict the volumes to be for each cylinder at the point when they no longer change? Students should record their predictions in the space provided on the student answer page.
TE A C H E R P A G E S v
Copyright © 2013 National Math + Science Initiative, Dallas, Texas. All rights reserved. Visit us online at www.nms.org.
Chemistry – Discovering Equilibrium
TEACHING SUGGESTIONS (CONTINUED)
Depending on the dynamic of the class, framing this as a competition between the two demonstration groups to see who can arrive at equilibrium the quickest can create a level of excitement for students. Students not actively performing the demonstration should be recording the data from the board on their student pages.
It is important to be explicit that the forward and reverse processes are occurring at the same time in each trial. In this investigation, A is to the left of B to reflect the designation of reactants and products in the original equation. You can demonstrate the reverse reaction by putting B to the left of A, but keeping the pipettes with their respective graduated cylinders.
Students would see that there is no difference in the ratio of A to B present at equilibrium (or amounts if total volume is unchanged), regardless of what side of the “equation” they are on. The equilibrium constant for B A is the inverse of the one for A B only because it is strictly defined as the ratio of products (on the right) to reactants (on the left). In essence, because both forward and reverse reactions happen simultaneously designating “reactants” and “products” for equilibrium systems is often arbitrary. Scientists choose the direction that suits their investigation or explanation when working with reversible chemical reactions and physical processes.
For the Analysis section you can divide the class, instructing half to graph the data from Group I and the other half to graph the data from Group II. You can do this by numbering students off with alternating numbers or by basing it on seating location in the room. Students can collaborate to share their graphs with each other, creating a context for students to engage verbally in comparisons between the two representations.
Ask students to answer the Analysis and Conclusion Questions on their student answer page. Students
may find it necessary to review the introduction on the concept of equilibrium to answer some of the questions. Where possible, redirect students to that section to promote habits of looking for textual evidence as a routine part of problem-solving when more information may be needed.
ALTERNATIVE TEACHING PROCEDURE
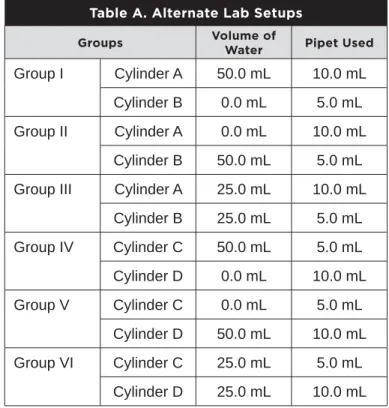
If you have enough equipment to support a full lab investigation, then you can assign different volumes for A and B to student groups and even change the assignment of the 5 mL and 10 mL pipettes. Examples include but are not limited to those shown in Table A.
Students would create and display their data, graphs, and values for equilibrium constants. Discussions could emerge from purposeful comparisons and explanations of results. The labeling of the graduated cylinders switches from (A,B) to (C,D) to avoid misconceptions about reverse reactions. The reaction of C D does not represent the reverse reaction of A B but instead a completely different reaction that favors the reactant, as written.
Table A. Alternate Lab Setups
Groups Volume of
Water Pipet Used
Group I Cylinder A 50.0 mL 10.0 mL
Cylinder B 0.0 mL 5.0 mL
Group II Cylinder A 0.0 mL 10.0 mL
Cylinder B 50.0 mL 5.0 mL
Group III Cylinder A 25.0 mL 10.0 mL
Cylinder B 25.0 mL 5.0 mL
Group IV Cylinder C 50.0 mL 5.0 mL
Cylinder D 0.0 mL 10.0 mL
Group V Cylinder C 0.0 mL 5.0 mL
Cylinder D 50.0 mL 10.0 mL
Group VI Cylinder C 25.0 mL 5.0 mL
v i AN S W E R K E Y
Copyright © 2013 National Math + Science Initiative, Dallas, Texas. All rights reserved. Visit us online at www.nms.org.
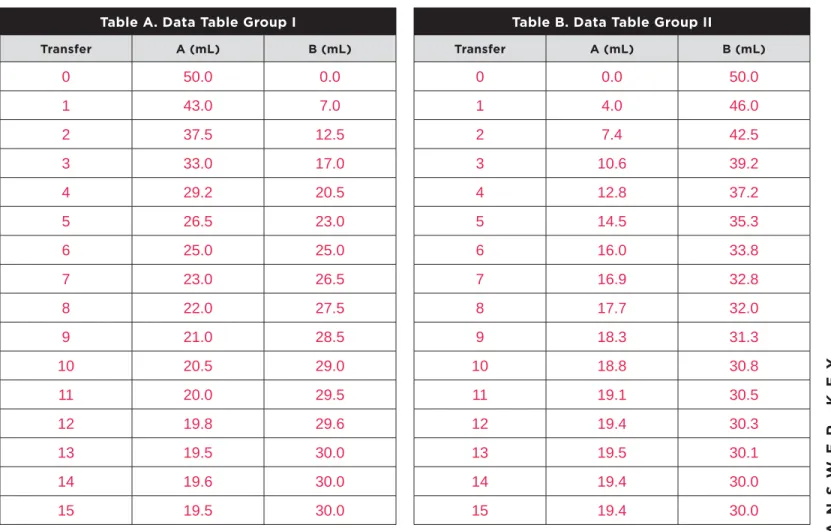
DATA AND OBSERVATIONS
GROUP I
Table A. Data Table Group I
Transfer A (mL) B (mL)
0 50.0 0.0
1 43.0 7.0
2 37.5 12.5
3 33.0 17.0
4 29.2 20.5
5 26.5 23.0
6 25.0 25.0
7 23.0 26.5
8 22.0 27.5
9 21.0 28.5
10 20.5 29.0
11 20.0 29.5
12 19.8 29.6
13 19.5 30.0
14 19.6 30.0
15 19.5 30.0
Transfer to the 10.0-mL graduated cylinder:
• From A with 10.0-mL pipette = 2.3 mL • From B with 5.0-mL pipette = 2.2 mL
GROUP II
Table B. Data Table Group II
Transfer A (mL) B (mL)
0 0.0 50.0
1 4.0 46.0
2 7.4 42.5
3 10.6 39.2
4 12.8 37.2
5 14.5 35.3
6 16.0 33.8
7 16.9 32.8
8 17.7 32.0
9 18.3 31.3
10 18.8 30.8
11 19.1 30.5
12 19.4 30.3
13 19.5 30.1
14 19.4 30.0
15 19.4 30.0
Transfer to the 10.0-mL graduated cylinder:
v i i
AN
S
W
E
R
K
E
Y
Copyright © 2013 National Math + Science Initiative, Dallas, Texas. All rights reserved. Visit us online at www.nms.org.
Chemistry – Discovering Equilibrium Chemistry – Discovering Equilibrium
ANALYSIS
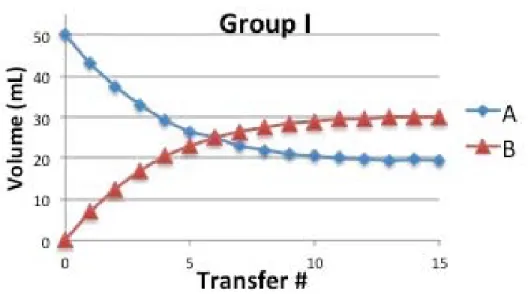
1. Graph the data for Group I and Group II. Sketch and label each of the graphs in the space provided.
Figure A. Data for Group I
v i i i AN S W E R K E Y
Copyright © 2013 National Math + Science Initiative, Dallas, Texas. All rights reserved. Visit us online at www.nms.org.
ANALYSIS (CONTINUED)
2. Compare and contrast the two graphs from Question 1.
The Group I graph shows the two lines crossing, whereas the curves in the Group II graph never intersect. In both graphs, the curves have a greater initial rate of change that slows until the volumes plateau with the volume of B greater than the volume of A.
3. Describe how the graphs provide visual
information when equilibrium is established by the system.
When equilibrium is established, the volumes in the cylinders remain constant. This is easily seen as the plateaus in the graphs. Before the plateau, the system is not in equilibrium.
4. Was your thinking correct or incorrect in your original prediction? Explain
Answers will vary depending on students’ original predictions.
5. Using the data for Group I, calculate the experimental equilibrium constant. Show all of your work in the space provided.
AB 30.019.5 1.54 K 6. Using the data for Group II, calculate the experimental equilibrium constant. Show all of the work in the space provided.
AB 30.019.4 1.55 K 7. What is the relationship between the calculated K
values for Group I and Group II? Explain.
The calculated K values are the same for Group I
and Group II. K is calculated by taking the ratio
of products to reactants. The final volumes for Cylinder A and Cylinder B are essentially the same in both experiments, so the equilibrium constant is the same ratio.
8. Suppose you started with two 100.0-mL
graduated cylinders for A and B but kept all other conditions the same. Considering a total volume of 100.0 mL for the system, predict the final volumes for each cylinder. Support your answer with evidence and reasoning.
The final volume in A will be 39.4 mL and the final volume in B will be 60.6 mL. The equilibrium constant will still be 1.54, which is the ratio of B to A.
The calculation is shown here:
x = volume in A
y = volume in B
x + y = 100
y = 100 −x
1.54x = 100 −x
2.54x = 100
x = 39.4 mL
y = 60.6 mL
ABy K
x
100
1.54 x
i x AN S W E R K E Y
Copyright © 2013 National Math + Science Initiative, Dallas, Texas. All rights reserved. Visit us online at www.nms.org.
Chemistry – Discovering Equilibrium Chemistry – Discovering Equilibrium
CONCLUSION QUESTIONS
1. What would you expect to happen to the volume in A and B if the transfers continued after
equilibrium was established? Explain. The volumes would remain the same. After equilibrium is established, the volumes should be constant. The volume transferred by the pipettes is equal, and there will be no net gain or loss in each transfer.
2. According to the equilibrium constants calculated, would you classify this process as “reactant-favored” or “product-favored?” State your reasoning.
At equilibrium there is more product, B, than reactant, A. The equilibrium constant is the ratio of products to reactants. The calculated value is greater than 1, so it is clear that the reaction is product-favored.
3. How would the equilibrium constant be different if the process was exactly the same but the reaction was written as the reverse as shown in Equation 3? Support your claim with evidence and state the relationship to the original equilibrium constant.
The equilibrium constant for the reverse equation would be the reciprocal, or inverse, of the
original equilibrium constant.
The constant for the reverse reaction would be the ratio of A to B instead of B to A. Because the values of A and B at equilibrium remain the same regardless of how the reaction is written, the ratio just flips the numerator and denominator.
4. Compare the volume of water transferred to the 10.0-mL graduated cylinders from A and B in both groups.
a. Equilibrium is established when the rate of the forward reaction is equal to the rate of the reverse reaction. Explain how these volume measurements demonstrate this principle. The volumes collected from the transfer pipettes demonstrate how the rate of the forward and reverse process is the same. The volume held in the 10-mL pipette indicates the amount of reactants becoming products because it is the transfer from A to B. The volume held in the 5-mL pipette indicates the amount of products becoming reactants because it is the transfer from B to A. When the transfer volumes are equal, the net volumes in the cylinders do not change and the overall system is at equilibrium.
b. Despite the narrowing at the tip, the pipettes used in this investigation are essentially
cylindrical. Considering your answer to part (a) and the equation for the volume of a cylinder, justify the height differential of water in A and B at equilibrium.
At equilibrium, the height of the liquid in Cylinder B is greater than the height in Cylinder A. The 10-mL pipette is used to transfer water from A to B, and it has a greater radius. The 5-mL pipette is used to transfer water from B to A, and it has a smaller radius. The volume transferred by each pipette is directly proportional to the height of the water in the graduated cylinders.
For the 5-mL pipette to hold the same water volume as the 10-mL pipette, the height, h, of
x
AN
S
W
E
R
K
E
Y
Copyright © 2013 National Math + Science Initiative, Dallas, Texas. All rights reserved. Visit us online at www.nms.org.
CONCLUSION QUESTIONS (CONTINUED)
Equilibrium constants allow us to assess whether a system is at equilibrium. For the following questions, consider a new system of two 100.0 mL graduated cylinders, C and D, with
C D
The two cylindrical pipettes used for the transfers have the same length but can hold different volumes. The equilibrium constant for this system is K = 0.47.
5. To which graduated cylinder does the pipette with the greater diameter belong, C or D,? Justify your answer.
The pipette with the greater diameter belongs with graduated Cylinder D. The equilibrium constant is less than 1, therefore the reaction is reactant-favored.
The pipette with the greater diameter must be used to transfer volume from D to C. The equilibrium volume, and thereby height, in D will be less than in C. For transfer volumes to be equal, the pipette assigned to D must have a larger cross-sectional area (πr2), or larger radius.
6. For the following scenarios, state whether the system is at equilibrium. If not, indicate the graduated cylinder that needs more water and explain your reasoning.
a. 50 mL in C; 50 mL in D
The system is not at equilibrium. More water needs to transfer to C. The ratio of products to reactants in the scenario is 1, which is greater than 0.47. To bring the ratio down, a greater reactant volume is required.
b. 32 mL in C; 68 mL in D
The system is not at equilibrium. More water needs to transfer to C. The ratio of products to reactants in the scenario is 2.1, which is greater than 0.47. To bring the ratio down, a greater reactant volume is required.
c. 68 mL in C; 32 mL in D
1
Copyright © 2013 National Math + Science Initiative, Dallas, Texas. All rights reserved. Visit us online at www.nms.org.
Chemistry – Discovering EquilibriumChemistry
MATERIALS
calculator, graphing graduated cylinders,10 mL graduated cylinders, 50 mL paper towels
pipette, serological, 10 mL pipette, serological, 5 mL
Discovering Equilibrium
Observing a Dynamic Demonstration
W
hat is the first thing that comes to mind when you hear the wordequilibrium? In this experiment, we will study the equilibrium that
exists in the reaction shown in Equation 1:
A B (Eq. 1)
The equilibrium constant for this reaction is represented in the manner shown in
Equation 2:
[products] [B] [reactants] [A]
K= = (Eq. 2)
In this experiment, the volume in the graduated cylinder labeled “A” will represent the concentration of the reactants, and the volume in the graduated cylinder labeled “B” will represent the concentration of the products.
PURPOSE
2
Copyright © 2013 National Math + Science Initiative, Dallas, Texas. All rights reserved. Visit us online at www.nms.org.
PROCEDURE
3
Copyright © 2013 National Math + Science Initiative, Dallas, Texas. All rights reserved. Visit us online at www.nms.org.
Chemistry – Discovering Equilibrium
DATA AND OBSERVATIONS
GROUP I
4
Copyright © 2013 National Math + Science Initiative, Dallas, Texas. All rights reserved. Visit us online at www.nms.org.
ANALYSIS
5
Copyright © 2013 National Math + Science Initiative, Dallas, Texas. All rights reserved. Visit us online at www.nms.org.
Chemistry – Discovering Equilibrium
ANALYSIS (CONTINUED)
2. Compare and contrast the two graphs from Question 1.
3. Describe how the graphs provide visual information when equilibrium is established by the system.
4. Was your thinking correct or incorrect in your original prediction? Explain
6
Copyright © 2013 National Math + Science Initiative, Dallas, Texas. All rights reserved. Visit us online at www.nms.org.
ANALYSIS (CONTINUED)
6. Using the data for Group II, calculate the experimental equilibrium constant. Show all of the work in the space provided.
7. What is the relationship between the calculated K values for Group I and
Group II? Explain.
8. Suppose you started with two 100.0-mL graduated cylinders for A and B but kept all other conditions the same. Considering a total volume of
7
Copyright © 2013 National Math + Science Initiative, Dallas, Texas. All rights reserved. Visit us online at www.nms.org.
Chemistry – Discovering Equilibrium
CONCLUSION QUESTIONS
1. What would you expect to happen to the volume in A and B if the transfers continued after equilibrium was established? Explain.
2. According to the equilibrium constants calculated, would you classify this process as “reactant-favored” or “product-favored?” State your reasoning.
3. How would the equilibrium constant be different if the process was exactly the same but the reaction was written as the reverse as shown in Equation 3? Support your claim with evidence and state the relationship to the original equilibrium constant.
8
Copyright © 2013 National Math + Science Initiative, Dallas, Texas. All rights reserved. Visit us online at www.nms.org.
CONCLUSION QUESTIONS (CONTINUED)
4. Compare the volume of water transferred to the 10.0-mL graduated cylinders from A and B in both groups.
a. Equilibrium is established when the rate of the forward reaction is equal to the rate of the reverse reaction. Explain how these volume measurements demonstrate this principle.
b. Despite the narrowing at the tip, the pipettes used in this investigation are essentially cylindrical. Considering your answer to part (a) and the equation for the volume of a cylinder,
V = h(πr2)
9
Copyright © 2013 National Math + Science Initiative, Dallas, Texas. All rights reserved. Visit us online at www.nms.org.
Chemistry – Discovering Equilibrium
CONCLUSION QUESTIONS (CONTINUED)
Equilibrium constants allow us to assess whether a system is at equilibrium. For the following questions, consider a new system of two 100.0-mL graduated cylinders, C and D, with
C D
The two cylindrical pipettes used for the transfers have the same length but can hold different volumes. The equilibrium constant for this system is K = 0.47.
5. To which graduated cylinder does the pipette with the greater diameter belong, C or D? Justify your answer.
6. For the following scenarios, state whether the system is at equilibrium. If not, indicate the graduated cylinder that needs more water and explain your reasoning.
a. 50 mL in C; 50 mL in D
b. 32 mL in C; 68 mL in D
1 0
Copyright © 2013 National Math + Science Initiative, Dallas, Texas. All rights reserved. Visit us online at www.nms.org.
GOING FURTHER
Consider the reaction
A B
Obtain two 100.0 mL graduated cylinders and label them “A” and “B.” Fill each one with 40.0 mL of water. Assign a different size of pipette to each cylinder and document your decision. Transfer water between them using the protocol established in the previous investigation until equilibrium is established. Be sure to record the initial equilibrium condition and calculate the equilibrium constant for your reaction.
Add 15.0 mL of water to one of the graduated cylinders, documenting which one. Predict how equilibrium will be reestablished with continued transfers. Test your prediction by transferring water until equilibrium is reached again. Be sure to record the new equilibrium conditions and calculate the equilibrium constant.
At this point, choose a graduated cylinder and pour out 20.0 mL of water, documenting which one. Predict how equilibrium will be reestablished with continued transfers. Test your prediction by transferring water until equilibrium is reached again. Be sure to record the new equilibrium conditions and calculate the equilibrium constant.