C
2010. The American Astronomical Society. All rights reserved. Printed in the U.S.A.
AN EXTREMELY TOP-HEAVY INITIAL MASS FUNCTION IN THE GALACTIC CENTER STELLAR DISKS
∗H. Bartko1, F. Martins1,2, S. Trippe3, T. K. Fritz1, R. Genzel1,4, T. Ott1, F. Eisenhauer1, S. Gillessen1, T. Paumard5, T. Alexander6, K. Dodds-Eden1, O. Gerhard1, Y. Levin7, L. Mascetti1, S. Nayakshin8, H. B. Perets6, G. Perrin5,
O. Pfuhl1, M. J. Reid9, D. Rouan5, M. Zilka10, and A. Sternberg10
1Max-Planck-Institute for Extraterrestrial Physics, Garching, Germany;[email protected],
2GRAAL-CNRS, Universit´e Montpelier II-UMR5024, Place Eug`ene Bataillon, F-34095, Montpellier, France 3IRAM Grenoble, 300 rue de la piscine, F-38406 Saint Martin d’Heres, France
4Department of Physics, University of California, Berkeley, USA
5LESIA, Observatoire de Paris, CNRS, UPMC, Universit´e Paris Direrot, Meudon, France 6Faculty of Physics, Weizmann Institute of Science, Rehovot 76100, Israel
7Leiden University, Leiden Observatory and Lorentz Institute, NL-2300 RA Leiden, The Netherlands 8Department of Physics & Astronomy, University of Leicester, Leicester, UK
9Harvard-Smithsonian Center for Astrophysics, 60 Garden Street, Cambridge, USA 10School of Physics and Astronomy, Tel Aviv University, Tel Aviv 69978, Israel
Received 2009 August 15; accepted 2009 November 13; published 2009 December 15
ABSTRACT
We present new observations of the nuclear star cluster in the central parsec of the Galaxy with the adaptive optics
assisted, integral field spectrograph SINFONI on the ESO/VLT. Our work allows the spectroscopic detection of
early- and late-type stars tomK 16, more than 2 mag deeper than our previous data sets. Our observations result
in a total sample of 177 bona fide early-type stars. We find that most of these Wolf Rayet (WR), O-, and B-stars
reside in two strongly warped disks between 0.8 and 12from Sgr A*, as well as a central compact concentration
(the S-star cluster) centered on Sgr A*. The later type B-stars (mK >15) in the radial interval between 0.8 and 12
seem to be in a more isotropic distribution outside the disks. The observed dearth of late-type stars in the central few arcseconds is puzzling, even when allowing for stellar collisions. The stellar mass function of the disk stars is extremely top heavy with a best-fit power law ofdN/dm ∝ m−0.45±0.3. WR/O-stars were formed in situ in a
single star formation event∼6 Myr ago, this mass function probably reflects the initial mass function (IMF). The
mass functions of the S-stars inside 0.8 and of the early-type stars at distances beyond 12are compatible with a standard Salpeter/Kroupa IMF (best-fit power law ofdN/dm∝m−2.15±0.3).
Key words: Galaxy: center – stars: early-type – stars: luminosity function, mass function
Online-only material:color figures
1. INTRODUCTION
The central parsec of the Galaxy harbors more than 100
young massive stars (Forrest et al. 1987; Allen et al. 1990;
Krabbe et al. 1995, 1991; Najarro et al. 1997, 1994; Blum
et al. 1995; Tamblyn et al. 1996; Genzel et al. 2003; Ghez
et al.2003; Paumard et al.2006; Martins et al.2007). This is highly surprising since the tidal forces from the central four million solar mass black hole should make formation of stars by gravitational collapse from a cold interstellar cloud very
difficult if not impossible (Morris 1993). Observations have
established that most of the Wolf Rayet (WR) stars and O-stars (dwarfs, giants, and supergiants) dominating the luminosity of the early-type population were formed in a well-defined single
event∼6 Myr ago, perhaps as a result of the infall of a gas
cloud followed by an in situ star formation event (Krabbe et al.
1995; Paumard et al.2006). About half of these WR/O-stars
between 0.8 and 12 from Sgr A* appear to reside in a well
defined but highly warped disk that rotates clockwise on the sky (Levin & Beloborodov2003; Genzel et al.2003; Paumard et al.
2006; Lu et al.2009; Bartko et al.2009). It is less clear how the other half is distributed. Paumard et al. (2006) and Bartko et al. (2009) find evidence for a counterclockwise structure, perhaps
a second disk in a dissolving state. Lu et al. (2009) confirm
∗ Based on observations collected at the ESO Very Large Telescope (programs 075.B-0547, 076.B-0259, and 077.B-0503).
the first stellar disk but do not observe a significant number
of stars in the second disk. Within about 1 of Sgr A* there
is a sharp cutoff in the density of WR/O-stars. Instead there
is a concentration of fainter stars with randomly oriented and eccentric orbits: the so-called S-star cluster’ (Eisenhauer et al.
2005; Gillessen et al.2009). The brighter members of this central cusp are spectroscopically identified as main-sequence B-stars (Ghez et al.2003; Eisenhauer et al.2005; Martins et al.2008; Gillessen et al.2009). It is currently debated whether the S-stars formed in the disk(s) and subsequently migrated to the central arcsecond (Levin2007; L¨ockmann et al.2008), or whether they formed outside the central few parsecs, were injected into near-parabolic orbits by massive perturbers and were then captured by the massive black hole (e.g. Hills1988; Perets et al.2007).
If star formation indeed has taken place in the vicinity of the massive black hole, it is of great interest to explore the stellar mass function and spatial distribution to gain a better understanding of the processes involved in overcoming the tidal barrier. Likewise it is important to observationally constrain the characteristics and origin of the central S-star cluster. In the following, we present the results of an extensive imaging spectroscopy survey of the central parsec with the adaptive optics (AO) assisted integral field spectrograph SINFONI on
the ESO/VLT. We report new observations aimed at defining
the spatial distribution and dynamics of the nuclear stars up to
mK 16 throughout this region and combine this new work
with our earlier results on the WR/O-stars and the central S-star cluster.
x [arcsec]
20 -5
15 10 -5 0 5 10 15 20
11 mag 12 mag 13 mag 14 mag 15 mag 16 mag
-15 0 0.1 0.2 0.3 0.4 0.5 0.6 0.7 0.8 0.9 1
y [arcsec]
15 10 5 0 -10
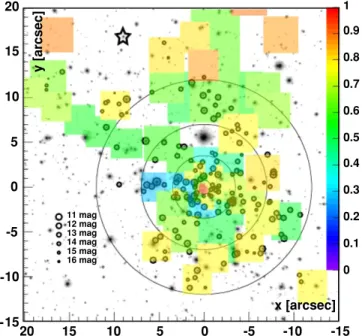
-Figure 1.Black circles indicate the sample of early-type stars with 0.8
R25. The size of the circle scales with theK-band magnitude. The large black circles show projected distances of 0.8, 3.5, 7, and 12from Sgr A*. The colored squares indicate the exposed fields with SINFONI in the 25 mas pixel−1 and 100 mas pixel−1scale. The color scale indicates the combined photometric
and spectroscopic completeness for anmK = 14 main-sequence early-type star in the observed field. The whole inner∼12region is contained in lower resolution (250 mas pixel−1scale) SINFONI observations (Paumard et al.2006).
The asterisk indicates the visible AO guide star.
(A color version of this figure is available in the online journal.)
2. OBSERVATIONS AND DATA REDUCTION
Observations of the imaging survey were carried out from
2005 to 2009 with SINFONI (Eisenhauer et al. 2003) on
the ESO/VLT, partly using natural guide star AO and partly
exploiting the laser guide star facility (Rabien et al. 2003;
Bonaccini Calia et al.2006). We covered a total surface area
of 15 square arcsec at projected distances below 4from Sgr A*
with the AO scale (12.5×25 mas pixel−1scale) resulting in a
finalK-band full width at half maximum (FWHM) of typically
about 100 mas. In addition, we observed a total surface area
of more than 500 square arcsec with the 50×100 mas pixel−1
scale resulting in typicalK-band FWHMs of about 200 mas.
The location of the observed fields (typical integration time per
field 2 hr) is indicated in Figure1. We reduced the data with
the software SPRED as in Eisenhauer et al. (2005) and Paumard
et al. (2006). Our primary goal in this project is to determine the spatial distribution and dynamics of the early-type stars as a function of theirK-band magnitude/mass. For this purpose, we need to distinguish from the spectroscopic data early-type stars from late-type stars and to isolate the central star cluster from fore- and background stars.
Late-type stars in the observed magnitude range are giants later than K0III and cool red supergiants. These stars show characteristic CO band head absorption features, which can efficiently be used to remove these stars from our sample. Only three red supergiants have been observed in the central pc of the
Galaxy (Blum et al.2003; Paumard et al.2006), most notably
IRS 7 at an angular distance of 5.5 from Sgr A*. In contrast to the giants later than K0III, the red supergiants are young and massive stars with ages between 7 and a few tens of megayears (Blum et al.1996a).
We classified stars as “CO” (late-type) or “non CO” (early-type) depending on the presence or the absence of the CO
2.29μmv = 0–2 band heads (see also Maness et al. 2007).
By adding artificial late-type stars to our data, we determined the average efficiency of the CO detection to be better than 98%
atmK =16.5. In order to rate a “non-CO” as bona fide
early-type star, we require the detection of at least one of the BrγHei
2.058 μm or Hei 2.112 μm lines at a signal to noise level,
which allows a radial velocity measurement with a maximum uncertainty of 100 km s−1. The sample of bona fide early-type stars is essentially free from late-type star interlopers.
Fore- and background early-type stars do not add any sig-nificant contamination to the observed population of early-type stars in the central parsec around Sgr A*. Due to the large
ex-tinction toward the Galactic Center of AK = 2.8 (see, e.g.,
Sch¨odel et al.2007), foreground sources can efficiently be
re-jected by their very blueH−Kband colors. There are only two
bright infrared detectable foreground stars (Biretta et al.1982). Background sources are subject to an even higher extinction
and very red H−Kband colors. The cusp of early-type stars
around Sgr A* is very steep (see Figure2):Σ(R)∝ R−1.4±0.2. For a cluster in equilibrium the distribution of the line-of-sight distances to Sgr A* is related to the star surface number
den-sity distribution (Alexander 2005). Out of the 136 early-type
stars in the interval of projected distances 0.8 R 12
only 8/3 stars may have line-of-sight distances larger than
1/2 pc.
We corrected the observedK-band magnitudemK,obs(for the
absolute magnitude scale calibration see Blum et al. 1996b;
Maness et al.2007) of the stars for the variation of extinction over the Galactic center region. We calculated the extinction for each position in the Galactic center field,AK,obs, by using
the observedH-band andK-band magnitudes of the 20 nearest
neighboring stars, assuming realistic intrinsic colors for the stars and assuming the extinction law from Rieke & Rieke (1989),A(λ) ∝ λ−1.75. All magnitudesm
K mentioned below
are referred back to a common standard extinction of 2.8:
mK =mK,obs+ 2.8−AK,obs.
Our total data set contains 177 bona fide early-type stars
at projected distances up to 25from Sgr A*. Figure1 shows
the location of the bona fide early-type stars with R > 0.8. Of the 177 bona fide early-type stars in our survey, 118 are
WR/O-stars and 59 are B-dwarfs (mK 14.); 28 WR/O-stars
and 34 B-dwarfs are reported here for the first time.
3. NUMBER COUNTS AND COMPLETENESS CORRECTIONS
To study the radial surface density and K-band luminosity
function (KLF) of the early-type stars, we correct the number of observed stars for both photometric and spectroscopic in-completeness, as well as (for radial surface density plots) for incomplete areal coverage.
The photometric completenessphotis defined as the
prob-ability of detecting a star with a given magnitude in the im-age generated by integrating over the spectral information of the SINFONI data. For this purpose, we added artificial stars to the spectrally integrated SINFONI images, and determined the probability of re-detecting the artificial stars with an
auto-matic star detection algorithm (Stetson1987). We used a dense
sampling of the image area with a satisfying number of trials (about 2000 trials per image and per flux bin, the exact num-ber depending on respective image dimensions) and tested the
The spectroscopic completeness spec is the probability of identifying the spectral type of a given, photometrically detected star in a data cube. For this purpose, we added and recovered three-dimensional stellar cubes in analogy with the photometric completeness estimates. These three-dimensional cubes are formed from a spatial point-spread function (PSF) with an early-type star spectrum along the wavelength axis. For each photometrically re-detected star we extracted its spectrum from
the data cube and computed a CO index (Maness et al.2007),
which quantifies the relative depth of the CO band head absorption feature. We required a minimum total signal-to-noise ratio of the spectrum in the region of the CO band head of at least 5σ. If the relative depth of the CO band head feature of the artificial early-type star spectrum was smaller than twice the noise, the star was counted as a “spectroscopically re-identified early-type star.”
We assign errors to both photometric and spectroscopic com-pleteness values. We confirmed that the comcom-pleteness values do not change beyond these errors by different settings of the star detection algorithm and the CO index calculation. We computed the combined photometric and spectroscopic completeness as a function of magnitude and location throughout the observed region, propagating the individual errors, to the combined
com-pletenesscomb(x, y, mK). We calculated completeness maps,
which give (as a function of magnitude) the completeness and its error for each observed point. As an example, Figure1shows
the combined completeness distribution for anmK =14
main-sequence early-type star. In our survey an average 50%
com-pleteness is achieved for anmK = 15 star. The spectroscopy
is deeper toward the central S-star cluster and several fields without bright stars (Figure1).
We derived an effective exposed area Aeff(R1, R2, mK)
(including error) over an annulus between R1 andR2 around
Sgr A* as a function ofmK taking the SINFONI exposure
lo-cations and the completeness values including their errors into account:
Aeff(R1, R2, mK)=
√x2+y2R2
√
x2+y2R 1
comb(x, y, mK)dxdy . (1)
Finally, we computed from the number of observed stars
Nstars,obs.(R1, R2, mK) in an annulus betweenR1andR2around Sgr A* theK-band luminosity function KLF(R1, R2, mK) and the surface densityΣ(R1, R2):
KLF(R1, R2, mK)=
Nstars,obs.(R1, R2, mK)
Aeff(R1, R2, mK)
Σ(R1, R2)=
mK
Nstars,obs.(R1, R2, mK)
Aeff(R1, R2, mK)
.
4. RESULTS
4.1. Surface Density Profiles
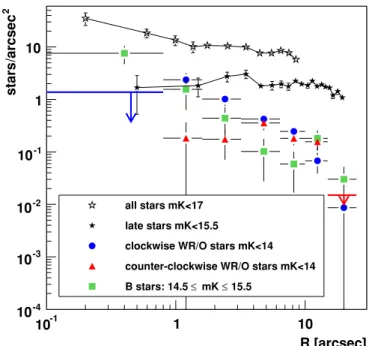
Figure2shows the projected-, completeness-, and
coverage-corrected surface density profiles for all stars withmK <17, late-type stars withmK <15.5, the WR/O-stars (mK <14),
and B-dwarfs in the magnitude interval 14.5 mK 15.5.
The radial surface density of the clockwise WR/O-stars follows a power lawΣ(R)∝R−1.4±0.2between 0.8 and 15.
Extrapolat-ing this power law to smaller projected distances yields 28±8
clockwise WR/O-stars for R < 0.8. At the 95% confidence
level we expect more than 12 stars within 0.8. We did not
ob-serve any WR/O-star in this region. The Poisson probability
R [arcsec] -1
10 1 10
2
stars
/arcsec
-4 10
-3 10
-2 10
-1 10
1 10
all stars mK<17
late stars mK<15.5
clockwise WR/O stars mK<14
counter-clockwise WR/O stars mK<14
15.5 ≤ mK ≤ B stars: 14.5
Figure 2.Projected-, completeness-, and coverage-corrected surface density as a function of distance to Sgr A*. Blue points (red triangles) indicate WR/O (mK < 14) stars on clockwise (counterclockwise) orbits and green squares indicate B-dwarfs in the magnitude bin 14.5mK15.5. The blue and red arrows show the 90% confidence limit to the number density of WR/O-stars in the innermost 0.8 and counterclockwise WR/O-stars in the radial interval between 15and 25. For comparison, the open asterisks indicate all stars with
mK<17 and the full asterisks the identified late-type stars withmK<15.5. (A color version of this figure is available in the online journal.)
to observe no star for 28 expected stars is 5.6×10⁻¹³ and
the Poisson probability to observe none of 12 expected stars is still 6×10⁻⁶. Therefore we conclude that there is a significant cutoff in the distribution of WR/O-stars atR=0.8. The
differ-ence compared to theR−2power law suggested by earlier work
(Paumard et al. 2006; Lu et al. 2009; Bartko et al. 2009) is
due to the thorough completeness and coverage correction ap-plied here. The surface density distribution of the counterclock-wise WR/O-stars is rather flat between 0.8 and 15, mainly because it has a larger central “hole” than the clockwise stars
and a maximum in the distribution at around 4.5. The radial
surface density profile of B-dwarfs in the magnitude interval 14.5mK 15.5 drops smoothly from the central 0.8,where the S-stars reside, out to about 25. Its distribution is similar
to the clockwise WR/O-stars with a best-fitting power law of
Σ(R) ∝ R−1.5±0.2. In strong contrast to the early-type stars, late-type stars withmK 15.5 exhibit a flat distribution inside of 10,in excellent agreement with Buchholz et al. (2009) and Do et al. (2009).
4.2. K-Band Luminosity Function
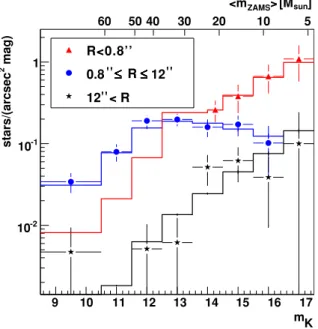
Figure3shows the completeness-correctedK-band
luminos-ity functions of early-type stars in three radial intervalsR <0.8,
0.8 R 12, and 12 < R <25. The slope of the KLF
is sensitive to the stellar mass function (MF). If the population formed in situ without being affected by dynamical effects that might alter the mix of stellar masses in the observed sample, the observed KLF of a young population is directly related to the initial stellar mass function (IMF).
The stellar disks (best defined in the radial interval 0.8
mK
9 10 11 12 13 14 15 16 17
mag)
2
stars/(arcsec
-2
10
-1
10
1 R<0.8’’
12 R ≤
0.8
12 < R
]
sun
[M
ZAMS
<m > 5 10 20 30 40 50 60
Figure 3.Completeness-correctedK-band luminosity functions of early-type stars in three radial intervalsR <0.8 (red triangles, scaled by a factor 0.05), 0.8R12(blue points), and 12< R <25(black asterisks). For a 6 Myr population the best-fitting IMF in the radial interval 0.8R12, where the disks of early-type stars are most prominent, is extremely top heavy and clearly different from the IMFs of the S-stars and the field stars beyond 12. It can be fitted by a power-law IMF ofdN/dm∝m−0.45±0.3or the IMF proposed by Bonnell & Rice (2008). The IMF of the field stars beyond 12as well as the S-stars within 0.8 can be fitted by a power-law IMF ofdN/dm∝m−2.15±0.3,
consistent with a standard Salpeter/Kroupa IMF. These latter KLFs can also be fitted by somewhat older populations with a continuous star formation history, which would then, however, predict lower numbers ofmK14 stars (relevant for S-star cluster). The topx-axis shows the average initial mass of the early-type stars contributing to theK-band magnitude bins for the case of a starburst 6 Myr ago with an IMF with a slope ofdN/dm∝m−0.45±0.3as generated with
the STARS code. Most of the stars withmK >14 are B dwarfs, the brighter magnitude bins contain O dwarfs, giants, and WR stars. The main sequence ends at aboutmK=12, corresponding to an initial stellar mass of about 25M. (A color version of this figure is available in the online journal.)
have a different formation process than the stellar disks (Perets et al.2009).
The two main scenarios discussed in the literature for the origin of the disk-like structures of young stars in the Galactic
Center (GC) are the infalling cluster model (Gerhard 2001;
McMillan & Portegies Zwart2003; Portegies Zwart et al.2003; Kim & Morris2003; Kim et al.2004; G¨urkan & Rasio2005) and the in situ star formation model (Levin & Beloborodov
2003; Genzel et al.2003; Goodman2003; Milosavljevi´c & Loeb
2004; Nayakshin & Cuadra2005; Paumard et al.2006; Klessen et al.2007; Bonnell & Rice2008; Mapelli et al2008; Hobbs &
Nayakshin2009).
In the infalling cluster scenario, a cluster of young stars
formed at a distance of at least a few parsecs from the GC and then spiraled inward by dynamical friction. As it finally enters the central parsec it is tidally disrupted and forms a disk-like configuration. If the cluster is dense enough to undergo significant internal mass segregation during the in-spiral phase this scenario does predict a fairly flat MF for the innermost deposited stars even if the assumed intrinsic IMF of the cluster is a standard one (MF:dN/dm∝m−1.1, G¨urkan & Rasio2005). This is because mass segregation within the cluster leads to a differential shedding of stars of different masses as the cluster is tidally stripped during in-spiral. Lower mass stars are deposited further out, while the most massive stars sink the farthest in,
especially if the cluster contains a central intermediate mass black hole (G¨urkan & Rasio2005). The differential shedding of different stellar masses combined with the predicted flat surface density of the deposited cluster stars (Σ∝R−0.75; Berukoff &
Hansen2006) would then lead to a strong radial change in the
MF and a large “sea” of B-stars outside the region where most of the O/WR-stars are located in the plane of the stellar disks. No such gradient is observed in the main part of the disk (R <12).
Figure3does show that the KLF and MF of the stars outside 12
steepens, consistent with a normal IMF. The observed B-stars at
R >12, however, have large angular offsets to the disk angular momentum directions and are compatible with isotropic orbits, indicating that these stars were not formed in the same way as the disk stars. In addition, the steep surface density distribution excludes that there are enough B-stars at large distances to make up for the shortage of such stars in the central 12: 49.3±5.7
stars in the magnitude range 13.5 mK 16.5 would be
needed (assuming a standard Salpeter/Kroupa IMF) in the radial
interval 12R 25, but only 13 stars have been observed.
In the in situ model, a clump or clumps of gas fall into the GC, where they form a disk-like structure. The gaseous disk then fragments to form stars. The detailed observations by Paumard et al. (2006), Bartko et al. (2009), and Lu et al.
(2009) are compatible with an in situ formation of these
WR/O-stars in a clockwise rotating disk and another highly
inclined counterclockwise structure, possibly a disk. The mass segregation timescales in the GC are much larger than 6 Myr
(Alexander2005). We therefore assume that the stars generated
in situ in the starburst 6 Myr ago are almost fully contained in the observed sample of early-type stars in the radial interval
0.8R12.
Our observations clearly demonstrate that the (I)MF in the
radial interval 0.8 R 12, where the disks of early-type
stars are most prominent (see Figure2), must be extremely top
heavy. This MF is also clearly different from the MFs of the S-star cluster and from the region outside 12.
The histograms in Figure 3 show three theoretical model
luminosity functions with different IMFs (see, e.g., Muench
et al. 2000, 2002). We computed these models using the
population synthesis code STARS (Sternberg1998; Sternberg
et al. 2003) assuming solar metallicity Geneva tracks, for a
cluster age of 6 Myr, and an exponentially decaying star burst
with a 1/e timescale of 1 Myr. This is the best-fitting age
and duration of a single star formation event derived from
the Hertzsprung–Russell diagram distribution of the O/B-stars
and the ratios of various sub-types of WR-stars (Paumard
et al.2006). STARS computesKmagnitudes using empirical
Schmidt–Kaler bolometric corrections and V−K colors for
dwarfs, giants, and supergiants. The predicted fractions of O/B main-sequence stars and giants as well as WR stars agree well with the observations (Paumard et al.2006): stars withmK <12 are WR stars and stars withmK >15 are B main-sequence stars.
Stars withmK ∼13 are WR stars (66%), evolved early B-stars
(31%) and late O-stars (3%). Stars withmK ∼14 are O-stars
(15%) and evolved early B-stars (85%). Martins et al. (2007)
presented detailed stellar atmosphere modelings of a significant fraction of the post-main-sequence blue supergiants and WR stars, which have ages of 4–8 Myr and zero-age main-sequence (ZAMS) masses of at least 60M, see also Ott et al. (1999) and Martins et al. (2006). The average properties of the generated stars are compatible with the observations.
The KLF in the radial interval 0.8R 12can be fitted
min angular distance to clockwise disk
0 20 40 60 80 100 120
# stars
0 2 4 6 8 10 12 14
mK<14
15 mK 14
mK>15
Figure 4. Distribution of the reconstructed angular differences from the local average angular momentum direction of the clockwise system for the early-type stars with projected distances between 0.8 and 12. The three distributions correspond to differentK-band luminosities: black,mK < 14; red, 14mK 15;green,mK >15. Only 1 out of 11 stars fainter than
mK=15 is compatible with the clockwise disk.
(A color version of this figure is available in the online journal.)
6 degrees of freedom). For comparison, the standard Salpeter/
Kroupa IMF has a high-mass power law ofdN/dm∝m−2.3. The IMF found by Bonnell & Rice (2008) for their 105M
cloud
simulation also gives a reasonable fit to the data (χ2 = 7.6, 6 degrees of freedom). We have also selected only those early-type stars, which have an angular offset of less than 10◦from the
local disk angular momentum direction (see Bartko et al.2009)
and subsequently fitted by the theoretical KLF as a function of IMF slope. The obtained IMF slope agrees with the IMF slope of all stars in the radial interval 0.8R12within errors.
The IMF of the field early-type stars beyond 12 and the
S-stars within 0.8 can be fitted by a power-law IMF with a
slope of dN/dm ∝ m−2.15±0.3, compatible with a standard
Salpeter/Kroupa IMF. These latter KLFs can also be fitted by
Salpeter/Kroupa IMFs and continuous star formation histories
with moderate ages (60 Myr).
It is straightforward to compute a one-to-one relation between
observedK-band magnitude and initial mass for stars on the
main sequence. However, for evolved stars a range of masses contribute at a givenKmagnitude. Therefore, we do not estimate the initial mass for each star but rather compare the observed
distribution ofK-band magnitudes to the simulated magnitude
distribution for different IMFs. The topx-axis of Figure3shows the average initial mass of the early-type stars contributing to
theK-band magnitude bins for a 6 Myr old cluster for an IMF
ofdN/dm∝m−0.45 as generated with the STARS code. Most
of the stars withmK >14 are B dwarfs, the brighter magnitude
bins contain O dwarfs, giants, and WR stars. The main sequence
ends at about mK = 12, corresponding to stars with initial
masses of about 25Mwith main-sequence lifetimes of 6 Myr.
AnmK = 16.5 early-type star for a 6 Myr old population
corresponds approximately to a B5V main-sequence star with a
ZAMS mass of about 7M (see Figure3). The most massive
stars with an individual mass estimates have ZAMS masses of
at least 60M (Martins et al.2006,2007). Our estimated IMF
slope of the stellar disks (dN/dm∝m−0.45±0.3) is therefore at least valid over the mass interval 7–60M.
φ
0 1 2 3 4 5 6
)
θ
cos (
-1 -0.8 -0.6 -0.4 -0.2 -0 0.2 0.4 0.6 0.8 1
significance
-2 0 2 4 6 8
Figure 5.Cylindrical equal area projection of the distribution of significance in the sky (25◦aperture, see Bartko et al.2009) for 82 bona fide early-type stars (mK < 14) with projected distances between 3.5 and 15. The disk positions of Paumard et al. (2006) are marked with full black circles. There are two extended excesses visible for clockwise and counterclockwise stars, with maximum significances of 8.2σ and 7.1σ, respectively. We attribute these two extended excess systems as two warped systems of stars.
(A color version of this figure is available in the online journal.)
4.3. Orbital Angular Momentum Directions
Figure4shows the distributions of the reconstructed angular
differences from the local average angular momentum direction
of the clockwise system, as defined in Bartko et al. (2009),
for the early-type stars with projected distances between 0.8 and 12. The three distributions correspond to differentK-band
luminosities:mK <14, 14 mK 15, and mK > 15. The
peak at small angles corresponds to the clockwise system: 50
out of 110 stars withmK <14 have offsets below 20◦ and 8
out of 15 stars with 14 mK 15 have offsets below 20◦.
In contrast, only 1 out of 11 stars fainter than mK = 15 is
compatible with the clockwise disk. This may be an indication that most of the few later B-dwarfs observed in the region of the disks do not belong to the clockwise system but rather to the
background population seen at projected distances beyond 12,
which has a more standard IMF.
According to Figure2, the clockwise system of massive early-type stars is best defined in the radial range between 0.8 and 10 and has a steep surface density distribution. However, most of the counterclockwise stars reside in the range between 3.5 and
15, where we have added considerable SINFONI sky coverage
compared to the study of Bartko et al. (2009). In order to test for the existence of a significant system of counterclockwise stars, we have computed a sky significance map of angular momentum overdensities for all bona fide early-type stars (mK <14) with
projected distances between 3.5 and 15, see Figure5. For the technical details see Bartko et al. (2009). There are two extended excesses visible for clockwise and counterclockwise stars, with
maximum significances of 8.2σ and 7.1σ, respectively. These
maximum excesses are clearly offset from the positions found
at small projected distances (Paumard et al. 2006; Lu et al.
2009; Bartko et al. 2009) indicating that the two extended
5. DISCUSSION
The observations discussed in the last section, in combina-tion with the results presented in recent published work (Genzel et al.2003; Eisenhauer et al.2005; Nayakshin & Sunyaev2005; Sch¨odel et al.2007; Paumard et al.2006; Lu et al.2009; Bartko et al.2009; Gillessen et al.2009; Buchholz et al.2009; Do et al.
2009), yield the following complex and rather unexpected
prop-erties of the stellar cluster surrounding the central black hole:
1. Most of the early-type stars in the central parsec reside in a combination of a central concentration of main-sequence B-stars centered on the black hole (the “S-star cluster”), plus two strongly warped and almost orthogonal disks (or planar sets of streamers) of WR-, O-, and early B-stars. One disk
is more massive than the second (∼104and∼5×10³M
,
computed from the completeness- and exposure-corrected number counts and the best-fit IMF). The second disk is less well defined, perhaps because it is more disrupted. The surface density distribution of the B-stars appears to decline smoothly with approximately constant slope (1.5) from the central S-star cluster to the region of the disks. However, both the dynamics and the mass function change abruptly at 1. Inside this radius, the stellar orbit distribution is random and the ellipticity distribution is close to but somewhat hotter than a thermal distribution (Gillessen et al.
2009). The observed KLF can be well fitted by a “standard”
Salpeter/Kroupa IMF for a single age or continuously star
forming population of age a few to 60 Myr. Just outside
of this region most of the WR/O-stars are in the dominant
clockwise disk, which has a 10◦ opening angle and stellar
orbits with modest (e ∼ 0.35) eccentricities. The IMF is
extremely flat (power-law slope 0.45) with a mean stellar
mass of 30M. Outside of the region dominated by the
two disks, atR12, the KLF appears to again approach
that of a “standard” IMF. Note, however, that even between
1 and 12∼20–30% of the WR/O-stars, and probably a
larger fraction of the B-stars, do not appear to belong to either disk system.
2. The late-type stars of all luminosities, from the brightest thermally pulsing asymptotic giant branch stars to the faintest, low-mass red clump stars, do not show a central concentration that might resemble a classical equilibrium stellar “cusp” as predicted by all theoretical studies (Bahcall
& Wolf 1976, 1977; Freitag et al. 2006; Hopman &
Alexander 2006). The brightest late-type stars show a
central hole of radius a few to 7 (Sellgren et al. 1990;
Genzel et al.1996; Haller et al.1996) and even the faint
early K-giants withmK ∼ 15 show a flat core of radius
10 (Buchholz et al.2009; Do et al.2009), see Figure2. The combination of the S-star cluster (mostly unrelaxed early-type stars) and the flat late-type star distribution “conspire” to give a shallow overall cusp (surface density slope 0.2. . .0.4) found in the faint star counts in Figure1
(Genzel et al.2003; Sch¨odel et al.2007).
The observations suggest that the two WR/O/B-star
disks between 0.8 and 12are structurally and dynamically distinct from both the S-star cluster and the outer region. The properties of these warped disks (or sets of stream-ers), including in particular their steep surface density distribution, their top heavy IMF, and their relatively low to-tal stellar masses, all strongly favor an in situ star formation
model (Paumard et al.2006; Lu et al.2009; Bartko et al.
2009; Berukoff & Hansen2006) and broadly agree with the
findings in recent hydrodynamical simulations (Bonnell &
Rice 2008; Hobbs & Nayakshin 2009) of star formation
triggered by gas cloud infall. The sharp transition at 0.8 between disk zone and S-star cluster, both in terms of dy-namics and mass function, in our opinion also strongly disfavors migration scenarios from the disks for the origin of the S-star cluster. In turn, this sharp transition supports the “injection and capture” scenarios mentioned in the in-troduction.
The large central core (and perhaps even central hole,
see Buchholz et al.2009; Do et al. 2009) in the density
distribution of late-type stars of all luminosities is puz-zling and currently not understood. There are a number of possible interpretations, none of which at present offer a
compelling explanation. As discussed by Do et al. (2009)
and Buchholz et al. (2009) equilibrium mass segregation
by itself cannot account for this distribution (Freitag et al.
2006; Hopman & Alexander2006), as even in a multi-mass cluster the lightest stars attain a radial density distribution that is steeper thanR−1(probably excluded by the data: Do et al.2009). Simulations indicate that physical collisions with main-sequence stars and stellar black holes can re-move moderately bright giants in the central arcsecond, but
not over a much larger region, nor tomK ∼15 (Dale et al.
2009). Likewise, tidal disruption of stars may play a role
near the massive black hole (Perets et al.2009) but it needs to be investigated whether they are frequent enough to re-move the entire old cusp. The in-spiral of an intermediate mass black hole can plausibly gouge out a large enough core in the stellar distribution (Milosavljevic & Merritt 2001;
Baumgardt et al.2006) but there is no evidence for such a
second black hole from the dynamical properties of the S-stars or late-type stars, nor from the motion of Sgr A* itself (Gillessen et al.2009; Gualandris & Merritt
2009; Trippe et al. 2008; Reid & Brunnthaler 2004).
Merritt (2009) has pointed out that the two-body relaxation timescale probably is significantly longer than the age of the Galactic center star cluster (and the Hubble time) through-out the central parsec, especially if the spatial distribution of the giants is similar to that of most of the stellar mass. As a result, the observed large core may reflect the initial con-ditions of the Galactic center nuclear cluster. Trippe et al. (2008) find, however, that the dynamics of the old star clus-ter is consistent with a relaxed, fully phase mixed system.
In addition, Alexander (2007) has pointed out the
impor-tance of relaxation processes much faster than the standard two-body rate (including the massive perturbers proposed
by Perets et al. 2007). The top-heavy IMF discussed in
this paper (if applicable to early star formation episodes) would obviously also lead to a lack of old low mass gi-ants in the core. To explain the flat or even inverted radial
slope (Do et al.2009; Buchholz et al.2009, this paper),
the IMF probably would have to depend strongly on radius. The remarkable properties of the Galactic center nuclear star cluster remain puzzling and continue to give us food for thought and further work.
REFERENCES
Alexander, T. 2005, Phys. Rev., 419, 65 Alexander, T. 2007, arXiv:0708.0688
Allen, D. A., Hyland, A. R., & Hillier, D. J. 1990, MNRAS,244, 706 Bahcall, J. N., & Wolf, R. A. 1976,ApJ,209, 214
Bahcall, J. N., & Wolf, R. A. 1977,ApJ,216, 883 Bartko, H., et al. 2009,ApJ,697, 1741
Baumgardt, H., et al. 2006,MNRAS,372, 467 Berukoff, S. J., & Hansen, B. M. S. 2006,ApJ,650, 901 Biretta, J. A., Lo, K. Y., & Young, P. J. 1982,ApJ,262, 578 Blum, R. D., Depoy, D. L., & Sellgren, K. 1995,ApJ,441, 603 Blum, R. D., Sellgren, K., & Depoy, D. L. 1996a,ApJ,470, 864 Blum, R. D., Sellgren, K., & Depoy, D. L. 1996b,AJ,112, 1988
Blum, R. D., Ramirez, S. V., Sellgren, K., & Olsen, K. 2003,ApJ,597, 323 Bonaccini Calia, D., et al. 2006, Proc. SPIE,6272, 6
Bonnell, I. A., & Rice, W. K. M. 2008,Science,321, 1060 Buchholz, R. M., Sch¨odel, R., & Eckart, A. 2009,A&A,499, 483 Dale, J. E., et al. 2009,MNRAS,393, 1016
Do, T., et al. 2009,ApJ,703, 1323
Eisenhauer, F., et al. 2003, Messenger,113, 17 Eisenhauer, F., et al. 2005,ApJ,628, 246
Forrest, W. J., et al. 1987, in AIP Conf. Proc. 1555, The Galactic Center, ed. D. C. Backer (Melville, NY: AIP),153
Freitag, M., Amaro-Seoane, P., & Kalogera, V. 2006,ApJ,649, 91 Genzel, R., et al. 1996,ApJ,472, 153
Genzel, R., et al. 2003,ApJ,594, 812 Gerhard, O. 2001,ApJ,546, L39 Ghez, A., et al. 2003,ApJ,586, L127 Gillessen, S., et al. 2009,ApJ,692, 1075 Goodman, J. 2003,MNRAS,339, 937
Gualandris, A., & Merritt, D. 2009,ApJ, 705, 361 G¨urkan, M. A., & Rasio, F. A. 2005,ApJ,628, 236 Haller, J. W., et al. 1996,ApJ,456, 194
Hills, J. G. 1988,Nature,331, 687
Hobbs, A., & Nayakshin, S. 2009,MNRAS,394, 191 Hopman, C., & Alexander, T. 2006,ApJ,645, L133 Kim, S. S., & Morris, M. 2003,ApJ,597, 312
Kim, S. S., Figer, D. F., & Morris, M. 2004,ApJ,607, L123
Klessen, R. S., Spaans, M., & Jappsen, A. K. 2007,MNRAS,374, L29 Krabbe, A., et al. 1991,ApJ,382, L19
Krabbe, A., et al. 1995,ApJ,447, L95
Levin, Y., & Beloborodov, A. M. 2003,ApJ,590, L33 Levin, Y. 2007,MNRAS,374, 515
L¨ockmann, U., Baumgardt, H., & Kroupa, P. 2008,ApJ,683, L151 Lu, J. R., et al. 2009,ApJ,690, 1463
Maness, H., et al. 2007,ApJ,669, 1024
Mapelli, M., Hayfield, T., Mayer, L., & Wadsley, J. 2008, arXiv0805.0185 Martins, F., et al. 2006,ApJ,649, 103
Martins, F., et al. 2007,A&A,468, 233 Martins, F., et al. 2008,ApJ,672, 119
McMillan, S. L. W., & Portegies Zwart, S. F. 2003,ApJ,596, 314 Merritt, D. 2009, arXiv0909.1318
Milosavljevic, M., & Merritt, D. 2001,ApJ,563, 34 Milosavljevi´c, M., & Loeb, A. 2004,ApJ,604, L45 Morris, M. 1993,ApJ,408, 493
Muench, A. A., Lada, E. A., & Lada, C. J. 2000,ApJ,533, 358 Muench, A. A., et al. 2000,ApJ,533, 358
Najarro, F., et al. 1994, A&A,285, 573 Najarro, F., et al. 1997, A&A,325, 700
Nayakshin, S., & Cuadra, J. J. 2005,A&A,437, 437 Nayakshin, S., & Sunyaev, R. 2005, MNRAS,364, L23 Ott, T., Eckart, A., & Genzel, R. 1999,ApJ,523, 248 Paumard, T., et al. 2006,ApJ,643, 1011
Perets, H. B., Hopman, C., & Alexander, T. 2007,ApJ,656, 709 Perets, H. B., et al. 2009,ApJ,702, 884
Portegies Zwart, S. F., McMillan, S. L. W., & Gerhard, O. 2003,ApJ,593, 352
Rabien, S., et al. 2003,Proc. SPIE,4839, 393 Reid, M. J., & Brunnthaler, A. 2004,ApJ,616, 872 Rieke, G. H., & Rieke, M. J. 1989,ApJ,344, L5 Sch¨odel, R., et al. 2007,A&A,469, 125
Sellgren, K., McGinn, M. T., Becklin, E. E., & Hall, D. N. 1990,ApJ,359, 112 Sternberg, A. 1998,ApJ,506, 721
Sternberg, A., Hoffmann, T. L., & Pauldrach, A. W. A. 2003,ApJ,599, 1333 Stetson, P. B. 1987,PASP,99, 191