DEVELOPING TOOLS FOR PAPER-BASED CULTURES TO INTERROGATE OXYGEN’S ROLE IN CANCER PROGRESSION
Matthew William Boyce
A dissertation submitted to the faculty at University of North Carolina at Chapel Hill in partial fulfillment of the requirements for the degree of Doctor of Philosophy in the Department of
Chemistry in the School of Arts and Sciences.
Chapel Hill 2018
Approved by: Matthew Lockett Jim Jorgenson Amanda Hummon Gary Glish
ii © 2018
iii ABSTRACT
Matthew William Boyce: Developing tools for paper-based cultures to interrogate oxygen’s role in cancer progression
(Under the direction of Matthew R. Lockett)
Oxygen contributes to cellular phenotypes and invasiveness through hypoxia-inducible transcription factors. These factors, which induce signaling pathways at low-oxygen tensions, are involved with the maintenance of healthy tissue and the progression of cancer. Poor
vascularization within rapidly growing tumors leads to the production of atypical gradients of oxygen. Cells experiencing these gradients develop into heterogeneous populations and develop increasingly aggressive phenotypes. To better understand the relationship between extracellular oxygen tension and cancer cell phenotype, in vitro models are needed that can easily relate these variables while providing experimental control over the environment.
iv
In this work, PBCs were used to explore the relationship between oxygen gradients and cancer chemosensitivity. Quantification of oxygen gradients within PBCs was performed using luminescent oxygen-sensors. These sensors were developed and characterized, then used to measure oxygen gradients in PBCs containing different densities of a colon carcinoma cell line, HCT-116. Dosing these cultures with a cytotoxic molecule, SN-38, showed regional differences in chemosensitivity, with hypoxic cells exhibiting increased chemoresistance.
In addition to studying gradients in PBCs, I also fabricated a fluidic device capable of generating oxygen gradients across static three-dimensional (3D) cultures. The PBCs used to date were unable to generate oxygen gradients across the culture without also generating concurrent gradients of nutrients and waste products. With this device, oxygen gradients can be decoupled from nutrient and waste gradients. These oxygen gradients are imposed on the cultures and are not dictated by cellular consumption.
v
vi
ACKNOWLEDGEMENTS
I would like thank the many people who have made this work possible. Chief amongst them is my advisor, Dr. Matthew Lockett, who has provided thoughtful guidance throughout my graduate career. Thank you for challenging me to grow as a scientist and providing me the freedom to explore research topics that I found interesting. I also want to acknowledge our collaborator, Dr. Amanda Hummon, and her graduate student, Gabe LaBonia, who have significantly contributed to research presented in this dissertation.
I would like to thank Eli Lilly, the Eastman Chemical Company, and the UNC Graduate School for helping fund this research. In addition, I want to recognize the Chapel Hill Analytical and Nanofabrication Lab (CHANL), Microscopy Services Laboratory (MSL), and UNC Be A Maker (BEAM) facilities, all of which provided the necessary resources to conduct this research.
Thank you to my undergraduate research advisors Dr. Maury Howard, Dr. John Molloy, and Dr. Phillip Rock for introducing me to research and putting me on this path in life.
Thank you to the members of the Lockett lab for providing thoughtful discussions, assistance with scientific ventures, and comradery throughout my time at UNC. Specifically, I would like to thank Rachael Kenney, who has helped me with a number of research projects and whose friendship has been a boon throughout graduate school.
vii
TABLE OF CONTENTS
LIST OF TABLES ... xii
LIST OF FIGURES ... xiii
LIST OF ABBREVIATIONS AND SYMBOLS ... xvi
CHAPTER 1: ADAPTING PAPER-BASED CULTURES AS A TUMOR MODEL ...1
1.1 Oxygen and cancer progression ...2
1.1.1 The tumor microenvironment ...2
1.1.2 Oxygen’s role in tumor progression ...4
1.2 Oxygen gradients in vitro ...5
1.2.1 Oxygen gradients in 2D cultures ...5
1.2.2 Oxygen gradients in 3D cultures ...6
1.2.3 Quantifying oxygen gradients in vitro ...8
1.3 Paper-based cultures as a tumor model ...9
1.3.1 Paper-based cultures ...10
1.3.2 Using paper cultures to replicate the tumor ...12
1.4 Interrogating cellular responses in paper cultures ...13
1.4.1 Enumerating viable cells ...14
viii
1.5 Overview of the dissertation...17
1.6 Figures ...18
REFERENCES ...23
CHAPTER 2: QUANTIFYING OXYGEN IN PAPER-BASED CELL CULTURES WITH LUMINESCENT THIN FILM SENSORS ...30
2.1 Introduction ...30
2.2 Materials and Methods ...32
2.2.1 Thin film preparation ...32
2.2.2 Sensor characterization ...33
2.2.3 Cell culture ...33
2.2.4 Paper-based scaffold preparation ...34
2.2.5 Sensor cytotoxicity ...34
2.2.6 Cell culture with sensor integration ...36
2.2.7 Image acquisition and processing ...36
2.2.8 Statistical analysis ...37
2.3 Results and Discussion ...37
2.3.1 Oxygen sensor characterization ...37
2.3.2 Sensors cytotoxicity...40
2.3.3 Oxygen tension in channel culture ...40
ix
2.5 Tables and Figures ...46
REFERENCES ...54
CHAPTER 3: BLOCCs, AN INEXPENSIVE AND MODULARE FLUIDIC CHIP CAPABLE OF GENERATING LINEAR OXYGEN GRADIENTS IN THREE-DIMENSIONAL CULTURES ...57
3.1 Introduction ...57
3.2 Materials and Methods ...59
3.2.1 Cell lines and culture reagents ...59
3.2.2 Chip fabrication and assembly ...60
3.2.3 Oxygen gradient generation and quantification ...60
3.2.4 Image acquisition and analysis ...61
3.2.5 Statistical analysis ...62
3.3 Results and Discussion ...62
3.3.1 BLOCCs are an inexpensive and simple-to-fabricate cell culture platform ...62
3.3.2 BLOCCs are compatible with prolonged cell culture ...64
3.3.3 Oxygen gradients are reproducible, tunable, and persistent across 3D cultures ...65
3.3.4 Oxygen gradients in BLOCCs can be correlated to HIF activation in MDA-MB-231 cells ...66
3.4 Conclusion ...69
3.5 Figures ...70
x
CHAPTER 4: ASSESSING CHEMOTHERAPEUTIC EFFECTIVENESS USING
A PAPER-BASED TUMORE MODEL ...78
4.1 Introduction ...78
4.2 Experimental ...80
4.2.1 Cell culture ...80
4.2.2 Paper scaffold and PET film preparation ...81
4.2.3 Assembling PBCs ...82
4.2.4 Immunocytochemistry ...83
4.2.5 Oxygen sensor integration and interrogation ...83
4.2.6 SN-38 dose-response assay ...84
4.2.7 Fluorescein penetration assay ...85
4.2.8 Image acquisition and analysis ...85
4.2.9 Statistical analysis ...86
4.3 Results and discussion ...86
4.3.1 Constructing a paper-based colon tumor model ...86
4.3.2 Proximity to a nutrient source affects spatiotemporal distribution of cells ...88
4.3.3 Proliferative populations occur within 90 µm of the nutrient source ...89
4.3.4 Oxygen gradients can be modulated with cell density ...90
4.3.5 Different chemical conditions yield different chemoresistances ...92
4.4 Conclusion ...95
xi
REFERENCES ...101
CHAPTER 5: FUTURE DIRECTIONS ADAPTING PAPER-BASED CULTURES FOR FLOW CYTOMETRY ...105
5.1 Introduction ...105
5.2 Ongoing work ...107
5.2.1 Designing a paper-based culture for flow cytometry ...107
5.2.2 Extracting cells from a paper-based culture ...108
5.2.3 Discerning between live, dead, and apoptotic cells ...109
5.3 Future work ...110
5.3.1 Identifying senescent cell populations...110
5.3.2 Evaluating efflux pumps...111
5.4 Conclusions ...112
5.5 Figures ...113
REFERENCES ...118
APPENDIX A: SUPPLEMENTAL INFORMATION FOR CHAPTER 2 ...121
APPENDIX B: SUPPLEMENTAL INFORMATION FOR CHAPTER 3 ...125
xii
LIST OF TABLES
Table 2.1 Pd(II)- and Pt(II)-based oxygen sensors ...46 Table C4.1 Statistical comparisons between mCHR fluorescence intensity
of cultures seeded at 84,000 cells/zone and dosed with different
concentrations of SN-38 ...133 Table C4.2 Statistical comparisons between mCHR fluorescence intensity
of cultures seeded at 21,000 cells/zone and dosed with different
xiii
LIST OF FIGURES
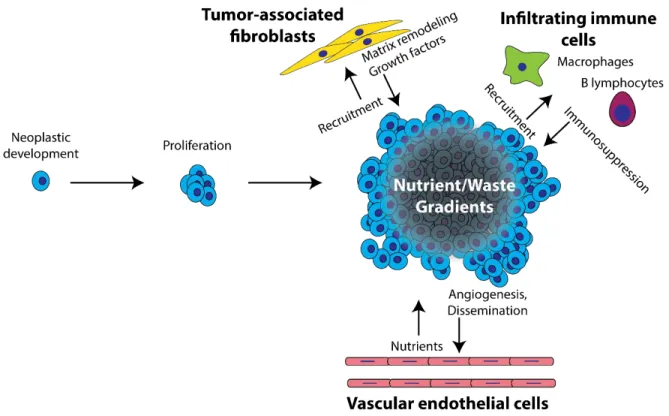
Figure 1.1 Diagram of the progression of cancer from initial development
of a neoplastic cell to the growth and evolution of a TME ...18
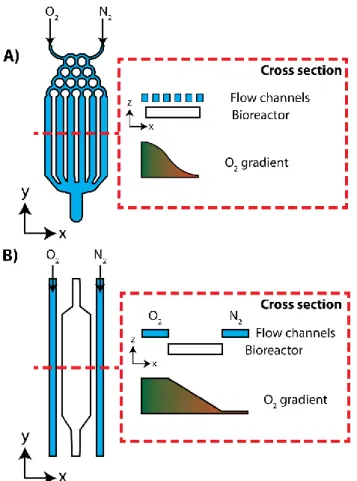
Figure 1.2 Design examples of microfluidic oxygen gradient generators ...19
Figure 1.3 Schematic of stack- and channel-shaped paper-based cultures ...20
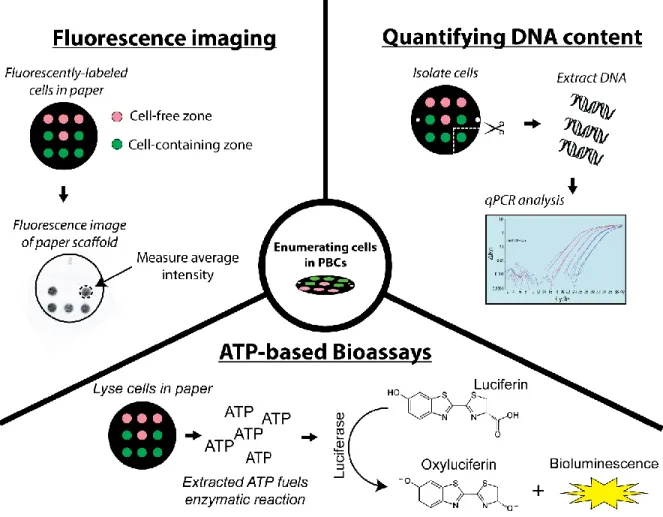
Figure 1.4 Overview of common techniques used to enumerate viable cells in PBCs ...21
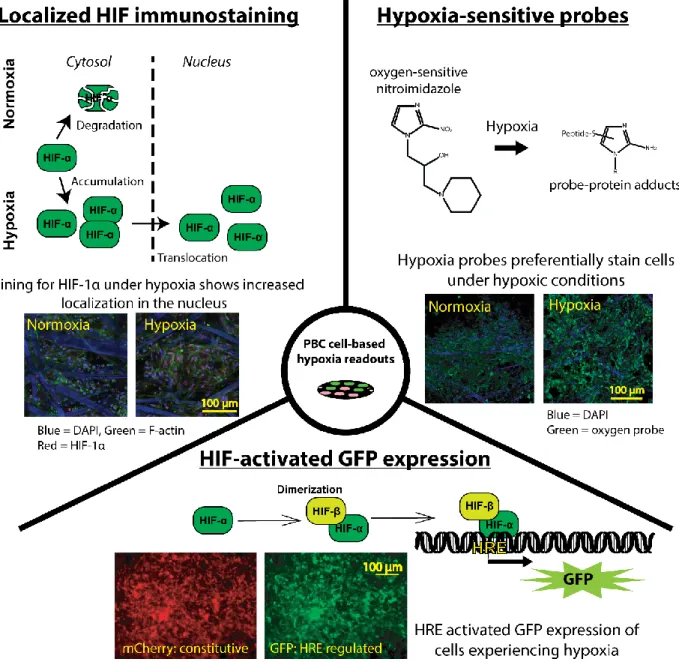
Figure 1.5 Overview of cell-based assays designed to identify intracellular hypoxia in PBCs ...22
Figure 2.1 Schematic of the experimental setup used in this chapter ...47
Figure 2.2 Schematic of the flow cell apparatus used to characterize the fluorescence intensity of the oxygen sensors exposed to different concentrations of oxygen ...48
Figure 2.3 Sensor characterization ...49
Figure 2.4 Sensor cytotoxicity...50
Figure 2.5 In situ oxygen quantification ...51
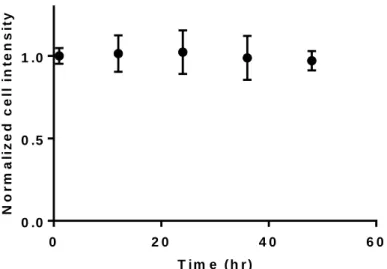
Figure 2.6 Average fluorescence intensity of M231-eGFP cells during gradient analysis...52
Figure 2.7 Overlay of the oxygen gradients formed at the cell fronts proximal and distal to the cellulose acetate openings in the paper-based cultured ...53
Figure 3.1 Schematic depicting the fabrication and assembly of a BLOCC ...70
Figure 3.2 The biocompatibility of the silicone and acrylic components used to construct the BLOCCs was measured after a 48h incubations ...71
Figure 3.3 Characterization of oxygen gradients within an assembled BLOCC ...72
xiv
Figure 3.5 Correlating hypoxia-responsive signaling in M231-HRE cells to
spatial placement along an oxygen gradient ...74 Figure 4.1 Schematic of the 12-scaffold PBC ...97 Figure 4.2 Stratification of viable and proliferative HCT116 cell populations
after 24h, 72h, 120h, and 168h of incubation. ...98 Figure 4.3 Mapping oxygen tension along stacked cultures containing different
cell densities: 21,000 cells/zone (left) and 84,000 cells/zone (right) ...99 Figure 4.4 Density-dependent responses to SN-38 dosing. Stacked PBCs were
seeded with either (a) 84,000 cells/zone or (b) 21,000 cells/zone
and dosed with increasing concentrations of SN-38 ...100 Figure 5.1 Schematic of new PBC design used for flow cytometric analysis...113 Figure 5.2 2 Representative cytograms showing the viability of HCT-116
cells incubated in (A) static medium, (B) static cell recovery
solution, and (C) vortexed cell recovery solution ...114 Figure 5.3 The distribution of live, dead, and unstained cells were compared
between HCT-116 cells incubated in static medium (Control), cell recovery solution (Rec. Soln.), and vortexed cell recovery
solution (Rec., vortex)...115 Figure 5.4 Representative cytograms of cell populations extracted from
PBCs incubated in either a vehicle control (A-C) or cytotoxic
molecule (14 nM SN-38, D-F) ...116 Figure 5.5 Comparison of relative chemosensitivity between stacked PBCs ...117 Figure A2.1 A schematic of paper-based scaffolds used in the oxygen sensing
experiments ...122 Figure A2.2 A schematic of the cellulose acetate sheet design used in the oxygen sensing
experiments ...123 Figure A2.3 Schematic of the experimental setup and components used for cytotoxicity
experiments ...124 Figure A2.4 Schematic of the stainless-steel holders used to enclose the paper-based
xv
Figure B3.2 BLOCCs incubated with under an oxygen gradient exhibit increased eGFP
expression across all strata of the chip ...127 Figure C4.1 a) Schematic of single-zone scaffolds, prepared using previously
described protocols.1 Each circular scaffold is 6 mm in diameter with a 2.5 mm diameter zone for seeding cells. The grey color corresponds to the wax-patterned region of the scaffold.
b) Photograph of the single-zone scaffold (white outline) being
placed into the well of a 96-well plate ...128 Figure C4.2 Calibration curve relating mCHR fluorescence intensity to number
of the number of HCT116 mCHR cells in a zone of a paper-based
scaffold, imaged with a Typhoon 9400 scanner ...129 Figure C4.3 Oxygen tensions at the bottom of stacked cultures containing 1, 4, 8,
or 12 scaffolds ...130 Figure C4.4 Measuring the penetration of fluorescein into stacked paper-based
cultures (PBCs) using fluorescence microscopy...131 Figure C4.5 Dose-response curves for SN-38 treatment of HCT116 mCHR cells
xvi
LIST OF ABBREVIATIONS AND SYMBOLS
ºC Degree(s) Celsius
[O2] Concentration of oxygen
2D Two-dimensional
3D Three-dimensional
7-AAD 7-aminoactinomycin D
𝜕𝐶
𝜕𝑥 Partial derivative of concertation with respect to x-axis
µg Microgram(s)
µL Microliter(s)
µm Micrometer(s)
µM Micromolar
ρ Corrected volumetric density ABC ATP-binding cassette protein ABS Acrylonitrile styrene
ANOVA Analysis of variance
ATCC American type cancer collection ATP Adenosine triphosphate
BLOCC Block-layered oxygen-controlling chip CAIX Carbonic anhydrous 9
cc Cubic centimeters
cm Centimeter(s)
xvii
CO2 Carbon dioxide
CTG CellTiter-Glo™ CXCR4 Chemokine receptor 4
D Diffusion coefficient DMSO Dimethyl sulfoxide DNA Deoxyribonucleic acid
EDTA Ethylenediaminetetraacetic acid eGFP Enhanced green fluorescent protein ELISA Enzyme-linked immunosorbent assay EMT Epithelial-to-mesenchymal transition FDA Fluorescein diacetate
FIJI FIJI Is Just ImageJ GFP Green fluorescent protein GLUT1 Glucose transporter 1
h Length
h, hr Hour(s)
HCT116-mCHR HCT-116 cells engineered with an mCHR vector HIF Hypoxia-inducible factor
HRE Hypoxia-responsive element
xviii
in Inch
Ir(II) Iridium ion
Jin Flux in
Jout Flux out
Ksv Stern-Volmer constant LED Light-emitting diode LOQ Limit of quantitation
M231 Parental MDA-MB-231 cells
M231-eGFP MDA-MB-231 cells engineered with an eGFP vector M231-HRE MDA-MB-231 engineered with the 5HRE/GFP vector M231-mCHR MDA-MB-231 cells engineered with an mCHR vector
mCHR mCherry
MDR Multidrug resistance
min Minute(s)
mL Milliliter(s)
mm Millimeter(s)
mM Millimolar
mmHg Millimeters mercury MMP2 Matrix metalloproteinase 2
mol Mole(s)
ms Millisecond(s)
MTT 3-(4,5-dimethylthiazol-2-yl)-2,5-diphenyltetrazolium bromide
xix
N2 Diatomic nitrogen
nm Nanometer(s)
nM Nanomolar
O2 Diatomic oxygen
OEP Octaethylporphyrin
OEPK Octaethylporphyrin ketone PBC Paper-based culture
PBS Phosphate buffer saline Pd(II) Palladium ion
PDMS Polydimethylsiloxane
PdTFPP Palladium (II) tetrakis(pentafluorophenyl)porphyrin PET Polyethylene terephthalate
pH -log of hydronium ion concertation
PI Propidium iodide
PMMA Poly(methyl methacrylate) ppi Pulses per inch
PS Polystyrene
Pt(II) Platinum ion
PVC Poly(vinyl chloride)
Q Cellular oxygen consumption rate qPCR Quantitative polymerase chain reaction ROI Region of interest
xx RPMI Roswell Park Memorial Institute Ru(II) Ruthenium ion
SD Standard deviation
sec Second(s)
SEM Standard error of the mean SN-38 7-ethy-10-hydroxy-camptothecin
t Time
TME Tumor microenvironment
UV Ultraviolet
v/v Volume to volume ratio
1
CHAPTER 1: ADAPTING PAPER-BASED CULTURES AS A TUMOR MODEL
Oxygen concentrations within the tumor microenvironment play a critical role in the growth, survival, and eventual metastasis of cancers.1–3 Despite the decades of research showing oxygen’s role in cancer progression, translating in vitro findings to in vivo behavior has been difficult due to a reliance on two-dimensional (2D) cell culture models.4 While these models provide a convenient and high-throughput platform for studying cancer biology, they fail to replicate the complex three-dimensional (3D) physiochemical environments within tumors.5,6 To better recapitulate the tumor environment and improve the biological relevancy of in vitro
studies, 3D cultures have been developed that emulate the diffusion-limited environment of tumors.7,8 By reproducing the mass-transport limitations found within poorly vascularized tumors, hydrogel slab and multicellular tumor spheroid cultures promote the formation of heterogeneous cell populations whose phenotypes are determined by their chemical
environment.9,10 Unfortunately, isolating these phenotypically distinct populations of cells from three-dimensional cultures is difficult, and often requires laborious histological sectioning which prevents recovery of live cell populations for continued culture or downstream analyses. Paper-based cultures (PBCs) are an emerging cell culture platform that can overcome the limitations of current 3D models by providing a novel approach towards culture construction and
2
paper scaffolds. Isolated cell populations can then be recovered for further culturing or used in a number of downstream analyses.
To outline the motivation for this dissertation, this chapter will describe the role oxygen plays in cancer progression and common approaches for generating oxygen gradients in culture systems. The chapter will also cover the application of paper-based culture for studying cancer and highlight methods for interrogating cellular responses for down-stream assays.
1.1 Oxygen and cancer progression
The development of malignant tumors and subsequent invasion to secondary sites (i.e., metastasis) is estimated to be responsible for 90% of cancer-associated deaths.12 To develop strategies that mitigate cancer-related deaths, cellular and environmental mechanisms that affect tumorigenesis must be understood at both the molecular and cellular level. Initiation of tumors begins with the accumulation of genetic mutations that lead to uncontrolled proliferation, ultimately allowing a mutated cell to propagate into a large mass of cells (Fig. 1.1).13 If left unchecked, these cells will develop a unique microenvironment, known as the tumor
microenvironment (TME). This environment is poorly vascularized and provides environmental conditions necessary to promote the development of a metastatic phenotype.14–16 Though genetic dysregulation is understood as the underlying mechanism that initiates cancer, understanding the TME is vital for understanding the progression of cancer towards malignancy.
1.1.1 Tumor microenvironment
3
infiltrating immune cells, and cancer-associated fibroblastic cells.17 The vascular endothelial cells help modulate cancer cell invasion18 and take part in angiogenesis, which provides nutrients to maintain tumor growth19 and vasculature for cancer dissemination.20 Infiltrating immune cells recruited by the tumor produce cytokines that act as immunosuppressers and allow tumors to escape immune destruction.21 Fibroblasts remodel the extracellular matrix to promote cellular growth and survival,22 and release cytokines that recruit immune cells and direct cellular invasion.23,24
Non-cellular elements of the TME include the evolving extracellular matrix and atypical gradients of ambient metabolites (e.g., glucose and oxygen), signaling factors, and waste
products. Of the non-cellular elements present within tumors, atypical gradients play a
significant role in tumor progression by applying spatially distinct selection pressures.25 These pressures lead to the development of heterogeneous populations of cells and promote the development of a metastatic phenotype.26,27
The formation of these atypical gradients within the tumor is the result of an imbalance between cellular growth and tumor vascularization: rapid cellular proliferation outpaces angiogenesis and leads to cellular metabolism outpacing diffusional delivery of nutrients. The inability of vasculature to adequately sustain tumor growth results in regions of depleted
4
1.1.2 Oxygen’s role in tumor progression
Regions of low oxygen tension (i.e., hypoxia) are common within solid tumors, forming at ranges of 70 - 200 µm from vasculature.30 The extent of hypoxia within tumors is indicative of poor patient outcomes31 due to hypoxia’s role in i) increasing the production of reactive oxygen species (ROS), which damage deoxyribonucleic acid (DNA) and cause genetic intability,32,33 and ii) coordinating transcriptional changes, which promote the development of a metastatic
phentoype.3,34 While the specific mechanism that increases ROS production under hypoxic conditions are not fully understood, studies have shown that complexes I, II, and III of the electron transport chain are involved.35,36 Hypoxia-dependent transcriptional regulation, which is coordinated through hypoxia-inducible transcription factors (HIFs), has been thoroughly studied in literature and is heavily implicated in cancer progression.2
5
angiogenesis),40 glucose transporter 1 (GLUT1; anaerobic metabolism),41 carbonic anhydrous IX (CAIX; intracellular pH regulation),42 chemokine receptor (CXCR4; chemokine gradient
detection),43 matrix metalloproteinase 2 (MMP-2, extracellular matrix remodeling),44 p21 (cell cycle arrest),45 and p53 (DNA repair).46 HIF-1α also promotes the expression of TWIST, a gene sequence responsible for coordinating the EMT.34,47 In addition to orchestrating transcriptional regulation, in vitro studies using A549, a non-small lung carcinoma, and MDA-MB-231, a breast carcinoma, suggest that oxygen gradients can help direct cellular invasion.48–51
1.2 Oxygen gradients in vitro
Oxygen’s role as a regulatory metabolite extends beyond cancer regulation, as it plays a vital role in sustaining normal metabolic function for most living organisms. Far-reaching involvement of oxygen in biological systems has spurred research to develop in vitro assays that emulate the oxygen gradients found in vivo. This section will discuss current methods for
imposing oxygen gradients along 2D and 3D cultures, as well as strategies to quantify the oxygen gradients within these systems.
1.2.1 Oxygen gradients in 2D cultures
6
channels from the bioreactor, allowing oxygen to freely diffuse between the structures. Equilibration between the bioreactor’s medium and flow channels’ gasses allow oxygen gradients to form along the cell culture.
Network mixers combine deoxygenated and oxygenated gasses prior to flowing over the bioreactor. In the mixing region, gas inputs are partitioned in a stepwise manner to produce a concentration gradient. The resulting oxygen gradients can be linear, exponential, or sigmoidal depending on the chip design, and can be further modulated by adjusting gas flow rates.52,53 While these chip designs are less commonly used, in part, due to their design complexity, they provide exquisite spatiotemporal control over the oxygen gradients.
Parallel flow microfluidic chips are the more common approach to generating oxygen gradients in cell cultures. In these chips, oxygenated and deoxygenated gasses are flown in parallel channels, which flank the bioreactor region. Equilibrium between the gas channels results in the formation of linear oxygen gradients across the bioreactor region.52,54–56 The
steepness of the oxygen gradients can be modulated by changing the gasses used or adjusting the distance between the gas flow channels.55 In lieu of deoxygenated gas, oxygen scavenging solutions have also been used to generate oxygen gradients in a similar source-sink fashion.48,57
1.2.2 Oxygen gradients in 3D cultures
7
embedded in a hydrogel slab to freestanding cellular masses (i.e., spheroids or organoid). To generate oxygen gradients across hydrogel slab cultures seeded at low cell densities and correspondingly low oxygen consumption rates, microfluidic devices similar to the methods outlined in section 1.2.2 are needed.59,60 Spheroids and hydrogel slab cultures seeded at high cell densities passively generate oxygen gradients via cellular consumption—oxygen must penetrate into the interior of the culture, and equilibrium between cellular consumption and the diffusional delivery results in the formation of gradients in a manner similar to poorly vascularized
tumors.61,62
Studies investigating large spheroids (> 500 µm diameter) have shown that oxygen and glucose gradients induce the stratification cell subpopulations similar to those of tumors: proliferative cells near an oxygen-rich source (e.g., medium or vasculature), senescent cells in the oxygen-poor interior, and necrotic cells in the nutrient-depleted core.7,63 Each of these subpopulations exhibit distinctly different phenotypes, and recapitulating them allows spheroids to serve as a model for evaluating cancer chemotherapeutic resistance,7,64,65 proliferation,66 and gene regulation.67
Identifying how oxygen gradients affect the development of stratified phenotypes in 3D cultures often relies on histological sectioning.68 This technique partitions 3D cultures into thin cross sections, reaching sub-10 µm thicknesses, and is complimented with histological
8
populations after sectioning is an obstacle to 3D cultures and prevents downstream analysis of the cell populations.
1.2.3 Quantifying oxygen gradients in vitro
Emulating oxygen conditions found within tumors requires generating oxygen gradients that span from normoxia (140-40 mmHg O2) to anoxia (< 1 mmHg O2). Sections 1.2.1 and 1.2.2 outlined cell culture formats in which oxygen gradients can be generated in vitro, and this section will outline validation and characterization of these oxygen gradients via direct
quantification.52,59,73 Measurement of oxygen gradients in cell cultures is primarily performed using optodes, which consist of an oxygen-sensitive dye suspended in polymer matrix.
Electroanalytical approaches have also been used to quantify oxygen in spheroids and hydrogel slabs via Clarke-type electrodes;62 however, optical techniques are preferred because they do not consume oxygen during measurement, and can be easily applied to planar surfaces for two-dimensional (2D) mapping of oxygen gradients. Oxygen-sensing particles can also be incorporated into 3D cultures to enable mapping of 3D oxygen gradients.74
A myriad of oxygen-sensitive luminescent dyes have been developed since their conception in the 1930’s, and can be grouped into two categories: i) organic and ii)
metalloporphyrin.75 The organic dyes consist of polycyclic hydrocarbons and include pyrene, anthracene, and fullerene. The metalloporphyrin dyes consist of metal-ligand complexes with Ru(II)-, Pd(II)-, Ir(II)-, and Pt(II) metal centers with incomplete coordination spheres. Both categories of dyes sense oxygen through a similar mechanism: the dyes are normally luminescent but are dynamically quenched by oxygen. The emission of these dyes can be related to
9
I0/I = 1+Ksv[O2] Eq. [1.1] where I0 and I represent the emission intensity in the absence and presence of oxygen, and Ksv is an empirically derived Stern-Volmer constant.
Metalloporphyrin dyes, rather than their organic counterparts, have been exclusively used for oxygen quantification in cell cultures due to their increased sensitivity, photostability, and phosphorescence lifetimes.75 These dyes are also easily sequestered into films or particles with minimal leeching and can be measured using luminescence intensity or lifetime imaging microscopy.76 Integration of these dyes into cell cultures is typically done via thin-film membranes, where the dye is dispersed throughout a thin polymeric film and placed in close proximity to the cell culture. These films enable the mapping of 2D oxygen gradients along cell cultures, 48,52,73,79,80 or can also be coated onto the tip of an optical fiber for point measurements. 77,78 In cases where the dyes are susceptible to leaching or insoluble in the polymer matrix’s solvent, they can be encapsulated into particles. These micron- to nanosized particles can then be dispersed throughout a substrate/film,59,81 suspended in solution,82 or even sequestered by cells to quantify intracellular oxygen concentrations.83
1.3 Paper-based cultures as a tumor model
Current 3D cell culture models are limited in their ability to selectively isolate subpopulations of cells based on their location. Histological sectioning coupled with
10
To better understand adaptations of cancer cell behavior to environmental conditions, a new culture format is needed that is capable of i) replicating the TME in a controllable manner, and ii) isolating viable cell subpopulations for downstream analysis.
Paper-based cultures (PBCs) are an emerging 3D culture platform that overcomes limitations of current 3D models by providing a modular approach towards culture
(de)construction (Fig. 1.3). Within these cultures, cell-laden paper scaffolds are stacked together to form tissue-like constructs. After prolonged incubation, these scaffolds are partitioned by simply peeling the scaffolds apart. Cells within the individual scaffolds can be recovered for continued culture or analyzed via a number of techniques: microscopy,49 fluorescence imaging,11,73,84,85 quantitative polymerase chain-reaction (qPCR),84 mass spectrometry,86 or enzyme-linked immunosorbent assays (ELISAs).50 By stacking enough paper scaffolds together, PBCs can be assembled to resemble poorly-vascularized tumorous tissue and enable mechanistic studies into cancer invasion and chemoresistance.51,87,88
1.3.1 Paper-based cultures
11
and type of cells in a single stack. Cells can be also be confined to discrete regions along individual paper scaffolds by patterning the paper with hydrophobic materials such as wax, polydimethylsiloxane (PDMS), photoresist, or polyvinyl chloride.11,90–93 The simplicity of wax-patterning paper allows novel culture designs to be readily prototyped with nothing more than a commercial printer, eliminating the need for photolithography or embossing setups.
A common strategy in PBCs is to incorporate selectively permeable barriers along the outer periphery of the culture. By placing barriers along one side of a stacked culture and leaving the opposite side open to nutrient-rich medium, monotonic gradients of nutrients, oxygen, and wastes are formed across the thickness of the culture. Barriers made of gas-permeable materials, such as PDMS, can be used to effectively decouple gradients of oxygen from gradients of nutrient and waste.49,50,87 Because stacked cultures require disassembly to analyze cell
populations within individual scaffolds, stacked PBCs are suited for end-point assays rather than kinetic studies.
12
1.3.2 Using paper cultures to replicate the tumor
Gradients in PBCs form via diffusion-consumption mechanisms similar to the gradients that form in poorly vascularized tumors. However, unlike tumorous tissue, PBCs provide a level of control over the gradients that form in situ. By changing cellular placement and density within a stacked or channel-shaped culture, cellular consumption can be spatially modulated to control the shape and steepness of resulting chemical gradients.88 Likewise, interchanging barriers along the culture’s periphery allow gradients to be decoupled from one another. Experimental control over gradient formation in PBCs enables mechanistic studies to be performed that relate cellular behavior within an individual scaffold to that scaffold’s local chemical environment.
Mosadegh et al. capitalized on PBCs’ ability to modulate the formation of chemical
gradients by developing a paper-based invasion assay.51 In this assay, oxygen gradients were modulated within a stacked PBC by adjusting the gas permeability of the peripheral barriers and changing cell proximity to a nutrient-rich source within a stacked PBC. Their findings indicate that A459 lung carcinoma cells preferentially invade toward higher oxygen tensions, which was contradictory to previous findings in 2D culture.48 Truong et al. and Kenney et al.followed-up on this invasion assay using a MDA-MB-231 breast carcinoma cells, and found similar trends in invasion towards oxygen sources.49,84 Hypoxia probes and HIF signaling were used to confirm differences in extracellular oxygen tensions within the invasion assays, and confirm that gradients of oxygen were necessary for directing cellular invasion.50
13
spectrometry to map metabolites of a stacked culture, and found that cells experiencing hypoxia at the interior of a stacked culture exhibited significant increases in anaerobic glycolysis-associated metabolites.86 Further confirmation of the stratification of cell populations were shown by Simon
et al, who found that cells within the interior of a stacked culture escaped radiotherapy in an oxygen-dependent manner.96
The ability of PBCs to mimic the tumor environment and measure cancer invasion, proliferation, metabolism, and radiosensitivity in a spatially-defined readout demonstrates the versatility of this platform. Currently, PBCs are limited to a relatively low throughput; however, efforts are being made to increase throughput to match 96-well assays.97 The accessibility of paper and simplicity in assembling these cultures make PBCs a promising platform for continued study of cancer progression.
1.4. Interrogating cellular responses in paper cultures
14
1.4.1 Enumerating viable cells
To determine whether cell populations are changing within PBCs, methods are needed that can accurately enumerate viable cells within paper scaffolds. Early approaches towards cell quantification in paper relied on cell lines engineered to constitutively express fluorescent
proteins. Fluorescent flatbed scanners were used to image entire scaffolds, and calibration curves relate the average fluorescent intensity to the total number of cells within a cell-seeded region. This method preserves cells for further analysis, and has a reported limit of quantification (LoQ) as low as 2000 cells.84 It is important to note that this technique has difficultly discriminating live and dead cells, as protein fluorescence can persist during cellular death.98
Adenosine triphosphate (ATP) bioluminescence assays (e.g., CellTiter-Glo®) provide an alternative approach towards enumerating viable cells in PBCs.96 In these assays, cells are lysed and ATP released from the cell fuels a bioluminescent reaction involving luciferase.99 The resulting luminescence is indicative of the number of metabolically active cells and can be related to cell number using calibration curves. While this approach is more selective in identifying viable cells than fluorescent protein expression, this technique requires cell lysis which prevents downstream analysis of the cells. Additionally, this technique requires ATP levels to be comparable between cell populations for an accurate analysis; however, cells experiencing hypoxia have diminished ATP levels due to changes in metabolic pathways,100 which limits these techniques accuracy for cell enumeration in stacked cultures. Another
15
Efforts to develop a cell enumeration assay independent of fluorescent protein expression and environmental oxygen led to conception of a quantitative polymerase chain-reaction (qPCR) assay.84 In this assay, DNA is extracted from cells within zones along a single paper scaffold and qPCR is used to determine the amount of genetic material present within that culture. Calibration curves are used to convert qPCR readouts to the number of cells in a scaffold. This technique has a LoQ one order of magnitude lower than fluorescent protein expression and is independent of environmental conditions; however, intact genetic material of dead cells cannot be discerned from living cells, which can lead to an overestimation of viable cells.
Discrimination between live and dead cell populations within paper scaffolds has been done via counterstaining with fluorescent molecules.89 Viable cells with intact membranes are identified using fluorescein derivatives that are metabolized by intracellular esterases (e.g., calcein AM and fluorescein diacetate). Prior to metabolization, these molecules are non-fluorescent and freely pass through the cell membrane; however, they become non-fluorescent and cell-permanent upon hydrolysis. Dead cell identification is performed using DNA intercalating dyes, such as propidium iodide or 7-aminoactinomycin D. These dyes are normally unable to pass through the cell membrane of living cells; however, membranes of dying cells are commonly compromised, allowing these dyes to intercalate into the DNA.
1.4.2 Cell-based hypoxia readouts
16
hypoxia within stacked cultures, three approaches have been used: expression of a HRE reporter gene, immunostaining for HIFs, and bioreactive hypoxia probes.
Vordermark et al. first described the use of a genetic vector to identify cells experiencing hypoxia via the production of green fluorescent protein (GFP).102 This vector, known as
5HRE/GFP, contains five HRE promotor sequences followed by a GFP reporter sequence. Under hypoxic conditions, HIFs binds to the HRE sequences and upregulate the expression of GFP for easy identification of intracellular hypoxia. Truong et al. utilized MDA-MB-231 cells transfected with the 5HRE/GFP vector to identify differences in environmental oxygen tensions for cells in stacked PBCs.50 In this work, it was found that cells further from the nutrient-rich medium exhibited increased GFP expression, and therefore experienced increasingly lower oxygen concentrations.
Accumulation of HIFs in the nucleus is indicative of cellular hypoxia and can be used to identify hypoxia within cells. In this assay, cells are fixed and stained with two dyes: a DNA intercalating dye, and a fluorescently labeled anti-HIF antibody. The DNA stain is used to identify the nucleus, and the ratio between cytosolic-localized HIF to nuclear HIF provides a relative indication of intracellular hypoxia.103 While this technique is qualitative, it has been used to identify differences in HIF localization of MDA-MB-231 cells in stacked and channel-shaped cultures.49,50
17
have shown that staining efficiency significantly increases at oxygen tensions less than 10 mmHg, which corresponds to hypoxia.107 Pimonidazole has been used in stacked PBCs to confirm that cells deeper in a stacked culture experienced reduced oxygen tensions.50
1.5. Overview of the dissertation
18 1.6 Figures
Fig 1.1 Diagram of the progression of cancer from initial development of a neoplastic cell to the growth and evolution of a TME. Interactions between cancer cells and tumor-associated
19
Fig 1.2 Design examples of microfluidic oxygen gradient generators. (A) Network mixing devices have two gas inputs and mix them together in series of split channels. The flow channels are adjacent to a bioreactor with a gas permeable membrane separating the two regions.
20
21
Fig 1.4 Overview of common techniques used to enumerate viable cells in PBCs. These
22
23
REFERENCES (1) Semenza, G. L. Physiology 2009, 24, 97–106.
(2) Semenza, G. L. Trends Pharmacol Sci. 2013, 33 (4), 207–214.
(3) Semenza, G. L. Biochim. Biophys. Acta - Mol. Cell Res. 2015, 1863 (3), doi: 10.1016/j.bbamcr.2015.05.036.
(4) Edmondson, R.; Broglie, J. J.; Adcock, A. F.; Yang, L. Assay Drug Dev. Technol. 2014,
12 (4), 207–218.
(5) Schmeichel, K. L. J. Cell Sci. 2003, 116 (12), 2377–2388.
(6) Kenny, P. A.; Lee, G. Y.; Myers, C. A.; Neve, R. M.; Semeiks, J. R.; Spellman, P. T.; Lorenz, K.; Lee, E. H.; Barcellos-Hoff, M. H.; Petersen, O. W.; Gray, J. W.; Bissell, M. J.
Mol. Oncol. 2007, 1 (1), 84–96.
(7) Hirschhaeuser, F.; Menne, H.; Dittfeld, C.; West, J.; Mueller-Klieser, W.; Kunz-Schughart, L. A. J. Biotechnol. 2010, 148 (1), 3–15.
(8) Tibbitt, M W., Anseth, K. S. Biotec 2010, 103 (4), 655–663.
(9) Sutherland, R. M.; Sordat, B.; Bamat, J.; Gabbert, H.; Bourrat, B.; Mueller-Klieser, w.
Cancer Res. 1986, 46 (October), 5320–5329.
(10) Szot, C. S.; Buchanan, C. F.; Freeman, J. W.; Rylander, M. N. 2011, 32 (31), 7905–7912. (11) Derda, R.; Laromaine, A.; Mammoto, A.; Tang, S. K. Y.; Mammoto, T.; Ingber, D. E.;
Whitesides, G. M. Proc. Natl. Acad. Sci. U. S. A. 2009, 106 (44), 18457–18462. (12) Chaffer, C.; Weinberg, R. Science (80-. ). 2011, 331 (6024), 1559–1564.
(13) Chaffer, C.; Weinberg, R. Cancer Discov. 2015, 5 (1), 22–24.
(14) Wang, M.; Zhao, J.; Zhang, L.; Wei, F.; Lian, Y.; Wu, Y.; Gong, Z.; Zhang, S.; Zhou, J.; Cao, K.; Li, X.; Xiong, W.; Li, G.; Zeng, Z.; Guo, C. J. Cancer 2017, 8 (5), 761–773. (15) Quail, D. F.; Joyce, J. A. Nat. Med. 2013, 19 (11), 1423–1437.
(16) Whitesides, T. Oncogene 2008, 27 (45), 5904–5912.
(17) Hanahan, D.; Coussens, L. M. Cancer Cell 2012, 21 (3), 309–322.
24 R. Cancer Cell 2014, 21 (1), 66–81.
(19) Folkman, J.; Watson, K.; Ingber, D.; Hanahan, D. Nature. 1989, pp 58–61.
(20) Nishida, N.; Yano, H.; Nishida, T.; Kamura, T.; Kojiro, M. Vasc. Health Risk Manag.
2006, 2 (3), 213–219.
(21) Ruffell, B.; DeNardo, D. G.; Affara, N. I.; Coussens, L. M. Cytokine Growth Factor Rev.
2010, 21 (1), 3–10.
(22) Lu, P.; Takai, K.; Weaver, V. M.; Werb, Z. Cold Spring Harb. Perspect. Biol. 2011, 3
(12), a005058.
(23) Dirat, B.; Bochet, L.; Dabek, M.; Daviaud, D.; Dauvillier, S.; Majed, B.; Wang, Y. Y.; Meulle, A.; Salles, B.; Le Gonidec, S.; Garrido, I.; Escourrou, G.; Valet, P.; Muller, C.
Cancer Res. 2011, 71 (7), 2455–2465.
(24) Erez, N.; Truitt, M.; Olson, P.; Hanahan, D. Cancer Cell 2010, 17 (2), 135–147. (25) Marusyk, A.; Polyak, K. Biochim Biophys Acta 2011, 1805 (1), 1–28.
(26) Condeelis, J.; Singer, R. H.; Segall, J. E. Annu. Rev. Cell Dev. Biol. 2005, 21 (1), 695– 718.
(27) Kelley, L. C.; Lohmer, L. L.; Hagedorn, E. J.; Sherwood, D. R. J. Cell Biol. 2014, 204 (3), 291–302.
(28) Semenza, G. L. 2011, 20 (1), 1–10.
(29) Papp-Szabó, E.; Josephy, P. D.; Coomber, B. L. Int. J. Cancer 2005, 116 (5), 679–685. (30) McKeown, S. R. Br. J. Radiol. 2014, 87 (1035), 1–12.
(31) Jubb, A. M.; Buffa, F. M.; Harris, A. L. J. Cell. Mol. Med. 2010, 14 (1–2), 18–29. (32) Kondoh, M.; Ohga, N.; Akiyama, K.; Hida, Y.; Maishi, N.; Towfik, A. M.; Inoue, N.;
Shindoh, M.; Hida, K. PLoS One 2013, 8 (11), 1–14.
(33) Lluis, J. M.; Buricchi, F.; Chiarugi, P.; Morales, A.; Fernandez-Checa, J. C. Cancer Res.
2007, 67 (15), 7368–7377.
(34) Yang, M. H.; Wu, M. Z.; Chiou, S. H.; Chen, P. M.; Chang, S. Y.; Liu, C. J.; Teng, S. C.; Wu, K. J. Nat. Cell Biol. 2008, 10 (3), 295–305.
25
(36) Wang, Q.; Zheng, Y.; Dong, L.; Ho, Y.; Guo, Z. Free Radic. Biol. Med. 2007, 42 (5), 642–653.
(37) Semenza, G. L. Annu. Rev. Cell Dev. Biol. 1999, 15 (1), 551–578.
(38) Ivan, M.; Kondo, K.; Yang, H.; Kim, W.; Valiando, J.; Ohh, M.; Salic, A.; Asara, J. M.; Lane, W. S.; Kaelin, W. G. Science (80-. ). 2001, 292 (5516), 464–468.
(39) Wenger, R. H.; Stiehl, D. P.; Camenisch, G. Sci. Signal. 2005, 2005 (306), re12-re12. (40) Liu, Y.; Cox, S.; Morita, T.; Kourembanas, S. Circ. Res. 1995, 77, 638–643.
(41) Ebert, B. L.; Firth, J. D.; Ratcliffe, P. J. J. Biol. Chem. 1995, 270 (49), 29083–29089. (42) Kaluz, S.; Kaluzová, M.; Liao, S. Y.; Lerman, M.; Stanbridge, E. J. Biochim. Biophys.
Acta - Rev. Cancer 2009, 1795 (2), 162–172.
(43) Schioppa, T.; Uranchimeg, B.; Saccani, A.; Biswas, S. K.; Doni, A.; Rapisarda, A.; Bernasconi, S.; Saccani, S.; Nebuloni, M.; Vago, L.; Mantovani, A.; Melillo, G.; Sica, A.
J. Exp. Med. 2003, 198 (9), 1391–1402.
(44) Jing, S. W.; Wang, Y. D.; Chen, L. Q.; Sang, M. X.; Zheng, M. M.; Sun, G. G.; Liu, Q.; Cheng, Y. J.; Yang, C. R. Dis. Esophagus 2013, 26 (1), 75–83.
(45) Goda, N.; Ryan, H. E.; Khadivi, B.; McNulty, W.; Rickert, R. C.; Johnson, R. S. Mol. Cell. Biol. 2003, 23 (1), 359–369.
(46) Schmid, T.; Zhou, J.; Brüne, B. J. Cell. Mol. Med. 2004, 8 (4), 423–431.
(47) Wang, Y.; Liu, J.; Ying, X.; Lin, P. C.; Zhou, B. P. Sci. Rep. 2016, 6 (April), 1–10. (48) Chang, C.-W.; Cheng, Y.-J.; Tu, M.; Chen, Y.-H.; Peng, C.-C.; Liao, W.-H.; Tung, Y.-C.
Lab Chip 2014, 14 (19), 3762–3772.
(49) Kenney, R. M.; Boyce, M. W.; Truong, A. S.; Bagnell, C. R.; Lockett, M. R. Analyst
2015, 141, 661–668.
(50) Truong, A. S.; Lockett, M. R. Analyst 2016, 3874–3882.
(51) Mosadegh, B.; Lockett, M. R.; Minn, K. T.; Simon, K. A.; Gilbert, K.; Hillier, S.; Newsome, D.; Li, H.; Hall, A. B.; Boucher, D. M.; Eustace, B. K.; Whitesides, G. M.
Biomaterials 2015, 52 (1), 262–271.
26
(53) Polinkovsky, M.; Gutierrez, E.; Levchenko, A.; Groisman, A. Lab Chip 2009, 9 (8), 1073. (54) Shiwa, T.; Uchida, H.; Tsukada, K. Am. J. Biomed. Eng. 2012, 2 (4), 175–180.
(55) Rexius-Hall, M. L.; Rehman, J.; Eddington, D. T. Integr. Biol. 2017, 9, 742–750. (56) Uchida, H.; Sato, A.; Miyayama, A.; Tsukada, K. Adv. Biomed. Eng. 2013, 2, 143–149. (57) Wang, L.; Liu, W.; Wang, Y.; Wang, J.; Tu, Q.; Liu, R.; Wang, J. Lab Chip 2013, 13 (4),
695–705.
(58) Gurski, L.; Petrelli, N.; Jia, X.; Farach-Carson, M. Oncol. Issues 2010, 25 (1), 20–25. (59) Acosta, M. a; Jiang, X.; Huang, P.-K.; Cutler, K. B.; Grant, C. S.; Walker, G. M.;
Gamcsik, M. P. Biomicrofluidics 2014, 8 (5), 54117.
(60) Funamoto, K.; Zervantonakis, I. K.; Liu, Y.; Ochs, C. J.; Kim, C.; Kamm, R. D. Lab Chip
2012, 12 (22), 4855.
(61) Grimes, D. R.; Kelly, C.; Bloch, K.; Partridge, M. J. R. Soc. Interface 2014, 11 (92), 20131124.
(62) Colom, A.; Galgoczy, R.; Almendros, I.; Xaubet, A.; Farré, R.; Alcaraz, J. J. Biomed. Mater. Res. - Part A 2014, 102 (8), 2776–2784.
(63) Evans, S. M.; Hahn, S. M.; Magarelli, D. P.; Koch, C. J. Am. J. Clin. Oncol. 2001, 24 (5), 467–472.
(64) Friedrich, J.; Seidel, C.; Ebner, R.; Kunz-Schughart, L. A. Nat. Protoc. 2009, 4 (3), 309– 324.
(65) Karlsson, H.; Fryknäs, M.; Larsson, R.; Nygren, P. Exp. Cell Res. 2012, 318 (13), 1577– 1585.
(66) Chignola, R.; Schenetti, A.; Andrighetto, G.; Chiesa, E.; Foroni, R.; Sartoris, S.; Tridente, G.; Liberati, D. Cell Prolif. 2000, 33 (4), 219–229.
(67) Zschenker, O.; Streichert, T.; Hehlgans, S.; Cordes, N. PLoS One 2012, 7 (4).
(68) Kabadi, P. K.; Vantangoli, M. M.; Rodd, A. L.; Leary, E.; Madnick, S. J.; Morgan, J. R.; Kane, A.; Boekelheide, K. Biotechniques 2016, 59 (2), 279–286.
(69) Grimes, D. R.; Fletcher, A. G.; Partridge, M. R. Soc. Open Sci. 2014, 1 (1), 140080– 140080.
27
(71) Roberts, D. L.; Williams, K. J.; Cowen, R. L.; Barathova, M.; Eustace, A. J.; Brittain-Dissont, S.; Tilby, M. J.; Pearson, D. G.; Ottley, C. J.; Stratford, I. J.; Dive, C. Br. J. Cancer 2009, 101 (8), 1290–1297.
(72) Gomes, A.; Guillaume, L.; Grimes, D. R.; Fehrenbach, J.; Lobjois, V.; Ducommun, B.
PLoS One 2016, 11 (8), 1–11.
(73) Boyce, M. W.; Kenney, R. M.; Truong, A. S.; Lockett, M. R. Anal. Bioanal. Chem. 2016,
408 (11), 2985–2992.
(74) Lesher-pérez, S. C.; Kim, G.; Kuo, C.; Leung, B. M.; Mong, S.; Kojima, T.; Moraes, C.; Thouless, M. D.; Luker, G. D.; Takayama, S. Biomater. Sci. 2017, 5, 2106–2113.
(75) Wang, X.; Wolfbeis, O. S. Chem. Soc. Rev. 2014, 43 (10), 3666–3761.
(76) Grist, S. M.; Chrostowski, L.; Cheung, K. C. Sensors (Basel). 2010, 10 (10), 9286–9316. (77) Klimant, I.; Meyer, V.; Kühl, M. Limnol. Oceanogr. 1995, 40 (6), 1159–1165.
(78) Park, E. J.; Reid, K. R.; Tang, W.; Kennedy, R. T.; Kopelman, R. J. Mater. Chem. 2005,
15 (27–28), 2913.
(79) Kocincová, A. S.; Nagl, S.; Arain, S.; Krause, C.; Borisov, S. M.; Arnold, M.; Wolfbeis, O. S. Biotechnol. Bioeng. 2008, 100 (3), 430–438.
(80) Naciri, M.; Kuystermans, D.; Al-Rubeai, M. Cytotechnology 2008, 57 (3), 245–250. (81) Itoh, T.; Yaegashi, K.; Kosaka, T.; Kinoshita, T.; Morimoto, T. Am. J. Physiol. 1994, 267
(5 Pt 2), H2068-78.
(82) Borisov, S. M.; Klimant, I. Microchim. Acta 2009, 164 (1–2), 7–15.
(83) Koo, Y. E. L.; Cao, Y.; Kopelman, R.; Koo, S. M.; Brasuel, M.; Philbert, M. A. Anal. Chem. 2004, 76 (9), 2498–2505.
(84) Truong, A. S.; Lochbaum, C. A.; Boyce, M. W.; Lockett, M. R. Anal. Chem. 2015, 87
(22), 11263–11270.
(85) Lloyd, C. C.; Boyce, M. W.; Lockett, M. R. Curr. Protoc. Chem. Biol. 2017, 9, 1–20. (86) Rodenhizer, D.; Gaude, E.; Cojocari, D.; Mahadevan, R.; Frezza, C.; Wouters, B. G.;
McGuigan, A. P. Nat. Mater. 2016, 15 (2), 227–234.
28
(88) Boyce, M. W.; LaBonia, G. J.; Hummon, A. B.; Lockett, M. R. Analyst 2017, 142 (15), 2819–2827.
(89) Derda, R.; Tang, S. K. Y.; Laromaine, A.; Mosadegh, B.; Hong, E.; Mwangi, M.; Mammoto, A.; Ingber, D. E.; Whitesides, G. M. PLoS One 2011, 6 (5).
(90) Juvonen, H.; Määttänen, A.; Laurén, P.; Ihalainen, P.; Urtti, A.; Yliperttula, M.; Peltonen, J. Acta Biomater. 2013, 9 (5), 6704–6710.
(91) Camci-Unal, G.; Newsome, D.; Eustace, B. K.; Whitesides, G. M. Adv. Healthc. Mater.
2016, 5 (6), 641–647.
(92) Kim, Y. S.; Yang, Y.; Henry, C. S. Sensors Actuators, B Chem. 2018, 255, 3654–3661. (93) Martinez, A. W.; Phillips, S. T.; Whitesides, G. M. Proc. Natl. Acad. Sci. 2008, 105 (50),
19606–19611.
(94) Kenney, R. M.; Lloyd, C. C.; Whitman, N. A.; Lockett, M. R. Chem. Commun. 2017, 53
(53), 7194–7210.
(95) Kenney, R. M.; Boyce, M. W.; Whitman, N.; Kromhout, B. P.; Lockett, M. R. 2018. (96) Simon, K. A.; Mosadegh, B.; Minn, K. T.; Lockett, M. R.; Mohammady, M. R.; Boucher,
D. M.; Hall, A. B.; Hillier, S. M.; Udagawa, T.; Eustace, B. K.; Whitesides, G. M.
Biomaterials 2016, 95, 47–59.
(97) Deiss, F.; Mazzeo, A.; Hong, E.; Ingber, D. E.; Derda, R.; Whitesides, G. M. Anal. Chem.
2013, 85, 8085–8094.
(98) Steff, A. M.; Fortin, M.; Arguin, C.; Hugo, P. Cytometry 2001, 45 (4), 237–243.
(99) Crouch, S. P. .; Kozlowski, R.; Slater, K. .; Fletcher, J. Jounal Immunol. Methods 1993,
160, 81–88.
(100) Moriyama, E. H.; Niedre, M. J.; Jarvi, M. T.; Mocanu, J. D.; Moriyama, Y.; Subarsky, P.; Li, B.; Lilge, L. D.; Wilson, B. C. Photochem. Photobiol. Sci. 2008, 7 (6), 675.
(101) Tonder, A. Van; Joubert, A. M.; Cromarty, A. D. 2015, 1–10.
(102) Vordermark, D.; Shibata, T.; Brown, J. M. Neoplasia 2001, 3 (6), 527–534. (103) Groulx, I.; Lee, S. 2002, 22 (15), 5319–5336.
29
(105) Evans, S. M.; Fraker, D.; Hahn, S. M.; Gleason, K.; Jenkins, W. T.; Jenkins, K.; Hwang, W. T.; Zhang, P.; Mick, R.; Koch, C. J. Int. J. Radiat. Oncol. Biol. Phys. 2006, 64 (3), 922–927.
(106) Raleigh, J. A.; Miller, G. G.; Franko, A. J.; Koch, C. J.; Fuciarelli, A. F.; Kelly, D. A. Br. J. Cancer 1987, 56 (4), 395–400.
(107) Gross, M.; Karbach, U.; Groebe, K.; Franko, A.; Mueller-Klieser, W. Int J Cancer 1995,
30
CHAPTER 2: QUANTIFYING OXYGEN IN PAPER-BASED CELL CULTURES WITH LUMINESCENT THIN FILM SENSORS
2.1 Introduction
Rapid cellular proliferation and the aberrant vasculature associated with solid tumors result in a microenvironment that is markedly different than surrounding tissue. Regions of low pH, increased interstitial fluid pressure, and decreased oxygen tension (i.e., hypoxia) act as selective forces that promote the development of a metastatic phenotype. 1–3 Hypoxia directly induces chemical signaling pathways through the regulation of hypoxia inducible factors. These transcription factors alter rates of cellular metabolism and proliferation, promote the metastasis of tumorigenic cells, and increase resistance to chemo- and radiation-based treatments.4–8
Two recent studies found oxygen, in addition to orchestrating transcriptional and
31
holder that limited the exchange of fresh medium into the culture and resulted in the formation of an oxygen gradient spanning the thickness of the stack.
The diffusion-limited environment formed in the 3D paper-based cultures mimic the microenvironment of a solid tumor, because gradients of nutrients, waste products, and signaling molecules result from cellular metabolism and lack of exchange with the nutrient-rich culture medium. Previous works have relied on cellular responses (e.g., viability, directed invasion, and hypoxia inducible transcripts) to confirm the presence of in situ-generated oxygen gradients.10–13 These responses allowed for relative comparisons of oxygen tension throughout the culture, but do not directly quantify the shape or steepness of the oxygen gradients in the paper-based cultures. To better correlate cellular response with the formation of oxygen gradients in paper-based cultures, there is a need for a sensor that: detects small changes in oxygen tension,
especially in the regions associated with hypoxia (0 – 10 mmHg); quickly responds to changes in oxygen tension, to provide good temporal resolution; and possesses good spatial resolution to provide an accurate picture of the gradient.
32
In this work, we prepared polystyrene thin films containing palladium tetrakis
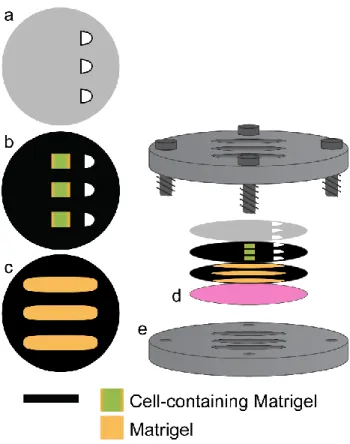
(pentafluorophenyl)porphyrin (PdTFPP) molecules, which are dynamically quenched by oxygen. We calibrated the oxygen sensing films, which had a linear response between 0 and 160 mmHg O2 and an overall sensitivity (I0/I160) of ~35. Placing the oxygen sensing film in contact with the cell-containing paper scaffolds allowed us to measure changes of oxygen tension in the culture through changes in the luminescence intensity of the film. We prepared paper-based scaffolds with 11 x 2.5 mm channels (Fig. 2.1); the scaffolds were wax patterned, providing defined hydrophilic regions that readily wick cell-laden hydrogels. We limited the free exchange between the paper-scaffolds and the culture medium to discrete locations along the channels, causing chemical gradients to form laterally along the scaffold. This format allowed us to
monitor changes in the luminescence of the oxygen sensing film with a fluorescence microscope. Placing the oxygen sensing films in contact with paper-based scaffolds containing fluorescently labeled cells allowed us to measure the spatial and temporal evolution of the oxygen gradient in the culture with respect to cell location. We used the oxygen gradient profiles obtained at
different times to estimate the cellular oxygen consumption rate of the cells in different locations of the channel.
2.2 Materials and Methods
2.2.1 Thin film preparation
33
then spin coated in a two-step process: i) 2,000 rpm for 3 sec, ii) 5,500 rpm for 2.5 sec. The thin films were placed under vacuum overnight to ensure complete removal of solvent and then sterilized by ultraviolet (UV) irradiation for 1 hr prior to usage. New thin films were prepared for each experiment. Film thickness was measured with a stylus profilometer (KLA Tencor P-6).
2.2.2 Sensor characterization
Sensors were calibrated in polydimethylsiloxane (PDMS) flow cells that were prepared by pouring a degassed mixture (10:1 ratio) of PDMS prepolymer and curing agent (Sylgard 184, Dow-Corning) into a 3D printed acrylonitrile butadiene styrene (ABS) mold. The PDMS was cured overnight at 50 ºC. The ABS mold was designed with a web-based computer assisted design application, TinkerCAD, and printed with a Makerbot® Replicator 2.
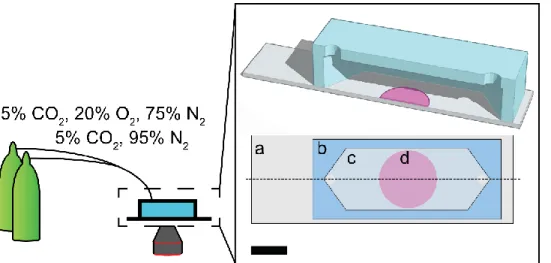
The PDMS flow cells were bonded to 75 mm glass microscope slides (Fisher Scientific) with uncured PDMS. Oxygen concentrations in the flow cell were modulated by controlling the flow rates of a two-gas mixture: balanced air with 5% CO2, and a 95% N2 with 5%CO2 gas. The complete apparatus is depicted in Fig. 2.2. A polystyrene thin film without dye was used as a blank to account for background signal arising from the experimental setup. Reported emission intensities are the average of three locations along three different sensors.
2.2.3 Cell culture
34
supplemented with 10% (v/v) fetal bovine serum and 1% (v/v) penicillin-streptomycin. M231-eGFP cells were maintained at 5% CO2 and 37 ºC, and their medium was exchanged every 48 hr. The cells were passed when the culture reached 70-80% confluency: the cells were detached from their tissue culture flask with Trypsin-EDTA (5 minutes, 37oC), washed with serum-containing medium, pelleted, and cultured in a fresh flask at the appropriate dilution. All cell culture reagents, unless otherwise stated, were acquired from Gibco, Life Technologies.
2.2.4 Paper-based scaffold preparation
Paper-based scaffolds were prepared by wax patterning sheets of Whatman 105 lens paper with a ColorQube 8570 printer (Xerox). The scaffolds were wax-patterned on both sides, cured for 15 min at 150 ºC, and then sterilized with UV light overnight. Two designs were used in this work: i) a “channel scaffold”, which contained three 11 x 2.5 mm elliptical zones, and ii) an “imprint scaffold”, which contained three 3 x 2.5 mm rectangular zones. The different paper scaffolds are portrayed in Fig. 2.1. Detailed schematics of each design are included in Fig. A2.1.
Cellulose acetate sheets (overhead transparency, Staples) were cut using a Silver Bullet® cutting machine. The sheets were autoclaved before use. Detailed schematics of the cellulose acetate sheets are provided in Fig. A2.2.
2.2.5 Sensor cytotoxicity
35
well as detailed schematics of the paper-based scaffolds, cellulose acetate sheets, and custom stainless-steel holder are provided in Fig. A2.3.
The paper-based scaffolds and cellulose acetate sheets were prepared as described in section 2.2.4. Three different glass supports were used in this assay to distinguish which component (if any) of the oxygen sensing films were cytotoxic: i) an 18 mm diameter glass coverslip; ii) an 18 mm diameter glass coverslip with a polystyrene thin film; and iii) an 18 mm diameter glass coverslip with a PdTFPP-containing polystyrene film (i.e., an oxygen sensor). Prior to seeding M231-eGFP cells into the scaffolds, the cells were detached from their culture flask and resuspended in Matrigel (Corning) at a density of 75,000 cells/µL. Cell
suspensions were stored on ice to prevent gelation during the seeding process. Five zones of the scaffold, which corresponded to the openings cut in the cellulose acetate film, were seeded with 0.5 µL of cells suspended in Matrigel. The remaining four zones were seeded with 0.5 µL of Matrigel. After seeding, the scaffolds were incubated in culture medium overnight (37oC, 5% CO2) and assembled into stacks the following day. Stacks were layered—cellulose acetate sheet (top), cell-containing paper-based scaffold, glass support (bottom)—enclosed in the custom stainless-steel holder and incubated for 24 or 48 hr in culture medium at 37 ºC in 5% CO2.
36
overnight incubation in medium. Measurements were taken across three different cell passages, with each passage including 5 replicates.
2.2.6 Cell culture with sensor integration
Prior to seeding M231-eGFP cells into paper scaffolds, the cells were detached from their culture flask and resuspended in Matrigel (Corning) at a cell density of 170,000 cells/µL. The suspensions were stored on ice to prevent gelation during the seeding process. The rectangular regions of the imprint scaffolds were seeded with 0.44 µL of cell suspension, and the channel scaffolds seeded with 1.62 µL of Matrigel. Seeded scaffolds were incubated in medium overnight, and assembled into stacks the following day. Each stack consisted of a cellulose acetate sheet (top), a cell-containing imprint scaffold, a Matrigel-containing channel scaffold, and an oxygen sensing film on a glass coverslip (bottom). The entire stack was placed in a custom-made stainless-steel holder (Fig. 2.1). Assemblies were maintained at room temperature and the reported values represent averaged values from three different channels. Detailed schematics of the stainless-steel holders are provided in Fig. A2.4.
2.2.7 Image acquisition and processing
37
12-bit camera (QIC-F-M-12-C, QImaging) with 4X (0.1 NA) objective at an exposure time of 280 ms. Images were processed with ImageJ.27
2.2.8 Statistical Analysis
All reported values are the average and standard deviation of at least 3 replicates. Data sets were analyzed with Graphpad Prism v.6.07: a two-way ANOVA with Tukey’s multiple comparison post-test was used to compare different data sets. A p-value of < 0.05 was considered significant.
2.3 Results and Discussion
2.3.1 Oxygen sensor characterization
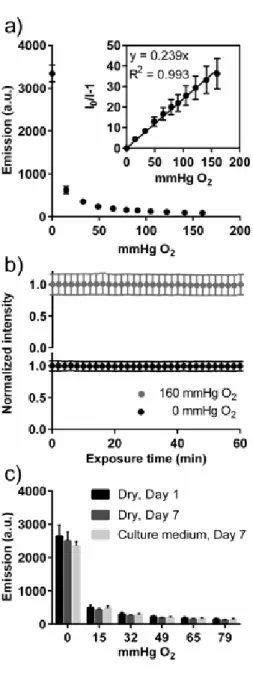
Palladium- and platinum-based metalloporphyrins have been widely used for oxygen sensing due to their commercial availability, solvent compatibility, and large Stokes shift.28–30 We chose PdTFPP to quantify oxygen tension in the paper-based cultures, because Pd(II)-based metalloporphyrins exhibit longer luminescence lifetimes than Pt(II)-based dyes, resulting in an increased sensitivity to oxygen;31 and the pentafluorophenyl molecules appended to the
38
Oxygen sensors were prepared by spin coating mixtures of PdTFPP and polystyrene dissolved in toluene onto of 18-mm round glass coverslips. The resulting films (3.61 ± 0.07 μm thick) were ideal for our application because they were easily incorporated into our culture setup (Fig. 2.1). Oxygen can rapidly diffuse through these thin films, decreasing the response time of the film by decreasing the time needed for the film to equilibrate with the apposing environment. Response times were measured to be on the order of ~15 secs to fully equilibrate. Glass
coverslips were used as a support substrate for the polystyrene thin films for three reasons: i) they provide rigidity to the sensor; ii) they are impermeable to oxygen and medium, which prevents oxygen diffusion into the assembled culture and maintains gradients formed within the scaffolds; and iii) they are optically transparent and compatible with fluorescence microscopy, allowing us to measure both the luminescence intensity of the oxygen sensing film and
fluorescence intensity of the M231-eGFP cells in the paper-based scaffolds.
To calibrate the sensor’s response to different oxygen tensions, we placed the sensors in the gas flow apparatus depicted in Fig. 2.2. The relationship between oxygen tension and luminescence intensity was determined with a Stern-Volmer relationship, modeled by the equation:
0
2
1 sv[ ]
I
K O
I Eq[2.1]
I0 and I represent the emission intensity of the film in the absence and presence of oxygen, respectively; KSV is the Stern-Volmer constant relating emission intensity to oxygen
concentration. We measured the luminescence intensity of the film from 0 to 160 mmHg, and derived a Ksv = 0.239 ± 0.003 mmHg O2-1 from the Stern-Volmer plot (Fig. 2.3A). The
39
intensities of the oxygen sensing films increased with increasing oxygen tension. This trend is expected, as emission intensity is non-linearly related to oxygen tension and significant quenching at higher oxygen tensions lead to diminished differences in signal. While this
variation in intensity limits our ability to differentiate oxygen tensions at high concentrations, the sensors provide a linear response across oxygen tensions used for cell culture, and is particularly sensitive to small changes in oxygen tension near hypoxic conditions (i.e., values < 10 mmHg).
To ensure cell culture conditions did not affect the responsiveness of the oxygen sensing films, we incubated the sensor for 7 days in a flow cell containing medium collected from an overly confluent culture flask. This setup emulated the nutrient-exhausted environment seen in static, diffusion-limited cultures. After 7 days, the luminescence intensity of the films in oxygen tensions ranging from 0 to 79 mmHg was measured. No significant difference in emission intensity was observed for films incubated in culture medium and films maintained in dry conditions (Fig. 2.3B). Furthermore, there was no significant difference between emission intensities of sensors measured prior to and after 7 days of incubation in cell medium. These results indicate a number of observations: i) the gas-phase Stern-Volmer calibration is suitable for quantifying oxygen tensions in liquids; ii) the sensors are stable in culture medium for at least one week, and iii) relative to oxygen, soluble components of the culture medium do not impact sensor response.
40
these sensors are photostable. These results agree with a previous study done with PtTFPP in polystyrene, which found these films were stable after 50 hr of continuous illumination.28
2.3.2 Sensor cytotoxicity
To ensure that the sensors were compatible with cell culture, we seeded M231-eGFP cells in paper scaffolds; placed them in contact with a glass coverslip, a glass coverslip with a
polystyrene thin film, or a glass coverslip with a PdTFPP-containing polystyrene thin film (i.e., an oxygen sensing film); and cultured the cells for 24 or 48 hr. The experimental setup is provided in Fig. A2.3a. After incubation, the devices were disassembled and fluorescence intensities of the seeded zones measured with a fluorescence flatbed scanner. Others have demonstrated that the emission intensity of fluorescently labeled cells seeded in paper scaffolds is directly related to total number of cells present,12 and decreases in green fluorescent protein (GFP) emission can be used to monitor cell death.36
No significant difference in fluorescence intensity was observed for cells cultured in the presence of the glass, polystyrene, or the PdTFPP-containing polystyrene substrates after 24 or 48 hr of culture (Fig. 2.4). The fluorescence intensity of each zone, prior to and post-culture, were also not significantly different. These results suggest the oxygen sensing films are not cytotoxic over the duration of our experiments.
2.3.3 Oxygen tension in channel culture
41
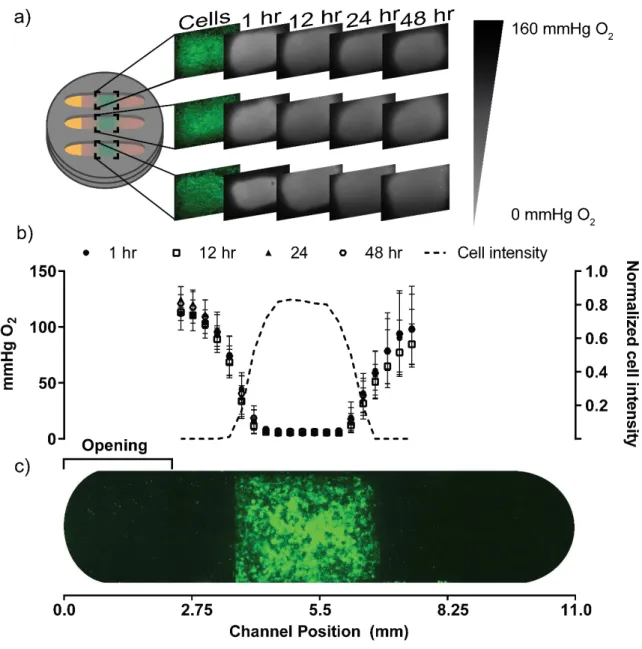
stainless-steel holder. The cellulose acetate sheet and the glass coverslip are both impermeable to oxygen and liquids; these materials allowed us to spatially limit nutrient and waste exchange between the culture and culture medium to one end of the channel. Each imprint scaffold provided a rectangular region in which we could reproducibly seed cells and place them in the same position along the channel. The Matrigel-filled channels provided a path for nutrients and waste to diffuse along the enclosed stack. In this arrangement, the cell-seeded imprint region at the center of the channel should act as an oxygen sink, and cause an oxygen gradient to form across the length of the channel from source (opening in the cellulose acetate sheet) to sink.
The assembled devices were incubated for 48 hr, and images of the M231-eGFP cells and the oxygen-sensing films were obtained with an inverted fluorescence microscope. The captured images provided a 2D landscape of oxygen tension across the cell-seeded imprint region. To reduce the 2D images into a one-dimensional dataset, we used ImageJ to generate “column average plot profiles”. The readout of these profiles is the average intensities of all y-pixels per x-pixel in a selected region of interest (ROI). We chose an ROI (4.6 x 1.5 mm) that spanned the width of the channel, and maintained the size and location of the ROI between images.