Full Terms & Conditions of access and use can be found at
https://www.tandfonline.com/action/journalInformation?journalCode=hlaq20
Language Assessment Quarterly
ISSN: 1543-4303 (Print) 1543-4311 (Online) Journal homepage: https://www.tandfonline.com/loi/hlaq20
Fluency in Second Language Testing: Insights From
Different Disciplines
Nivja H. De Jong
To cite this article: Nivja H. De Jong (2018) Fluency in Second Language Testing: Insights From Different Disciplines, Language Assessment Quarterly, 15:3, 237-254, DOI: 10.1080/15434303.2018.1477780
To link to this article: https://doi.org/10.1080/15434303.2018.1477780
Published with license by Taylor & Francis Group, LLC © 2018 Nivja H. De Jong.
Published online: 06 Jun 2018.
Submit your article to this journal
Article views: 3263
View Crossmark data
Fluency in Second Language Testing: Insights From Different
Disciplines
Nivja H. De Jong
Leiden Graduate School of Teaching, Leiden University and Leiden University Centre for Linguistics, Leiden University, Leiden, Netherlands
ABSTRACT
This article considers the construct of fluency in second language assessment and how it might be informed by research in applied linguistics. It briefly describes the way fluency is conceptualized in four language tests, as embodied in their respective assessment criteria, to show where the field is at present. The article then takes into account recent insights from applied linguistics, and from the fields of psycholinguistics, discourse analysis, and sociolinguistics. The article questions the current conceptualization of fluency in language testing, in which it is defined as a concept that should be sought in the ear of the beholder, and where disfluency is only seen as a deficit. Future research should focus on finding ways to ensure that the measures used in testing reflect the ability to talk fluently and efficiently, rather than measures that only reflect listeners’impressions about such ability, and to show that these can be marked appropriately and reliably.
Introduction
This article considers the construct of fluency. While laypeople use the word as a synonym for overall oral proficiency (e.g., Chambers,1997; Luoma,2004), in the field of second language assessment it is seen as one component of oral proficiency, complemented by others, such as the accuracy and complexity of the linguistic forms that speakers use (Housen & Kuiken, 2009). Lennon (1990) has termed these two definitions as the broad and narrow sense of fluency, respectively.
The narrow sense has, in itself, also been defined in different ways. For instance, Lennon (1990) defines the narrow sense of fluency as the“impression on the listener’s part that the psycholinguistic processes of speech planning and speech production are functioning easily and efficiently”(p. 391). On the other hand, Fillmore (1979, p. 51) describes the narrow sense of fluency as“the ability to talk at length with few pauses, the ability to fill time with talk.”Similarly, Lennon (2000, p. 26) defines the narrow sense of fluency as the“rapid, smooth, accurate, lucid, and efficient translation of thought or communicative intention under the temporal constraints of on-line processing.”
The discrepancies between these definitions come from the viewpoint taken: Lennon (1990) takes the viewpoint of the listener (and his impression of the ease of speech production by the speaker), whereas Fillmore (1979) and Lennon (2000) describe the viewpoint of the speaker (with the speaker’s actual ease or trouble in speech production processes). Segalowitz (2010, p. 165) captures these viewpoints, distinguishing between cognitive fluency—“the efficiency of operation of the underlying processes responsible for the production of utterances” and perceived fluency—“the inferences listeners make about speakers’cognitive fluency based on their perceptions.”(In addition, he describes a third aspect, utterance fluency, as“the features of utterances that reflect the speakers cognitive fluency,”which can be acoustically measured.) Similarly, Luoma (2004, p. 88) also acknowledges the different viewpoints when
CONTACTNivja H. De Jong [email protected] Leiden Graduate School of Teaching, P.O. Box 905, 2300 AX Leiden, The Netherlands.
Published with license by Taylor & Francis Group, LLC © 2018 Nivja H. De Jong.
This is an Open Access article distributed under the terms of the Creative Commons Attribution-NonCommercial-NoDerivatives License (http:// creativecommons.org/licenses/by-nc-nd/4.0/), which permits non-commercial re-use, distribution, and reproduction in any medium, provided the original work is properly cited, and is not altered, transformed, or built upon in any way.
describing the temporal characteristics of fluency; the characteristics“[. . .] are not simply descriptions of a speaker’s speech but also of a listener’s perception of it.”
In this article I consider how second language assessment practice might be informed by considering research on fluency in other areas of applied linguistics. First, I briefly review how fluency is described and reflected in the assessment criteria of four current tests, to show where the field is at present. I then review the research on fluency in different disciplines—applied linguistics, psycholinguistics, conversation analysis, and sociolinguistics—and sketch out each discipline’s implications for language testing practice. Because space limitations make it impossible to be exhaustive, most of the review will be on “applied linguistics,” a term used for studies from the field of second language acquisition that have potential applications for language testing in mind. Hopefully, by focusing on such studies, combined with those from the other fields, the review will provide language testers new insight into the assessment of fluency.
Current practice in language testing
Fluency has been a criterion since the early days of second language speaking assessment (Fulcher,
2003). The College Board’s English Competence Examination (1930) was the first test to include a speaking section and one of the criteria was “fluency.” The importance of fluency in assessing speaking is not difficult to understand: to be able to communicate successfully, one needs to translate intended messages into comprehensible speech fast. In subsequent speaking tests, fluency has always recurred in scoring rubrics.
In what follows1 I briefly describe the role of fluency in the published speaking rubrics of four current tests of English, which represent different approaches to language testing: the Test of English as a Foreign Language internet Based Test (TOEFL iBT), the International English Language Testing System Academic (IELTS), the oral proficiency interview of the American Council on the Teaching of Foreign Languages (ACTFL OPI), and the Pearson Test of English Academic (PTEA). While fluency is determined in no small part by the speaking task, I focus here on the assessment criteria because, as Weigle (2002) notes, they represent the theoretical basis on which the tests are founded and thereby the embodiment of a test’s construct. The role of the task in speaking assessment is considered more fully elsewhere in this special issue by Galaczi and Taylor (this issue).
On the independent speaking tasks of the computer-delivered TOEFL iBT (Educational Testing Service, 2004), judges consider the combined impact of delivery, language use, and topic develop-ment. Fluency is mentioned in the“Language Use”and“Delivery”descriptors. For instance, under “Language Use”at score 4, it is stated that“The response demonstrates effective use of grammar and vocabulary. It exhibits a fairly high degree of automaticity.”Under the category“Delivery,”most of the descriptions mention“pace,”but not disfluencies. At the lowest level, however, there is mention of“frequent pauses and hesitations.”
In IELTS (IELTS, n.d.), which uses a face-to-face speaking test format, the descriptors for “Fluency and Coherence” mention length of the performance, pauses, hesitations, repetitions, and self-correction, but there is hardly any mention of“speed,”except at band 5 (“uses repetition, self-correction and/or slow speech”). The term“pausing”is mentioned exclusively at the lower levels; at the higher levels,“hesitations,”in combination with repetitions and self-repairs, are mentioned.
Five main levels of the American Council on the Teaching of Foreign Languages (ACTFL) (2013) OPI describe speaking proficiency from“Distinguished”to “Novice.” The descriptors differentiate levels by functional can-do statements, but there is also mention of aspects of coherence, grammar, vocabulary, pronunciation, and fluency. In a separate glossary, fluency itself is defined as follows: “the flow in spoken or written language as perceived by the listener or reader. Flow is made possible by clarity of expression, the acceptable ordering of ideas, use of vocabulary and syntax appropriate to
1This section on the way fluency is assessed in four current language tests is a slightly altered version of a section that appears in
the context.” At most levels there is specific mention of fluency, referring to unnaturally lengthy hesitations, pauses, reformulations, and self-corrections.
In the PTEA (Pearson Education Ltd, 2017), which is scored automatically, speaking is assessed through read aloud, sentence repeat, image description, and lecture retell tasks. The construct of fluency therefore includes reading ability for those items where participants are asked to read aloud, and it also explicitly includes (working) memory, for items asking participants to repeat or to retell. Bernstein, Van Moere, and Cheng (2010) describe the scoring procedure for the Versant Spanish Test (the main procedures for the PTEA are the same). The aspects of speech that are considered for the fluency score are all from duration of speech events: response latency (i.e., duration of silent pauses before beginning the response), speech rate, articulation rate, pauses between words, and a combination of these. A training set is used to construct a formula for the fluency scores that reflect human judgments on fluency. While this formula has not been disclosed, the rubrics that were used to validate the scores have been published (Pearson Education Ltd,2017, pp. 24–5) and therefore partly reveal the formula used for the automatic scores. The human raters in this case referred to rubrics that were specific for fluency, discriminating between six levels. The rating scales in these rubrics tend to be precise, including information about rhythm, length of runs, and about frequency of hesitations, such as pauses, repetitions, and repairs. For instance, at level 2, it reads“Speech may be uneven or staccato. Speech (if≥6 words) has at least one smooth three-word run, and no more than two or three hesitations, repetitions or false starts. There may be one long pause, but not two or more.”
On the basis of the rubrics, it can be seen that the role of fluency within these four tests of English differs widely. Fluency is seen as a separate construct (PTEA); as a construct that goes hand in hand with pronunciation, on the one hand, and with complexity and accuracy, on the other (TOEFL iBT); as a construct that cannot be seen separately from coherence (IELTS); or as a construct that is part of the integral construct of language ability (ACTFL OPI). In the speaking rubrics of IELTS, TOEFL iBT, and ACTFL OPI, there is no mention of pauses at the higher levels. With the exception of PTEA, where fluency is objectively calculated by an algorithm, the descriptions in the scales that relate to fluency leave room for subjective interpretation of fluency. For instance, in TOEFL iBT level 4, Delivery is described as“fluid.”In addition, the notions of“well-paced”(TOEFL iBT) and“unnaturally lengthy” hesitations (ACTFL OPI) can be interpreted in different ways, and there is no indication on how the rater should know whether production occurred automatically or not (TOEFL iBT), or whether hesitations are either language- or content-related (IELTS). In the PTEA, obviously, the measurements of fluency by the algorithm are objective and precise. Likewise, the rubrics used to validate the algorithm are stated in an objective and precise manner. This means that the human judges are encouraged to tally features like pauses and count mean length of runs in number of words. High correlations between the ratings and the scores obtained by the algorithm, based on the same features, may therefore come as no surprise.
Research on fluency in different disciplines
The basis for most of the rating scales just described is not empirical (Fulcher,1996). However, there is (by now) ample research investigating (aspects and origins of) fluency. This article focuses on the research from within the field of applied linguistics but will also briefly show how findings from psycholinguistics, discourse analysis, and sociolinguistics may aid language testing practice to conceptualize fluency. The insights from the different disciplines can potentially aid language testing researchers to focus their research and perhaps eventually help testing agencies to improve their rubrics.
Applied linguistics
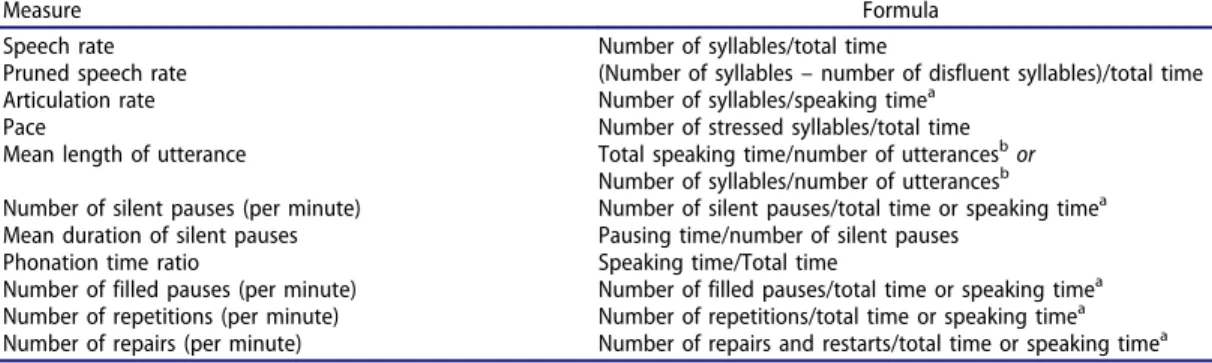
measures of a speaker’s utterance fluency tell us about his or her L2 speaking proficiency?”Below, this research is reviewed and it can be seen that the bulk of this research has concentrated on relating objective measures of utterance fluency to subjective ratings of perceived fluency. In these studies, then, fluency is a construct to be defined from the viewpoint of the listener. Fewer studies have related objective measures of fluency to overall (oral) proficiency or have tracked gains within speakers over time. Even fewer studies have attempted to investigate fluency as approached from the viewpoint of the speaker by exploring the relation between objective measures of utterance fluency to measures of (or measures related to) cognitive fluency. In all studies, objective measures of utterance fluency are measured from the speech stream.Table 1shows 11 such objective measures that have been most commonly used in research on fluency, together with the ways in which they can be calculated.
The earlier studies (e.g., Lennon, 1990; Riggenbach, 1991) sampled fewer speakers or speech performances (four and six) than the more recent studies (e.g., Bosker, Pinget, Quené, Sanders, & De Jong, 2013; Kahng, 2014; Révész, Ekiert, & Torgersen, 2016, 114, 46, and 80 participants, respec-tively). The obvious reason for this change is that the very time-consuming measuring of objective fluency, which had to be done by hand, has been helped along by technological advances. For instance, there are now ways to calculate measures, such as speech rate and silent pauses, auto-matically, without the need to carry out an orthographic transcription (De Jong & Wempe, 2009; Dekens, Martens, Van Nuffelen, De Bodt, & Verhelst,2014; Little, Oehmen, Dunn, Hird, & Kirsner,
2013). Even when researchers base their measures on manual transcripts and manual measures of pauses (e.g., Kahng,2014; Révész et al.,2016), technological advances have made it easier to measure pauses and syllables (semi-)automatically. In the three subsections below the research relating objective measures of fluency to subjective ratings of fluency is discussed, followed by a discussion of the research relating objective measures of fluency to overall oral proficiency (or to gains in fluency), and finally the studies that have delved into cognitive fluency.
Relating objective measures of utterance fluency to subjective ratings
Riggenbach (1991), as a representative of the earlier studies, sampled relatively few speakers to investigate the relation between objective measures of fluency and subjective ratings on fluency. Nevertheless, this study set the stage for later studies with similar methodologies, at least in terms of theorizing about fluency and its measures. Riggenbach (1991) compared three nonnative speakers who were judged to be“highly fluent”with three nonnative speakers who were judged to be“highly Table 1.Frequently Used Measures of Utterance Fluency2.
Measure Formula
Speech rate Number of syllables/total time
Pruned speech rate (Number of syllables–number of disfluent syllables)/total time Articulation rate Number of syllables/speaking timea
Pace Number of stressed syllables/total time Mean length of utterance Total speaking time/number of utterancesbor
Number of syllables/number of utterancesb
Number of silent pauses (per minute) Number of silent pauses/total time or speaking timea Mean duration of silent pauses Pausing time/number of silent pauses
Phonation time ratio Speaking time/Total time
Number of filled pauses (per minute) Number of filled pauses/total time or speaking timea
Number of repetitions (per minute) Number of repetitions/total time or speaking timea Number of repairs (per minute) Number of repairs and restarts/total time or speaking timea aSpeaking time is equal to total time minus silent pausing time.
b
Number of utterances is equal to the number of silent pausesplus1.
2
nonfluent.”The objective features that she compared can still be found in fluency research: measures of filled and unfilled pauses, measures of speed, and measures of repairs. The highly fluent speakers (as attested by judges) were found to speak faster, with fewer pauses, than those who were judged to be highly nonfluent. Objective measures of speech rate and pausing (measured in different ways) have, in later studies, always come up as significant predictors of perceived fluency (e.g., Cucchiarini, Strik, & Boves,2002; Derwing, Rossiter, Munro, & Thomson,2004; Kormos & Dénes,2004; Rossiter,
2009). Riggenbach (1991) also included interaction phenomena, such as those involved in turn-taking, an aspect of fluency that is often ignored in this type of research (and is also left out of
Table 1above). A notable exception is Fulcher (1996), who developed a fluency rating scale based on L2 production data. Eight categories were distinguished as possible explanations for learners to pause (e.g., end-of-turn pauses, grammatical planning hesitation, and expressing propositional uncer-tainty). Taken together, the frequencies of these eight types of pauses statistically predicted judged fluency.
The studies that have reported on therelativecontribution of the objective measures to explain variance in the ratings should be interpreted with caution, because they have often ignored the problem of multicollinearity. For example, Kormos and Dénes (2004) looked at measures of utterance fluency, as well as other measures, such as accuracy and lexical diversity. The correlation between perceived fluency and accuracy led them to conclude that accuracy“overrides the effect of temporal factors on listeners” (p. 160). However, by using their detailed data reports, one can do additional analyses. The Variance Inflation Factors (VIFs) that were calculated from these analyses (between 3.4 and 36.7) indicate that multicollinearity in this data set was indeed a problem. Moreover, additional regression analyses show that after the temporal measures “mean length of runs” and “number of stressed words per minute” are added to the model, no other temporal measure would account for additional variance to the statistical model, and a total of 86% of the (mean) fluency scores can already be explained (adjusted R2 = 0.86). Subsequently, adding the accuracy measure didnotlead to a statistically improved statistical model (p= .7). In other words, because of the multicollinearity, it is impossible to gauge unique explained variance of all predictor variables.
Another example is the study by Derwing et al. (2004), who reported that after pruned speech rate is added to the model, pausing did not significantly add to the explained variance of fluency ratings. Because the measure pruned speech rate includes information about pausing,3 this finding is not surprising and not meaningful. Perhaps the only justifiable conclusions that could be drawn are those from studies that report bivariate correlations that werenotstatistically significant.
However, summarizing the studies that have related objective measures of utterance fluency to a measure of perceived fluency, we can conclude that all objective measures have been identified as significant predictors of perceived fluency, including measures of repairs (Bosker et al., 2013; Préfontaine,2013) and articulation rate (Bosker et al.,2013). But as the additional analyses on the data from Kormos and Dénes (2004) have shown, because of multicollinearity, any of these reported relations may in fact have been spurious relations.
3
Speech rate is a mathematical combination of the speed measure articulation rate plus the breakdown measures number and duration of silent pauses. Mean length of utterance, if it is measured as the mean length of uninterrupted speech (in seconds) between silent pauses, is almost equivalent to the measure number of pauses per minute. If mean length of utterance is measured as the mean number of syllables between silent pauses, then it becomes a measure that combines articulation rate with several silent pauses per minute: the faster the speech, the more syllables in any stretch of speech and the fewer pauses, the longer these stretches of speech become. The following three formulae show these mathematical relations formally: (1) Speech rate = ((total duration–number of pauses*mean length of pauses) * articulation rate) / total duration
(2) Mean length of utterance (in seconds) = (total duration–number of pauses*mean length of pauses) / (number of pauses + 1) (3) Mean length of utterance (in syllables) = MLUseconds * articulation rate
Bosker et al. (2013) have tried to circumvent the problem by choosing variables that are, in theory and in practice, not too highly interrelated. They purposefully did not include the most often used measures speech rate and mean length of utterance, because these measures are (mathematically) highly related to the other measures. But if the aim is to find out which objective measures of fluency explain fluency perception, their approach still does not offer a sound solution. Their study could show that the measures of breakdown fluency (reflecting the amount of pausing in speech), speed fluency (reflecting the speed of speech), and repair fluency (reflecting the amount of repairs and repetitions in speech) together were significantly better at predicting perceived fluency than any other more parsimonious model. However, correlation does not equal causation. It may be that yet another variable (maybe accuracy, lexical diversity, or maybe even some aspect that constitutes voice attractiveness) is related to some or all of the measures of fluency that they tested. For this reason, in a subsequent study, Bosker, Quené, Sanders, and Jong (2014b) used an experimental setup: they manipulated speech for different aspects of fluency and then collected ratings. By manipulating the speech on only one measure of fluency, all other potential confounding factors are held constant, and differences in the resulting ratings across conditions can confidently be attributed to the fluency differences between the conditions. The results of this experimental study showed that number of pauses, duration of pauses, as well as speed of speech affected fluency perception.
Future research can, in a similar experimental vein, test whether there is a direct relation between perceived fluency and repair measures or any other measure apparent in the speech signal (accuracy, complexity, pitch, etc.). Eventually, one would be able to disentangle the relative weights of potential aspects of speech that are contributing to perceived fluency. Such research, however, can still not answer the question which aspects of speech are underlying the smooth and rapid translation of thoughts into speech.
Segalowitz (2010) has pointed out the distinctions between utterance fluency, perceived fluency, and cognitive fluency. Utterance fluency can be measured (with more ease as technology advances) and perceived fluency can be gathered from ratings. Relating utterance fluency to perceived fluency will hopefully, in the end, reveal the aspects of fluency that are perceptually salient and the aspects of (fluency in) the speech signal listeners deem important. Aspects of fluency most salient to raters were tested in Bosker et al. (2013). In three separate rating experiments, different raters were assigned to either rate on breakdown, speed, or repair fluency. They found that the ratings on breakdown fluency could best be related to the objective measures of breakdown fluency (70% explained variance) and that the ratings on speed and repair fluency were less related to their measures of utterance fluency (53% and 54% explained variance, respectively). However, there is no assurance that aspects that are salient and deemed important are also telling of the ability to speak fluently or the ability to effectively translate thoughts to speech. A number of studies, using a variety of research methods, have considered this issue and are described below.
Relating objective measures of fluency to proficiency and research on fluency gains
Correlational studies have also been carried out to relate overall speaking proficiency to measures of utterance fluency. In these studies, measures of fluency were found to relate to holistic ratings of proficiency to a moderate to strong degree (Ginther, Dimova, & Yang, 2010; Iwashita, Brown, Mcnamara, & O’Hagan, 2008; Kahng,2014; Kang, Rubin, & Pickering,2010; Révész et al., 2016). However, in these studies it can be argued that—as with the studies relating perceived fluency to measures of utterance fluency—the results are revealing what is salient to raters and what they deem important, when rating on overall speaking proficiency. This is especially the case when (as in Iwashita et al.,2008) the rubrics of speaking proficiency actually contained aspects of fluency. What is apparent in the descriptors is likely to emerge as a significant predictor (if it is perceptually salient and deemed important). In Kahng’s (2014) study, however, the descriptors did not entail any mention of fluency. Similar to the findings in which she compared L1 to L2 speech, she found that the L2 holistic scores were related to pausing within AS-units (but not to pause duration or pauses at AS-boundaries). She also found significant relations between the scores and (inverse) articulation rate and mean length of run. Similarly, Révész et al. (2016) related measures of utterance fluency to ratings of communicative success (rather than to overall proficiency, which usually entails mention of fluency). In their study the number of filled pauses turned out to be the best predictor, and a measure of speed fluency was second best. Thus, the results of Kahng (2014) and Révész et al. (2016) show that even when raters are not specifically instructed to focus on fluency, measures of pausing and measures of speed of speech are predictive of the overall proficiency ratings.
Another way of investigating measures of utterance fluency that relate to proficiency is by looking at speakers’gainsin utterance fluency. If we assume that learners become more proficient in the L2 over time, then the gains in objective utterance fluency that can be observed must reflect the gain in underlying cognitive fluency. In this method of research, Lennon (1990) has set the stage. In 21 weeks apart, four speakers gained in speech rate and produced fewer filled pauses and fewer silent pauses. His findings have been replicated by more recent studies using larger samples. For instance, Towell, Hawkins, and Bazergui (1996) and Towell (2002) followed 12 learners of French over a period of three years. They found gains in fluency for mean length of run and speaking rate, but not for mean duration of silent pause. O’Brien, Segalowitz, Freed, and Collentine (2007) investigated gain in fluency for 43 learners of Spanish. After a semester studying abroad, significant gain was found in speech rate, mean length of run without fillers, but not in mean length of run without silent pauses. These results replicated the results of Segalowitz and Freed (2004).
The issue of multicollinearity that was mentioned before can also obfuscate research findings on measures that do or do not progress within learners over time. If researchers report progress in (pruned) speech rate, it is unclear whether speed of speech (articulation rate), number of silent pauses, duration of silent pauses, and number of disfluencies have all shown gains or whether it is only a subset of these measures. Obviously, manipulating measures experimentally within this line of research (as was the proposed solution for the research investigating the relation between objective measures of fluency and perceived fluency) is not possible. Taken together, one can conclude that notwithstanding issues with multicollinearity, the research presented thus far clearly shows that objective measures of fluency are related to (gains in) proficiency, as well as to ratings of fluency and proficiency. In other words, temporal aspects of fluency can indeed be seen as indicators of proficiency.
Relating objective measures of fluency to cognitive fluency
knowledge (e.g., vocabulary, grammar, pronunciation) and processing skills (e.g., speed of morpho-syntactic processing, lexical selection, articulation) that theoretically underlie L2 speaking proficiency. For 179 participants they measured knowledge and skills separately from the speaking performances that were used to gauge measures of utterance fluency. In their case the speaking performances for measuring fluency were eight short role plays, elicited by instructions given on a computer screen. Results showed that the fluency measure articulation rate could best be predicted by the combined linguistic knowledge and skills, with 50% of the variance explained. The fluency measure mean pause duration, on the other hand, showed the weakest relation to the measures of linguistic knowledge and skills (only 5% explained variance). Finally, Kahng (2014) grappled with the elusive construct of cognitive fluency by using stimulated recall. She used two computer-elicited oral tasks (eliciting speech on familiar topics) and showed that lower-proficient speakers tended to hesitate more because of problems during formulation, whereas the higher-proficient speakers verbalized more aboutconceptual difficultiesupon remembering their reasons to hesitate.
Another way to investigate the relation between utterance fluency and cognitive fluency is to examine the aspects of L2 utterance fluency within speakers that are related to their L1 fluency behavior. If it turns out that a speaker’s measure of L2 fluency can to a large degree be predicted from the same measure in the L1, this measure is telling of personal speaking style rather than of L2-specific cognitive fluency. As Derwing, Munro, Thomson, and Rossiter (2009) put it, a“close relationship between a speaker’s L1 and L2 temporal characteristics would suggest that fluency is governed by an underlying trait.”They found that for both Slavic and Mandarin beginner learners of English, measures of fluency are strongly related between their L1 and L2. For the Slavic learners, the relations for speech rate and pauses per second remained strong at later times. Towell and Dewaele (2005) likewise showed strong relations between L1 and L2 fluency for 12 L2 speakers of French (L1 English). But neither of these studies disentangled measures of breakdown and speed fluency. De Jong, Groenhout, Schoonen, and Hulstijn (2015) investigated the relation between L1 English and L1 Turkish to L2 Dutch measures of fluency (n= 51). Like Bosker et al. (2013), they tried to avoid the problem of multicollinearity by choosing measures that are—mathematically and theoretically—unrelated to potentially distinguish measures that do from those that do not share overlap between L1 and L2. They found that for all measures, significant relations were found, but although L2 (inverse) articulation rate was only moderately related to L1 articulation rate (r = 0.37), many measures of pausing showed very high overlap in the L1 and in the L2: for mean duration of pauses between AS-units, the relation was strong: r= 0.76. In concordance with Towell et al. (1996) and De Jong et al. (2015), these results indicate that mean duration of pauses is a measure that reflects personal speaking style (overlapping with L1 speaking style) rather than L2-specific cognitive fluency. Using a subset of these tasks, De Jong and Mora (2017) replicated the findings of De Jong et al. (2015) and showed strong correlations between measures of L1 and L2 fluency (betweenr= 0.67 and r = 0.77). Also Bradlow, Kim, and Blasingame (2017), using read aloud and picture stories as elicitation tasks, showed that for 11 different L1 backgrounds, L1 speaking rates (either articulation rate or speech rate) were predictive of L2 speaking rates.
Implications for language testing
integrating reading and pictures as input (Bosker et al.,2013; De Jong et al., 2013, 2015). It would appear, therefore, that there is substantial similarity between the tasks used in applied linguistics research and in second language speaking assessment, suggesting that insights from the former might inform practice in the latter.
To summarize the research within applied linguistics, one can state that we know a lot about how human raters judge fluency. Depending on the (amount and precision of) instructions they get, raters are able to focus on aspects of fluency, such as speed of speech and pauses. Explained variance of the fluency ratings can be as high as 84–86% (Bosker et al.,2013; the re-analysis of the findings of Kormos & Dénes, 2004), which shows that ratings are indeed related to all aspects of fluency apparent in the definition given (Bosker et al., 2013). However, the results from the studies investigating gains in fluency, as well as those attempting to relate objective fluency measures to measures of cognitive fluency, indicate that not all measures of fluency that raters use in their evaluation are indeed related to underlying cognitive fluency (e.g., mean duration of pauses, see De Jong et al.,2013,2015; Towell et al.,1996).
Language testing criteria should therefore, where possible, incorporate this knowledge. Having raters (or algorithms in automatic scoring) distinguish between long and short pauses in a test of L2 speaking proficiency will be less valid than having raters pay attention to the location of pauses for syntactic boundaries (De Jong,2016b; Kahng,2014; Riazantseva,2001; Skehan & Foster,2007; Tavakoli,2011). Finally, the overlap between fluency behavior of speakers in their L1 and their L2 (Bradlow et al.,2017; De Jong et al.,2015; Derwing et al.,2009; Towell & Dewaele,2005) calls for prudence when using“raw” measures of L2 fluency: part of the variance measured will be caused by underlying traits that come from differences in speaking styles that are apparent between L1 speakers as well. Of course, adding individual baselines to correct measurement or subjective ratings of L2 utterance cannot be a solution, at least not for high-stakes standardized tests. Besides practical issues, such individual baselines will arguably render the assessments less fair. For now, at least, language assessment practitioners need to realize that within the construct of L2 speaking, L1 fluency behavior is a mediating factor.
Psycholinguistics
Language testing practice may also learn from psycholinguistic studies that have investigated why and when L1 speakers are disfluent, and how listeners process disfluencies while listening to L1 speech. Psycholinguistic models, such as those by Levelt, Roelofs, and Meyer (1999) and Dell, Schwartz, Martin, Saffran, and Gagnon (1997), describe the speaking process in three main stages: a speaker first conceptualizes a message, then formulates this message linguistically by selecting the appropriate words and building grammatically correct sentences, and finally moves the appropriate muscles to articulate the sounds. Although current models of speech production disagree on which processes in speech production may run in parallel and which may interact, they do agree on these general stages in speech production. To communicate successfully, a speaker needs to efficiently carry out these processes at each of these stages of speech production. In addition, speakers monitor their own speech while speaking.
choices are available (Hartsuiker & Notebaert,2010). In addition, speakers are more likely to be disfluent before naming discourse-new referents than referents that are mentioned recently and are therefore more accessible (Arnold, Wasow, Losongco, & Ginstrom,2000).
Traditionally, in psycholinguistic views, disfluencies were seen as aspects of speech without added value for the listener, which listeners therefore“edit out”to understand the actual message of the speaker (Levelt, 1989). Clark and Fox Tree (2002), however, argue that the filled pauses “uh” and“uhm”are conventional English words (interjections) that speakers use to indicate that they are searching for a word or deciding what to say next. In this view, hesitations are not problems but solutions to problems (Clark, 2002, p. 12). Although hesitations do not add to the propositional content of the speaker (the primary message), they are part of the collateral message, in which the speaker is informing the listener about his performance (Clark, 2002). By using a filled pause, the speaker shows (s)he has not finished speaking and wants to keep the floor. Evidence corroborating this argument comes from Oviatt (1995), who showed that there are more filled pauses in human-human communication than when people are talking to a computer. Moreover, Clark and Fox Tree (2002) argue that filled pauses must be planned, like any other word. For instance, in English, when the filled pause “uhm” follows the definite article “the,” this definite article is oftentimes lengthened to “thee” (“Thee uhm . . .”). Likewise, filled pauses are cliticized to previous words (“and uh”is pronounced as“an-duh”), which shows the filled pause must be planned even before the previous word (“thee” or “and”) is articulated. Corley and Stewart (2008), on the other hand, argue that hesitations are largely unintentional and may simply be by-products of the speaking process.
Irrespective of whether hesitations are at some level intentional, there is growing evidence that listeners benefit from hesitations. In this research, evidence from response times, eye-tracking, as well as ERP recordings in controlled listening experiments, has shown that listeners use information carried by disfluencies. Summarizing such research, listeners raise their attention upon hearing disfluencies (Collard, Corley, MacGregor, & Donaldson,2008) and subsequently anticipate complex syntax (Brennan & Schober, 2001; Fox Tree, 2001), low-probable words (Corley, Macgregor, & Donaldson,2007), discourse-new rather than given referents (Arnold, Fagnano, & Tanenhaus,2003; Barr & Seyfeddinipur, 2010), unknown rather than known referents (Arnold, Hudson Kam, & Tanenhaus, 2007; Kidd, White, & Aslin, 2011), and low-frequency rather than high-frequency words (Bosker, Quené, Sanders, & De Jong,2014a).
In sum, when speakers experience trouble in planning and producing speech, because the message is complex in some way, they are more likely to be disfluent. The disfluencies of speakers can therefore be said to follow predictable patterns, and listeners are sensitive to such patterns, whether accidental or intentional.
In addition to complex speech resulting in disfluent speech, speakers constantly monitor their speech to check whether what they say matches their intention. Therefore, speakers may encounter discrepancies between what they wanted to say and what they actually (are about to) say. When this happens, speakers can use repair strategies to mend their error. Such repair strategies involve halting the current (erroneous) utterance, followed by formulating the repair. Because the speaker can notice an error even before it has been articulated, this means that the error may never be uttered because speech is suspended before it reaches the planned error (Levelt, 1983). It is likely, however, that because of such covert repairs, the speaker will be disfluent. For instance, an utterance, such as“Go to the . . . left,”may be the result of planned speech“Go to the right,”which is repaired without the error (“right”) ever being uttered. For overt repairs, speakers are likely to use editing terms (e.g.,“uh” or“no”) and restarts (“Go to the right . . . uh no to the left”) to repair their error.
Implications for language testing
From the field of psycholinguistics, language testers may learn that normal L1 speech is riddled with pauses and disfluencies (Fox Tree,1995). Therefore, rubrics that at present make no mention of pauses or hesitations at higher levels of proficiency should be reconsidered. At higher levels of proficiency, pauses and hesitations will still occur (as in native speech). Rubrics may also be made more precise. Now, there is mention of“unnatural hesitations,”but it may be unclear to the rater how to differentiate between natural and unnatural hesitations. In current rubrics, this has already been partly defined. For instance, in the ACTFL OPI, describing speakers at the advanced high level, it reads“when called on to perform the complex tasks associated with the Superior level over a variety of topics, their language will at times break down.”In the TOEFL iBT, for speakers at level 2 (out of 4), it reads that“only basic sentence structures are used successfully and spoken with fluidity.” Similarly, level 5 (out of 9) of IELTS:“produces simple speech fluently, but more complex communication causes fluency problems,” and at level 9“any hesitation is content-related rather than to find words or grammar.”
Research from psycholinguistics can help in further defining the distinction between natural and unnatural pauses: hesitations in native speech are predictable in that they occur before complex speech (e.g., low-frequency words). The hesitations that are unpredictable could be seen as the “unnatural pauses”: for instance, when speakers are describing something conceptually easy and occurring before high-frequency and high-probable words. In addition, language testers should realize that“natural”(or predictable) disfluencies do not pose a problem for the listener. On the contrary, listeners are helped in their speech comprehension process by predicting upcoming difficult or complex speech upon hearing a disfluency. So, where applied linguists have always shown the negative effects of disfluencies on evaluations of speaking skills, psycholinguistic research points to the positive effects of disfluencies on comprehension, which is not captured by current scoring criteria.
Discourse analysis
In the field of communication studies and discourse analysis, scholars have analyzed everyday conversation to find recurring patterns in interaction, by using some techniques drawn from Conversation Analysis. From such research, the role of articulation rate, pauses, hesitations, repeti-tions, and repairs in social interaction is obvious. Instead of looking for cognitive causes and effects of disfluencies as psycholinguists do, researchers using conversation analysis will point out their social interactional function (see also Clark’s work described above).
From this research it has turned out that for turn-taking regulation, silences between turns tend to be very short: Wilson and Wilson (2005) report that in seven 9-minute dialogues, 70% of the inter-turn silences were less than 500 msec. In informal talk (long) silences between turns even become embarrassing (Jefferson,1989; Sacks, Schegloff, & Jefferson,1974). When speakers pause in the middle of an utterance, this may function as a controlling mechanism to keep the floor precisely because in between turns, pauses serve as signals to give the floor to the interlocutor. Filled pauses are“turn-holding devices.”At the beginning of turns, a speaker may use a filled pause (as well as a repetition, Clark & Wasow,1998) to ensure he has the floor before speaking (Schegloff, 2010).
In addition to turn-taking regulation, hesitations have been found to occur at the beginning of dispreferred responses in adjacency pairs (Schegloff & Sacks,1973). For instance, the first part of an adjacency pair may be an invitation (“Do you want to go to the movies tonight?”), and the preferred response would be an acceptance (e.g.,“Yes, I’d love to!”) and rejection (e.g.,“No, I’m too busy.”) the dispreferred response. Although preferred responses tend to be uttered without delay, dispreferred responses tend to be uttered with a delay, often including hesitations and hedges (“[.] Uhm, no, I’m rather busy.”) (Pomerantz,1984; Schegloff,2007).
Recent research has shown that the mechanisms found in mostly English conversations hold cross-linguistically and can be seen as universals (Dingemanse et al.,2015; Stivers et al.,2009). This does not imply, however, that learners at all levels of proficiency are able to use the mechanisms with the same efficiency as native speakers do, as research on development of interactional competence has shown (e.g., Cekaite, 2007; Doehler & Berger, 2016; Farina, Pochon-Berger, & Pekarek Doehler, 2012). Research in the field of applied linguistics taking in the knowledge from conversation analysis has already emerged and has emphasized the interactional aspect of fluency in dialogue, which is described by McCarthy (2010) as “confluence” (p. 7). This interactional aspect posits that participants in a dialogue share the responsibility of maintaining fluency across turns and therefore entails how fluency is displayed in collaboration. For instance, Galaczi (2014) and Peltonen (2017) both show that more proficient L2 speakers have fewer pauses between turns than less proficient L2 speakers.
Implications for language testing
Summing up, disfluencies are not only signals for the listener for upcoming complex speech (as pointed out by research in psycholinguistics) but also function as interactional devices to regulate turn-taking, to hold the floor, and to strategically repair errors (Kormos,1999). Therefore, rubrics of tests that use actual conversation need to incorporate aspects of interactional fluency. Disfluencies in conversation are often solutions to problems rather than problems themselves and should be evaluated appropriately. From the tests described above, this may be especially relevant for IELTS and for the ACTFL OPI, in which a dialogue (in the form of an interview) is used.4
Sociolinguistics
Sociolinguists have acknowledged that how you say something may at times be as important as what you say (Brennan & Williams,1995). Various lines of research within sociolinguistics have investigated how individuals differ in speaking style and the effects this may have. Individual speaking style may be the result of several speaker characteristics (Holtgraves,2001, p. 65), such as age (Bortfeld et al.,2001), gender (Bortfeld et al.,2001; Branigan, Lickley, & McKelvie,1999), dialect, socioeconomic status (e.g., Erickson, Lind, Johnson, & O’Barr,1978), and personality (e.g., Ramsay,1968). Speakers differ in several ways: for instance, accent, vocabulary use, intonation, or speech rate. These differences in speaking styles have been found to influence the way these speakers are perceived and judged (e.g., Hosman & Siltanen,2011). Lakoff (1973), for example, proposed that specific ways of speaking (e.g., using tag questions and specific intonation) might contribute to women’s lack of power in society. Later studies have suggested that such by then dubbed“powerless”language may be related to socioeconomic status and profession (often coinciding with gender). The linguistic markers usually pointed out as being markers of powerless speech are hesitations, hedges, and tag questions (e.g., Erickson et al.,1978).
The studies investigating the effect of linguistic markers of power(lessness) on listeners have usually manipulated text or speech and subsequently asked participants to judge these texts or speeches on several variables. These variables included the“impression”that a witness in a courtroom may leave on the listener, attitude toward the message, perception of the speaker, and persuasion (Blankenship & Holtgraves,2005; Erickson et al.,1978; Smith, Siltanen, & Hosman,1998). To summarize, such research (see Hosman,2015, for an overview) shows that speakers using powerless language are evaluated as less competent, less intelligent, less attractive, less trustworthy, and less certain than speakers using powerful language and that the attitude toward the messages from such speakers are less favorable.
Although neither psycholinguists nor applied linguists have ever considered hedges and tag questions to be markers of disfluency, the hesitations in powerless speech obviously overlap with breakdown
4In interviews in testing situations, however, interviewers usually allow for longer silences than is normal in natural conversation.
fluency. As a matter of fact, hesitations in such sociolinguistic studies are usually counted by identifying filled pauses (“uh”’s). A few studies have even zoomed in on the unique effects of hesitations/filled pauses instead of collapsing over the effects of hedges, hesitations, and tag questions together. Blankenship and Holtgraves (2005), for instance, showed that when students were evaluating a message advocating comprehensive exams at university, the use of hesitations led to lower evaluations of the speaker and the message. Smith et al. (1998) showed that the effect of hesitations (in this case both filled and silent pauses) interacted with educational level of the speaker. When participants were asked about the culpability of the speaker (as read from transcripts of a testimony in court on paper) from speakers with a high level of education, pauses had a negative effect, whereas in the same manipulation from speakers that were presented as having a lower level of education, no such negative effect of hesitations was found. In a similar type of research manipulating speech, Brennan and Williams (1995) showed that the duration of hesitations in answers is related to how certain listeners perceive the speaker to be.
Another line of research within sociolinguistics has focused on mimicry in conversation. The interactive-alignment account (Giles, Coupland, & Coupland, 1991) predicts that interlocutors will mimic or align their speech, at several levels, to become socially approved, as well as to increase similarity between the speaker and his or her interlocutor. Such alignment is of course related to the aforementioned notion of“confluence,”and research has indeed shown that convergence in speech occurs for speech rate (Street,1984; Wilson & Wilson,2005), pausing frequency, and pausing length (Jaffe & Feldstein,1970), as well as inter-turn interval duration (Ten Bosch, Oostdijk, & De Ruiter,
2004). In addition to aligning for fluency aspects or other aspects of sound, interlocutors align for grammar and words to achieve mutual understanding (see Pickering & Garrod,2004).
Implications for language testing
The insights from research in sociolinguistics are more likely to be relevant to tests that use a face-to-face interactional format. To validly assess fluency of L2 speakers, raters can be made aware that their perception of the speakers’ fluency should not be confounded with their perception of the speakers’competence, intelligence, attractiveness, trustworthiness, or certainty.
The alignment of imitation of speakers in a conversation is also an obvious challenge for testing fluency ability in dialogues. Being successful in conversation involves mimicking your interlocutor at many levels of verbal and nonverbal behavior (Pickering & Garrod,2004). If your interlocutor speaks with long pauses between turns, so will you (Ten Bosch et al.,2004), or if your interlocutor speaks with a slow speech rate, so will you (e.g., Street,1984). For language testing, this means that if each learner in a specific test speaks to one interlocutor only, this interlocutor should behave as constantly as possible across test takers. A better (but virtually impossible) solution would be to involve several interlocutors with which each test taker interacts. Yet another solution would be possible when using computer-administered tests, in which test takers take part in several prerecorded and therefore standardized short conversations. Evidently, future research needs to solve the tension between ecologically valid assessment on the one hand and fair and reliable assessment on the other (see Galaczi & Taylor,this issue, for a thorough discussion on this topic).
Another lesson from the sociolinguistic research described above is that, in addition to the beneficial effects of disfluencies as signals to the listener of upcoming complex speech and as interactional devices in conversation, disfluencies can be perceived as indicators of “powerless” language. This means that speakers who use many hesitations are perceived to be less powerful, less convincing, and less intelligent than speakers with fewer hesitations.
hand, may come about because of difficulties in conceptualization. Whether the conceptualization phase of a speaker poses a problem should be of no concern when judging L2 oral proficiency, in contrast to potential problems during the formulation phase. The IELTS descriptors already capture some of this in distinguishing between hesitations due to content and due to language. This can perhaps be further formalized or added to rubrics of other tests (or when using automated scoring): disfluencies at syntactic boundaries are mostly related to conceptualizing and can therefore be weighed less than disfluencies within clauses or phrases, especially those that are followed by relatively complex linguistic features or concepts. The extent to which raters are indeed capable of using such distinctions, however, should be examined by future research.
Conclusion
When considering the construct of fluency, both language tests and applied linguistics research has focused on the viewpoint of the listener. Even in the test that uses automatic (objective) measures of fluency discussed here (PTEA), the calculation of the fluency score is calculated so that it will mimic human ratings. The research reviewed in this article, however, points out a potential problem with having the viewpoint of the listener as the sole determinant of fluency, because not all disfluencies are caused by having problems in the formulation and articulation of L2 speech. To summarize, (a) fluency behavior is in part dependent on personal speaking style, (b) disfluencies are not only signals of trouble in formulating but are also helpful signals for the listener, and (c) some disfluencies are part of communicatively effective speech. It is as yet unclear to what extent raters are capable of distinguishing between different types of disfluencies. Future research should investigate this issue further to ensure that L2 speakers only be penalized on those disfluencies that are due to lack of L2 proficiency and that hamper successful communication. Before such research has been carried out, however, current language tests should benefit from the research reviewed in this article.
Taken together, the current research in applied linguistics, psycholinguistics, discourse analysis, and sociolinguistics may help make oral language tests more valid, in particular if they lead to a more sophisticated manner of conceptualizing disfluencies, not merely as a deficit, but at times as a device that serves particular communicative functions. From psycholinguistic research, we can conclude that we should change current rubrics to include“natural”hesitations at the higher levels of proficiency and to add more precise definitions of“unnatural”and“natural”hesitations. Natural (or predictable) filled and silent pauses can be defined as pauses at syntactic boundaries and/or before probable and low-frequency words. From recent applied linguistic research, we know that some measures of L2 fluency are foremost telling of personal speaking style (e.g., duration of pauses) and not so much of L2-specific abilities. Articulation rate (or its inverse average syllable duration) seems to be a measure of fluency that best reflects L2-specific fluency. To improve L2 assessments and tests to better reflect L2-specific abilities, this can be reflected in rubrics of language tests. If raters are gauging fluency, the rubrics should emphasize speed of speech over duration of hesitations. One of the lessons from sociolinguistics is that when dialogues are used in testing, rubrics and raters must acknowledge the mechanisms of alignment, as much as possible.
the future, the testing of speaking and the evaluation of fluency will be a complex endeavor, an interaction between test taker and task, scorer and scoring criteria.
Acknowledgments
I thank all reviewers for the valuable comments on previous versions of this article. I especially thank the special issue editor Gad Lim for his great help in finalizing the article.
ORCID
Nivja H. De Jong http://orcid.org/0000-0002-3680-3820
References
American Council on the Teaching of Foreign Languages (ACTFL). (2013). The ACTFL proficiency guidelines
2012 - Speaking. Retrieved March 28, 2018, from https://www.actfl.org/sites/default/files/pdfs/public/
ACTFLProficiencyGuidelines2012_FINAL.pdf
Arnold, J. E., Fagnano, M., & Tanenhaus, M. K. (2003). Disfluences signal theee, um, new information. Journal of
Psycholinguistic Research,32(1), 25–36. doi:10.1023/A:1021980931292
Arnold, J. E., Hudson Kam, C. L., & Tanenhaus, M. K. (2007). If you say thee uh you are describing something hard: The on-line attribution of disfluency during reference comprehension. Journal of Experimental Psychology:
Learning, Memory and Cognition,33(5), 914.
Arnold, J. E., Wasow, T., Losongco, A., & Ginstrom, R. (2000). Heaviness vs. newness: The effects of structural complexity and discourse status on constituent ordering.Language,76(1), 28–55. doi:10.1353/lan.2000.0045 Barr, D. J., & Seyfeddinipur, M. (2010). The role of fillers in listener attributions for speaker disfluency.Language and
Cognitive Processes,25(4), 441–455. doi:10.1080/01690960903047122
Beattie, G. W., & Butterworth, B. L. (1979). Contextual probability and word frequency as determinants of pauses and errors in spontaneous speech.Language and Speech,22(3), 201–211. doi:10.1177/002383097902200301
Bernstein, J., Van Moere, A., & Cheng, J. (2010). Validating automated speaking tests.Language Testing,27(3), 355–377. doi:10.1177/0265532210364404
Blankenship, K. L., & Holtgraves, T. (2005). The role of different markers of linguistic powerlessness in persuasion.
Journal of Language and Social Psychology,24(1), 3–24. doi:10.1177/0261927X04273034
Bortfeld, H., Leon, S. D., Bloom, J. E., Schober, M. F., & Brennan, S. E. (2001). Disfluency rates in conversation: Effects of age, relationship, topic, role, and gender.Language and Speech,44(2), 123–147. doi:10.1177/00238309010440020101 Bosker, H. R., Pinget, A., Quené, H., Sanders, T., & De Jong, N. H. (2013). What makes speech sound fluent? The
contributions of pauses, speed and repairs.Language Testing,30(2), 159–175. doi:10.1177/0265532212455394 Bosker, H. R., Quené, H., Sanders, T., & De Jong, N. H. (2014a). Native ‘um’s elicit prediction of low-frequency
referents, but non-native‘um’s do not.Journal of Memory and Language,75, 104–116. doi:10.1016/j.jml.2014.05.004 Bosker, H. R., Quené, H., Sanders, T., & Jong, N. H. (2014b). The perception of fluency in native and nonnative
speech.Language Learning,64(3), 579–614. doi:10.1111/lang.2014.64.issue-3
Bradlow, A. R., Kim, M., & Blasingame, M. (2017). Language-independent talker-specificity in first-language and second-language speech production by bilingual talkers: L1 speaking rate predicts L2 speaking rate.The Journal of
the Acoustical Society of America,141(2), 886–899. doi:10.1121/1.4976044
Branigan, H., Lickley, R., & McKelvie, D. (1999).Non-linguistic influences on rates of disfluency in spontaneous speech. Paper presented at the Proceedings of the 14th International Conference of Phonetic Sciences (pp. 387–390). Brennan, S. E., & Schober, M. F. (2001). How listeners compensate for disfluencies in spontaneous speech.Journal of
Memory and Language,44(2), 274–296. doi:10.1006/jmla.2000.2753
Brennan, S. E., & Williams, M. (1995). The feeling of another’s knowing: Prosody and filled pauses as cues to listeners about the metacognitive state of speakers. Journal of Memory and Language, 34(3), 383–398. doi:10.1006/ jmla.1995.1017
Broos, W. P., Duyck, W., & Hartsuiker, R. J. (2016). Verbal self-monitoring in the second Language.Language
Learning,66(S2), 132–154. doi:10.1111/lang.12189
Cekaite, A. (2007). A child’s development of interactional competence in a Swedish L2 classroom. The Modern
Language Journal,91(1), 45–62. doi:10.1111/modl.2007.91.issue-1
Chambers, F. (1997). What do we mean by fluency?System,25(4), 535–544. doi:10.1016/S0346-251X(97)00046-8 Clark, H. H. (2002). Speaking in time.Speech Communication,36(1), 5–14. doi:10.1016/S0167-6393(01)00022-X Clark, H. H., & Fox Tree, J. E. (2002). Using uh and um in spontaneous speaking. Cognition, 84(1), 73–111.
Clark, H. H., & Wasow, T. (1998). Repeating words in spontaneous speech. Cognitive Psychology, 37, 201–242. doi:10.1006/cogp.1998.0693
Collard, P., Corley, M., MacGregor, L. J., & Donaldson, D. I. (2008). Attention orienting effects of hesitations in speech: Evidence from ERPs.Journal of Experimental Psychology: Learning, Memory, and Cognition,34(3), 696. Corley, M., Macgregor, L. J., & Donaldson, D. I. (2007). It’s the way that you, er, say it: Hesitations in speech affect
language comprehension.Cognition,105(3), 658–668. doi:10.1016/j.cognition.2006.10.010
Corley, M., & Stewart, O. W. (2008). Hesitation disfluencies in spontaneous speech: The meaning of um.Language and
Linguistics Compass,2(4), 589–602. doi:10.1111/lnco.2008.2.issue-4
Cucchiarini, C., Strik, H., & Boves, L. (2002). Quantitative assessment of second language learners’ fluency: Comparisons between read and spontaneous speech. The Journal of the Acoustical Society of America, 111(6), 2862–2873. doi:10.1121/1.1471894
De Jong, N. H. (2016a). Fluency in second language assessment. In D. Tsagari & J. Banerjee (Eds.),Handbook of second
language assessment(pp. 203–218). Boston/Berlin, Massachusetts/Germany: Mouton de Gruyter.
De Jong, N. H. (2016b). Predicting pauses in L1 and L2 speech: The effects of utterance boundaries and word frequency.Iral,54(2), 113–132. doi:10.1515/iral-2016-9993
De Jong, N. H., Groenhout, R., Schoonen, R., & Hulstijn, J. H. (2015). Second language fluency: Speaking style or proficiency? Correcting measures of second language fluency for first language behavior.Applied Psycholinguistics,
36(2), 223–243. doi:10.1017/S0142716413000210
De Jong, N. H., & Mora, J. (2017). Does having good articulatory skills lead to more fluent speech in first and second languages?Studies in Second Language Acquisition, 1–13. doi:10.1017/S0272263117000389
De Jong, N. H., Steinel, M. P., Florijn, A., Schoonen, R., & Hulstijn, J. H. (2013). Linguistic skills and speaking fluency in a second language.Applied Psycholinguistics,34(5), 893–916. doi:10.1017/S0142716412000069
De Jong, N. H., & Wempe, T. (2009). Praat script to detect syllable nuclei and measure speech rate automatically.
Behavior Research Methods,41(2), 385–390. doi:10.3758/BRM.41.2.385
Dekens, T., Martens, H., Van Nuffelen, G., De Bodt, M., & Verhelst, W. (2014).Speech rate determination by vowel
detection on the modulated energy envelope. Paper presented at the Signal Processing Conference (EUSIPCO), 2013
Proceedings of the 22nd European (1252–1256).
Dell, G. S., Schwartz, M. F., Martin, N., Saffran, E. M., & Gagnon, D. A. (1997). Lexical access in aphasic and nonaphasic speakers.Psychological Review,104(4), 801. doi:10.1037/0033-295X.104.4.801
Derwing, T. M., Munro, M. J., Thomson, R. I., & Rossiter, M. J. (2009). The relationship between L1 fluency and L2 fluency development.Studies in Second Language Acquisition,31(4), 533–557. doi:10.1017/S0272263109990015 Derwing, T. M., Rossiter, M. J., Munro, M. J., & Thomson, R. I. (2004). Second language fluency: Judgments on
different tasks.Language Learning,54(4), 655–680. doi:10.1111/j.1467-9922.2004.00282.x
Dingemanse, M., Roberts, S. G., Baranova, J., Blythe, J., Drew, P., Floyd, S., & Rossi, G. (2015). Universal principles in the repair of communication problems.PloS One,10(9), e0136100. doi:10.1371/journal.pone.0136100
Doehler, S. P., & Berger, E. (2016). L2 interactional competence as increased ability for context-sensitive conduct: A longitudinal study of story-openings.Applied Linguistics. doi:10.1093/applin/amw021
Educational Testing Service.2004.iBT/Next generation TOEFL Test. Speaking rubrics. Retrieved March 28, 2018, from http://www.ets.org/Media/Tests/TOEFL/pdf/Speaking_Rubrics.pdf
Erickson, B., Lind, E. A., Johnson, B. C., & O’Barr, W. M. (1978). Speech style and impression formation in a court setting: The effects of“powerful”and“powerless”speech.Journal of Experimental Social Psychology,14(3), 266–279. doi:10.1016/0022-1031(78)90015-X
Farina, C., Pochon-Berger, E., & Pekarek Doehler, S. (2012). Le développement de la compétence d’interaction: Une étude sur le travail lexical.Revue Tranel,57, 101–119.
Fillmore, C. J. (1979). On Fluency. In C. J. Fillmore, D. Kempler, & W. S. Wang (Eds.),Individual differences in
language ability and language behavior(pp. 85–101). New York, NY: Academic Press.
Fox Tree, J. E. (1995). The effects of false starts and repetitions on the processing of subsequent words in spontaneous speech.Journal of Memory and Language,34, 709–738. doi:10.1006/jmla.1995.1032
Fox Tree, J. E. (2001). Listeners’uses of um and uh in speech comprehension.Memory and Cognition,29(2), 320–326. doi:10.3758/BF03194926
Fulcher, G. (1996). Does thick description lead to smart tests? A data-based approach to rating scale construction.
Language Testing,13(2), 208–238. doi:10.1177/026553229601300205
Fulcher, G. (2003).Testing second language speaking. Harlow, North Dakota: Pearson Education.
Galaczi, E., & Taylor, L. (this issue). Interactional competence: Conceptualisations, operationalisations, and outstanding questions.Language Assessment Quarterly.
Galaczi, E. D. (2014). Interactional competence across proficiency levels: How do learners manage interaction in paired speaking tests?Applied Linguistics,35(5), 553–574. doi:10.1093/applin/amt017
Giles, H., Coupland, N., & Coupland, J. (1991). Accommodation theory: Communication, context, and consequences. In H. Giles, J. Coupland, & N. Coupland (Eds.),Contexts of accommodation: Developments in applied sociolinguistics
Ginther, A., Dimova, S., & Yang, R. (2010). Conceptual and empirical relationships between temporal measures of fluency and oral English proficiency with implications for automated scoring.Language Testing,27(3), 379–399. doi:10.1177/0265532210364407
Goldman-Eisler, F. (1968).Psycholinguistics: Experiments in spontaneous speech. New York, NY: Academic Press. Hartsuiker, R. J., & Notebaert, L. (2010). Lexical access problems lead to disfluencies in speech. Experimental
Psychology,57(3), 169–177. doi:10.1027/1618-3169/a000021
Holtgraves, T. M. (2001). Language as social action: Social psychology and language use. Mahwah, NJ: Lawrence Erlbaum.
Hosman, L. (2015). Powerful and powerless speech styles and their relationship to perceived dominance and control. In R. Schulze, & H. Pishwa (Eds.),The exercise of power in communication(pp. 221–232). London, UK: Palgrave Macmillan.
Hosman, L. A., & Siltanen, S. A. (2011). Hedges, tag questions, message processing, and persuasion. Journal of
Language and Social Psychology,30(3), 341–349. doi:10.1177/0261927X11407169
Housen, A., & Kuiken, F. (2009). Complexity, accuracy, and fluency in second language acquisition. Applied
Linguistics,30(4), 461–473. doi:10.1093/applin/amp048
IELTS. (n.d.).IELTS Speaking band descriptors. Retrieved March 28, 2018, fromhttps://www.ielts.org/-/media/pdfs/ speaking-band-descriptors.ashx?la=en
Iwashita, N., Brown, A., Mcnamara, T., & O’Hagan, S. (2008). Assessed levels of second language speaking proficiency: How distinct?Applied Linguistics,29(1), 24–49. doi:10.1093/applin/amm017
Jaffe, J., & Feldstein, S. (1970).Rhythms of dialogue. New York, NY: Academic Press.
Jefferson, G. (1989). Preliminary notes on a possible metric which provides for a ‘standard maximum’ silence of approximately one second in conversation. In D. Roger & P. Bull (Eds.), Conversation: An interdisciplinary
perspective(pp. 166–196). Clevedon, UK: Multilingual Matters.
Kahng, J. (2014). Exploring utterance and cognitive fluency of L1 and L2 English speakers: Temporal measures and stimulated recall.Language Learning,64(4), 809–854. doi:10.1111/lang.2014.64.issue-4
Kang, O., Rubin, D., & Pickering, L. (2010). Suprasegmental measures of accentedness and judgments of language learner proficiency in oral English.The Modern Language Journal,94(4), 554–566. doi:10.1111/modl.2010.94.issue-4 Kempen, G., & Hoenkamp, E. (1987). An incremental procedural grammar for sentence formulation. Cognitive
Science,11, 201–258. doi:10.1207/s15516709cog1102_5
Kidd, C., White, K. S., & Aslin, R. N. (2011). Toddlers use speech disfluencies to predict speakers’ referential intentions.Developmental Science,14(4), 925–934. doi:10.1111/desc.2011.14.issue-4
Kormos, J. (1999). Simulating conversations in oral-proficiency assessment: A conversation analysis of role plays and non-scripted interviews in language exams.Language Testing,16(2), 163–188. doi:10.1177/026553229901600203 Kormos, J. (2006).Speech production and second language acquisition. Mahwah, NJ: Lawrence Erlbaum.
Kormos, J., & Dénes, M. (2004). Exploring measures and perceptions of fluency in the speech of second language learners.System,32(2), 145–164. doi:10.1016/j.system.2004.01.001
Lakoff, R. (1973). Language and woman’s place.Language in Society,2(1), 45–80. doi:10.1017/S0047404500000051 Lennon, P. (1990). Investigating fluency in EFL: A quantitative approach.Language Learning,3, 387–417. doi:10.1111/
j.1467-1770.1990.tb00669.x
Lennon, P. (2000). The lexical element in spoken second language fluency. In H. Riggenbach (Ed.),Perspectives on
fluency(pp. 25–42). Ann Arbor, Michigan: The University of Michigan Press.
Levelt, W. J. M. (1983). Monitoring and self-repair in speech.Cognition,14(1), 41–104. doi:10.1016/0010-0277(83) 90026-4
Levelt, W. J. M. (1989).Speaking: From intention to articulation. Cambridge, Mass.: MIT Press.
Levelt, W. J. M., Roelofs, A., & Meyer, A. S. (1999). A theory of lexical access in speech production.Behavioral and
Brain Sciences,22(1), 1–37. doi:10.1017/S0140525X99001776
Litman, D., Strik, H., & Lim, G. S. (this issue). Speech technologies and the assessment of second language speaking: Approaches, challenges, and opportunities.Language Assessment Quarterly.
Little, D. R., Oehmen, R., Dunn, J., Hird, K., & Kirsner, K. (2013). Fluency profiling system: An automated system for analyzing the temporal properties of speech.Behavior Research Methods,45(1), 191–202. doi: 10.3758/s13428-012-0222-0
Luoma, S. (2004).Assessing speaking. Cambridge, UK: Cambridge University Press.
Maclay, H., & Osgood, C. E. (1959). Hesitation phenomena in spontaneous English speech. Word, 15, 19–44. doi:10.1080/00437956.1959.11659682
McCarthy, M. (2010). Spoken fluency revisited.English Profile Journal,1, 1–15. doi:10.1017/S2041536210000012 Merlo, S., & Mansur, L. L. (2004). Descriptive discourse: Topic familiarity and disfluencies.Journal of Communication
Disorders,37(6), 489–503. doi:10.1016/j.jcomdis.2004.03.002
O’Brien, I., Segalowitz, N., Freed, B., & Collentine, J. (2007). Phonological memory predicts second language oral fluency gains in adults.Studies in Second Language Acquisition,29(4), 557–582.
Oviatt, S. (1995). Predicting spoken disfluencies during human–Computer interaction.Computer Speech & Language,