CAPTURING, ANALYZING AND COLLECTING ADHERENT CELLS USING MICROARRAY TECHNOLOGIES
Philip Charles Gach
A dissertation submitted to the faculty of the University of North Carolina at Chapel Hill in partial fulfillment of the requirements for the degree of Doctor of Philosophy in the Department of Chemistry
Chapel Hill 2012
Approved by:
Nancy L. Allbritton
Royce W. Murray
Steven A. Soper
Richard Superfine
iii ABSTRACT
PHILIP C. GACH: Capturing, Analyzing and Collecting Adherent Cells Using Microarray Technologies
(Under the direction of Nancy L. Allbritton)
Effective separation of a particular cell of interest from a heterogeneous cell
population is crucial to many areas of biomedical research including microscopy, clinical
diagnostics and stem cell studies. Examples of such studies include the analysis of single
cells, isolation of transfected cells and cell transformation studies. Biological
technologies can have skewed results if cells outside of the type of interest are present.
Additionally, in many instances the targeted cells are of low abundance with respect to
the heterogeneous population. For these reasons, it is important to have a technique
capable of identifying the desired cells, separating these cells from unwanted cells and
collecting the marked cells for further analysis.
Two biotools, referred to as micropallets and microrafts, have recently been
introduced for sorting adherent cells. These devices comprise arrays of microelements
weakly attached to a substrate. Following culture of adherent cells on the elements,
individual microstructures are selectively detached from the array while still carrying the
cells. These technologies have shown success in sorting single cells from small
heterogeneous cell populations with high post sorting viabilities. However, previous
device designs employed gravity-based collection methods and small microelement
iv
In this dissertation new approaches are described for capturing, examining and
isolating individual cells by micropallet and microraft technologies. Initially a new
approach was developed to isolate released microstructures from the array employing
magnetism. Microstructures were embedded with uniformly dispersed magnetic
nanoparticles which allowed collection by an external magnet immediately following
release. Application of a magnetic field permitted microstructure collection with high
yield, precision and purity. This improved collection efficiency enabled isolation of very
rare cell types. Large arrays constituting over 106 micropallets were developed along with imaging analysis software to identify and sort low abundance target cells. This system
was employed to isolate breast cancer stem cells from a heterogeneous cell population
and circulating tumor cells directly from peripheral blood. Additionally, an array-based
cell colony replication strategy was established which allowed highly efficient colony
v
ACKNOWLEDGEMENTS
There are several people I thank for providing assistance and support during the
duration of my graduate studies. I would like to use this opportunity to express gratitude
to my advisor Nancy Allbritton, for offering me a position in her lab. I have greatly appreciated Nancy’s guidance and encouragement over the past 5 years. I also thank
Chris Sims for his technical assistance in the lab. I am also grateful to my preliminary
and dissertation committee members, Royce Murray, Steve Soper, Richard Superfine,
Anne Taylor, Michael Ramsey and Klaus Hahn for providing precious advice on my
research.
I extend my gratitude to the wonderful collaborators and technical staff who
assisted on many of my projects. Richard Superfine, Briana Carsons, Wallace Ambrose,
Mark Walters and Michael Chua aided in the development and characterization of the
magnetic polymers formulated in Chapter 2 and Chapter 3. Adrienne Cox, Jim Fiordalisi
and Barry Udis are acknowledged for their assistance with experiment design and FACS
in Chapter 5. Jen Jen Yeh, Gabby Herrera and Rebecca Werlau are thanked for their
helpful discussions and providing blood samples used in Chapter 6. I am thankful to Jim
Bear, Sam King, Michael Ramsey and JP Alarie for their assistance with IA32 cell assays
and microstructure characterization. I acknowledge the National Institutes of Health for
supporting my research, grants EB007612 and EB012549.
I would like to thank the members of the Allbritton lab, past and present, for all
vi
the art of microfabrication, tissue culture and many of the other techniques required to in
my research. I am grateful to the other members of the microfabrication group: Jonny
Clark and Michael Hughes for assistance with fabrication; Yuli Wang for advice on
fabrication, Hamed Shadpour and Nick Dobes for receiving the majority of my random
questions; Pete Attayek for developing and optimizing the automated array screening
software; Michelle Kovarik for career guidance; Asad Ahmad, Joe Balowski, David
Detwiler, Rahul Dhopeshwarkar, Annadele Herman, Hsuan Lai, Doug Ornoff, Frank Pai,
Colleen Phillips, Gina Salazar, Pavak Shah and Jocelyn Wang. I would also like to thank
the members on the other side of the lab; Jazz Dickinson, Dechen Jiang, Sumith
Kottegoda, Emilie Mainz, Adam Melvin, Ryan Phillips, Scott Phillips, Angie Proctor,
Abby Turner, Kelong Wang, Greg Woss and Shan Yang. I am appreciative to you all for
the assistance provided with manuscript preparations, presentation development and keeping everything in the lab working. It’s been great having you all around to complain
with about failed experiments, enjoy team building activities outside of the lab and
engage in some of the most enlightening conversations to ever take place around a
lunchroom table.
Lastly, I would like to acknowledge my family and friends. I am grateful to my
parents and brother for their loving support. To my friends, you have made Chapel Hill a
wonderful and memorable place to live. I also thank Dennis Peters, my undergraduate
vii
TABLE OF CONTENTS
LIST OF TABLES ... xiv
LIST OF FIGURES ... xv
LIST OF ABBREVIATIONS AND SYMBOLS ... xxii
Chapter 1: Introduction to Single Cell Sorting: Applications and Technologies ... 1
1.1 Cell Heterogeneity ... 1
1.2 Analysis of Single Cells ... 1
1.3 Cell Sorting ... 4
1.4 Flow-Based Cell Sorting ... 5
1.5 Adherent Cell Sorting ... 7
1.6 Releasable Microarray Technology and Research Goals ... 8
1.6 References ... 11
Chapter 2: Transparent Magnetic Photoresists for Bioanalytical Applications ... 19
2.1 Introduction ... 19
2.2 Materials and Methods ... 21
2.2.1 Reagents ... 21
2.2.2 Magnetic photoresist development ... 22
2.2.3 Measurement of photoresist absorption ... 22
2.2.4 Cell culture ... 23
2.2.5 Measurement of cell metabolism ... 23
viii
2.2.7 Transmission electron microscopy (TEM) of cells ... 24
2.2.8 Fabrication of micropallet arrays and PDMS chambers ... 24
2.2.9 Laser-based pallet release ... 26
2.2.10 Magnetic field characterization ... 26
2.3 Results and Discussion ... 26
2.3.1 Development of magnetic photoresists ... 26
2.3.2 Absorbance of magnetic photoresists ... 27
2.3.3 Cell growth on magnetic photoresists ... 28
2.3.4 Imaging cells on magnetic photoresists ... 30
2.3.5 Formation of microstructures with the magnetic photoresist ... 31
2.3.6 Magnetic manipulation of microstructures ... 31
2.3.7 Separating cells using magnetic pallet arrays... 34
2.4 Conclusions ... 35
2.5 Tables and Figures ... 36
2.6 References ... 45
Chapter 3: Isolation and Manipulation of Living Adherent Cells by Micromolded Magnetic Rafts ... 50
3.1 Introduction ... 50
3.2 Materials and Methods ... 53
3.2.1 Materials ... 53
3.2.2 Magnetic polystyrene development ... 54
3.2.3 Measurement of magnetic polystyrene absorbance ... 54
3.2.4 Attenuated total reflectance Fourier transform infrared ……..spectroscopy (ART-FTIC) ... 55
ix
3.2.6 Fabrication of magnetic microrafts ... 55
3.2.7 Scanning electron microscopy (SEM) of microrafts ... 56
3.2.8 Transmission electron microscopy (TEM) of microrafts ... 57
3.2.9 Release and collection of magnetic microrafts ... 57
3.2.10 Cell culture on magnetic microrafts ... 58
3.2.11 Cell transfection ... 59
3.2.12 Imaging of cells on magnetic microrafts ... 59
3.3 Results ... 60
3.3.1 Characterization of transparent magnetic polystyrene ... 60
3.3.2 Single-layer magnetic rafts ... 61
3.3.3 Two-layer magnetic rafts ... 63
3.3.4 Cell culture on magnetic rafts ... 63
3.3.5 Release and collection of magnetic microrafts ... 65
3.3.6 Magnetic purification of collected microrafts using an inverted array ... 66
3.3.7 Cell sorting and purification with magnetic microrafts ... 67
3.3.8 Magnetic purification of cells on microrafts ... 68
3.4 Conclusions ... 68
3.5 Tables and Figures ... 70
3.6 References ... 81
Chapter 4: Precise manipulation and orientation of magnetic microstructures ... 84
4.1 Introduction ... 84
4.2 Materials and Methods ... 86
x
4.2.2 Fine-tipped magnetic pole fabrication ... 87
4.2.3 Magnetic field characterization ... 88
4.2.4 Fabrication of micropallet arrays ... 88
4.2.5 Fabrication of hybrid micropallets ... 89
4.2.6 Laser-based micropallet release ... 90
4.2.7 Micropallet collection ... 91
4.2.8 Quantification of micropallet retention ... 91
4.3 Results and Discussion ... 92
4.3.1 Fabrication/characterization of fine-tipped magnetic poles ... 92
4.3.2 Collection of micropallets with magnetic poles ... 93
4.3.3 Microstructure retention on collection substrates ... 95
4.3.4 Fabrication of hybrid micropallets ... 97
4.3.5 Controlling microstructure orientation ... 98
4.4 Conclusions ... 99
4.5 Tables and Figures ... 101
4.6 References ... 107
Chapter 5: Isolation of viable rare cells by large micropallet arrays ... 111
5.1 Introduction ... 111
5.2 Materials and Methods ... 113
5.2.1 Reagents ... 113
5.2.2 Fabrication of micropallet arrays and PDMS chambers ... 114
5.2.3 Cell culture ... 115
xi
5.2.5 Image processing and analysis ... 117
5.2.6 Micropallet release and collection ... 117
5.2.7 Fluorescence-activated cell sorting (FACS) ... 118
5.3 Results and Discussion ... 119
5.3.1 Design of large-scale micropallet arrays ... 119
5.2.2 Image acquisition ... 119
5.3.3 Imaging workflow ... 121
5.3.4 Image processing ... 122
5.3.5 Image analysis ... 124
5.3.4 Isolation of rare cells ... 125
5.3.5 Comparison of rare cell sorting with FACS ... 127
5.4 Conclusions and Future Work ... 128
5.5 Tables and Figures ... 131
5.6 References ... 137
Chapter 6: Capture and Isolation of CTCs Directly from Whole Blood with Micropallet Arrays ... 140
6.1 Introduction ... 140
6.2 Materials and Methods ... 143
6.2.1 Reagents ... 143
6.2.2 Fabrication of micropallet arrays and PDMS chambers ... 144
6.2.3 Micropallet functionalization ... 144
6.2.4 Cell culture and array plating ... 145
6.2.5 Microscopy ... 146
xii
6.3.1 Micropallet functionalization with anti-EpCAM ... 146
6.3.2 Cell capture on micropallets by anti-EpCAM ... 147
6.3.3 Tumor cell capture from whole blood ... 148
6.3.4 anti-EpCAM enrichment of MCF-7 cells from whole blood ... 149
6.4 Conclusions ... 150
6.5 Figures ... 152
6.6 References ... 155
Chapter 7: Microfabricated Arrays for Splitting and Assay of Clonal Colonies ... 159
7.1 Introduction ... 159
7.2.1 Materials ... 161
7.2.2 Fabrication of the arrays ... 162
7.2.3 Cell printing ... 164
7.2.4 Alignment system ... 165
7.2.5 Measuring pallet height ... 165
7.2.6 Fabrication of the collection plate... 166
7.2.7 Laser-based release of microstructures from the pallet array ... 166
7.2.8 Cell plating and culture on the pallet array ... 167
7.2.9 Cell collection and culture after release ... 167
7.2.10 Cell viability assay ... 168
7.2.11 Lentiviral construct production, infection procedure and FACS ... 168
7.2.12 Immunocytochemical staining of cells ... 168
7.2.13 Western blotting ... 168
xiii
7.3.1 Array design and fabrication ... 169
7.3.2 Colony printing... 170
7.3.3 Impact of post dimensions and cell type on printing efficiency ... 171
7.3.4 Accuracy of colony printing ... 172
7.3.5 Assessment of the printing efficiency for multiple different cell types ... 173
7.3.6 Isolation of clonal cell lines exhibiting Coronin 1B knockdown ... 173
7.4 Conclusions ... 175
7.5 Tables and Figures ... 177
xiv
LIST OF TABLES
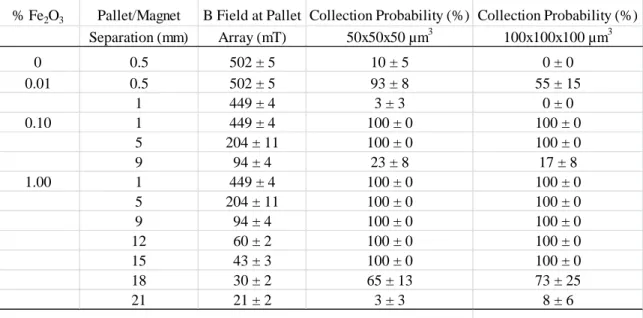
Table 2.1 Vertical collection of magnetic micropallets ... 36
Table 3.1 Collection of Magnetic Rafts ... 70
Table 4.1 Accuracy of micropallet collection by magnetic poles ... 101
Table 4.2 Micropallet retention to various substrates ... 102
Table 4.3 Hybrid micropallet collection ... 103
Table 5.1 Effects of MVX-10 microscope objective on imaging parameters ... 131
xv
LIST OF FIGURES
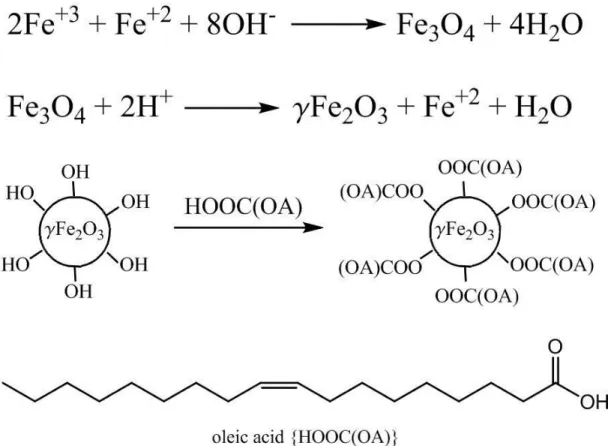
Figure 2.1 Schematic of the fabrication process of oleic acid-coated maghemite
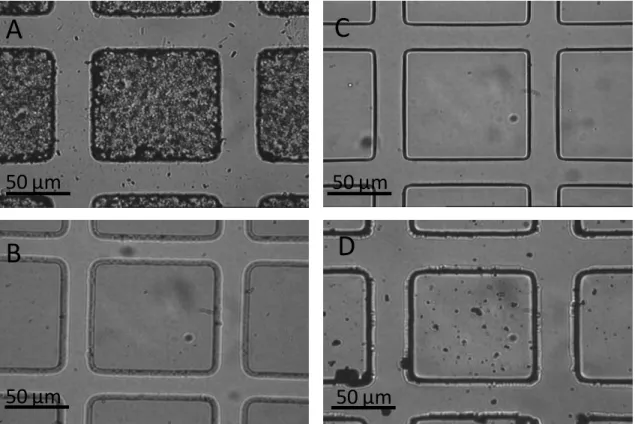
nanoparticles ... 37 Figure 2.2 Transmitted light microscopy of microstructures (100-µm squares
with a 30-µm height) made with 1002F photoresist containing 1% maghemite nanoparticles directly mixed into 1002F (A) and 1% maghemite nanoparticles incorporated into 1002F through toluene dilutions (B). Micropallets were also fabricated with 1% maghemite nanoparticles uniformly incorporated into SU8 (C). 1% 100 nm Ni
particles in 1002F photoresist (D). Scale bars are each 50 µm ... 38 Figure 2.3 Photoresists with dispersed maghemite nanoparticles. TEM images
of 1% maghemite nanoparticles in 1002F (A) or SU-8 photoresists (B) (scale bar is 200 nm). Insert shows an expanded view of a single nanoparticle (scale bar is 10 nm). Transmittance of 100 µm thick films
of 1002F with various concentrations of magnetic nanoparticles (C) ... 39 Figure 2.4 Measurement of metabolism by colorimetric assay of cells grown on
photoresist. HeLa, RBL or 3T3 cells were cultured on glass (squares), 1002F photoresist (circles), or 1002F photoresist with 1% maghemite nanoparticles (triangles) for varying times. Shown on the “y” axis is the absorbance of the orange formazon product produced by metabolically active cells. Error bars represent the standard deviation
of four measurements ... 40 Figure 2.5 Uptake of maghemite nanoparticles by cells. TEM images of HeLa
cells cultured on 1% magnetic 1002F without (A) and with a 2 µm-thick protective film of native 1002F over the magnetic photoresist (C). Arrows show clusters of nanoparticles within the cells. Inserts show enlarged images of the magnetic nanoparticles (A) and cellular organelles without nanoparticles (C) (scale bars are 150 nm). TEM images of 1002F photoresist containing 1% maghemite nanoparticles
before (B) and after surface roughening (D) ... 41 Figure 2.6 Brightfield images of photoresists with attached RBL cells. The
5-µm thick films were comprised of 1002F (A), 1002F with 1% maghemite particles uniformly dispersed (B), and 1002F with 1%
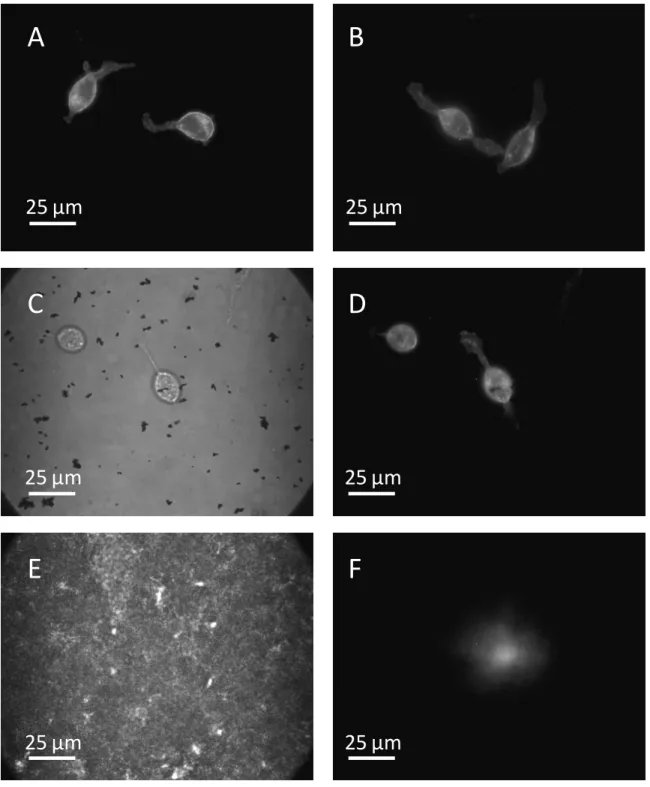
maghemite particles aggregated (C) ... 42 Figure 2.7 Fluorescence images of RBL cells stained with Alexa Fluor 647-
xvi
nickel nanoparticles (C-D) or 50-µm thick film of 1002F containing 1%
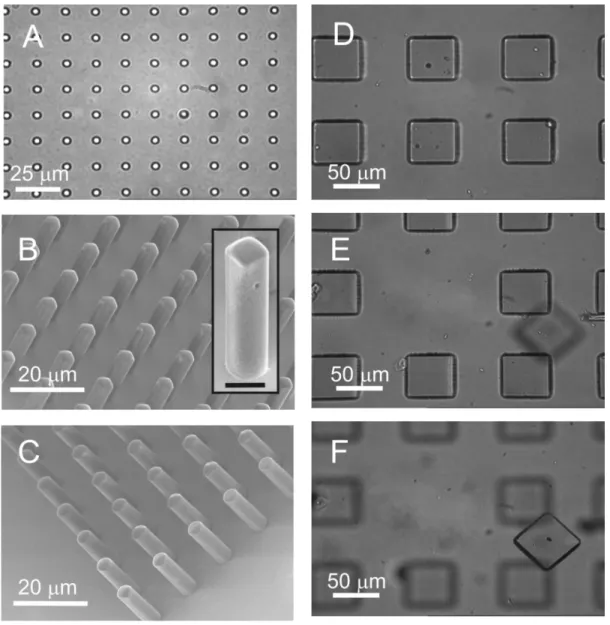
aggregated maghemite nanoparticles (E-F) ... 43 Figure 2.8 Microstructures from magnetic photoresists. Brightfield image of 3
m circular structures composed of SU8 with 1% maghemite nanoparticles (A). SEM images of rectangular structures formed from 1002F photoresist containing 1% maghemite nanoparticles (B) and cylindrical structures formed from SU-8 photoresist containing 1% maghemite nanoparticles (C). The microstructures in B and C were fabricated from masks with 3 m-sized openings and film heights of 12 µm. Insert shows an expanded view of a single rectangular structure (scale bar is 5 µm). Brightfield image of an array prior to laser-based release of a pallet (D). The pallets were 100x100x30 µm3 in size and composed of 1002F with 1% maghemite nanoparticles. At the array surface the magnetic field was 502 mT. (E) Image of the same array after pallet release. The objective focal plane is located at in the plane of the array. (F) Image of the released pallet. The objective focal plane
is located on the glass slide 0.5 mm above the array ... 44 Figure 3.1 Magnetic PS-AA characterization. (A) TEM image of PS-AA
containing 1% γFe2O3 nanoparticles. (B) The region in the box in (A) is shown at increased magnification. (C) Transmittance curves of films of
PS-AA with various concentrations of embedded γFe2O3 nanoparticles ... 71 Figure 3.2 ATR-FTIR spectra of films consisting of (A) PS-AA or (B) PS-AA
containing 1% γFe2O3. The peak at 1704 cm-1 is representative of a carbonyl group stretch and present only in the AA and magnetic PS-AA. Peaks at 1602 cm-1 and 1493 cm-1, characteristic of aromatic C=C bond stretching, along with the peak at 1452 cm-1, resulting from bending of methylene groups, are all observed in polystyrene, PS-AA
and magnetic PS-AA... 72 Figure 3.3 Fabrication of magnetic microrafts. (A) Brightfield and (B) SEM
images of PS-AA microrafts containing 1% γFe2O3. Insert shows a side view of a raft with PDMS partially removed. (C) TEM images of
microraft-air interface and (D) PDMS-microraft interface ... 73 Figure 3.4 DIC images of microraft arrays developed from (A) 1002F
containing 1% γFe2O3 or (B) SU8 containing 1% γFe2O3. TEM image of the base (C) and upper surface (D) of a microraft produced from
1002F containing 1% γFe2O3 ... 74 Figure 3.5 Two-layer magnetic raft fabrication. (A) Scheme of two-layer
2-xvii
layer microraft composed of a 10 μm magnetic PS-AA layer covered
with an 8 μm thick layer of PS-AA... 75 Figure 3.6 Image of a microraft array composed of PS-AA microrafts
containing 1% γFe2O3 (A). Magnetic microraft array attached to a
polycarbonate cassette (B) ... 76 Figure 3.7 Imaging cells on magnetic microrafts. Brightfield (A) and SEM (B)
images of HeLa cells adhered to 2-layer microrafts (100 µm) coated with collagen. DIC (C) and confocal fluorescence (D-F) images of a C2C12 cell loaded with fluorescent dyes. Individual fluorescent channels show the fluorophores introduced to the cell by transfection with an eGFP expressing plasmid (emission at 517 nm) (D), staining with CellMaskTM orange plasma membrane dye (emission 567 nm) (E)
and DNA staining (Draq-5 emission at 697 nm) (F) ... 77 Figure 3.8 Brightfield (A) and fluorescence (B-D) images of a HeLa cell
adhered to a 2-layer microraft (100-µm side). HeLa cells were stained with a nuclear dye, Hoechst 33342 (B) and a cytoplasmic dye CellTracker Red (C). A composite of the fluorescence images is shown
(D) ... 78 Figure 3.9 A series of time-resolved images demonstrating the release and
magnetic collection of microrafts. In the displayed images, the neodymium magnet shown at the bottom of the image is 5 mm above the array and out of the focal plane. The microraft array composed of PS-AA containing 0.1% γFe2O3 (A) is deflected out of the focal plane by the microneedle during release of an individual microraft (B). The position of the microraft 1, 2, 3 and 4.3 s following release, panels (C-F) respectively, was monitored to assess the movement of a loose magnetic microstructure in a magnetic field. Microrafts are observed to move upward and thus out of focus as they are attracted to the magnet.
Movie of micropallet collection provide in online version ... 79 Figure 3.10 Single cell sorting with magnetic microrafts. (A) Scheme for the
magnetic collection of microrafts. (B-H) Brightfield and fluorescence images of a HeLa cell expressing a fluorescent protein identified, isolated and expanded into a clonal colony. (B-E) A single HeLa cell possessing a fluorescent nucleus is identified on an array composed of two-layer microrafts (100 m). (F-I) The cell seen in “B-E” immediately following magnetic-assisted collection (F,G) and after 7
days of incubation (H,I) ... 80 Figure 4.1 Characterization of magnetic poles. A) Magnetic field strength (in
xviii
long tapered pole comprised of vim var iron (tan triangle) and 2.54-cm cone made from carbon iron (pink triangle). The dashed line represents a magnetic field strength of 40 mT below which micropallet collection is ineffective. B) Images of magnetic poles: structures from from left to right represent a 1.27-cm diameter/1.27-cm tall pole, 1.27-cm diameter/2.54-cm tall pole and a 1.27-cm diameter/ 1.27-cm long
tapered pole ... 104 Figure 4.2 Micropallet collection by magnetic pole tips. A) Image of magnetic
pole system with magnetic tip positioned over collection substrate of a micropallet array device. B) Schematic of micropallet collection with a magnetic pole tip. C) Brightfield image of magnetic micropallet collected by a 1.27-cm tapered pole tip. D) Brightfield image of magnetic micropallet following collecting by a 1.27-cm magnetic pole and E) corresponding image after removal of the pole. F-H) Images of a 1.27-cm magnetic pole aligned over a micropallet array at an angle of
45o, 60o and 90o, repectively ... 105 Figure 4.3 Fabrication and collection of hybrid micropallets. A) Schematic of
the process flow for fabrication of the hybid micropallets. Images of hybid micropallets composed of a 60-µm 1002F micropallet with B) 1% γFe2O3 base, C) 10% γFe2O3 border or D) 50% γFe2O3 border. Collection of hybrid micropallets composed of a 1% γFe2O3 base E) immediately following collection and F) after separation of the micropallet array. G) Capture of hybrid micropallets comprising a 10% γFe2O3 border immediately following collection. White arrows represent micropallets collected in upright orientation, black arrows represent micropallets collected in an inverted orientation and red
arrows represent micropallets captured on their side ... 106 Figure 5.1 (A) Photograph of large micropallet array. Inserts show a region of
the array magnified ×4.3 and ×30. (B) Schematic of the process flow
for image acquisition and data analysis ... 132 Figure 5.2 Micrographs of HeLa cells admixed with a low abundance of GFP-
HeLa cells on micropallets. Raw brightfield and fluorescence images taken with the MVX-10 microscope (1X objective/ 2X zoom) showing identification of a single GFP-HeLa cell (A-B). Insets are of the same GFP-HeLa cell aquired by an inverted microscope with a 60X objective. Brightfield image of a different region of the same array showing the presence of a piece of dust (C) magnified in (D). Magnified fluorescence images highlighting the light scatter generated by the same debris particle when imaged by FITC (E), DAPI (F) and
TxRed (G) filter sets ... 133 Figure 5.3 Image processing. Normalized S/N from images of micropallet
xix
350±25nm, Dichroic 400, Em. 460±25nm), FITC (Ex. 470±20, Dichroic 495, Em. 525±25) and TxRed (Ex. 545±15, Dichroic 570 Em. 620±30) (A). The S/N ratio was normalized from 0 to 1 for each filter. Optimal exposure times were selected where increasing the exposure no longer sufficiently increased the S/N ratio for varying background subtraction techniques. S/N ratio for varying background subtraction techniques applied to fluorescence images of GFP-HeLa cells on micropallets (B). The S/N ratio was calculated for the raw image (1) and image following background subtraction by adaptive wiener filtering (2), top hat filtering (3), adaptive wiener filtering (4), adaptive top hat filtering (5) and modified top hat filtering (6). The top hat filter used a disk shaped structuring element 50 µm in diameter. The modified top hat used a morphologically closed (square structing element of 75 × 75 µm) which was then morphologically opened (disk structuring element 50 um in diameter) and subtracted from the orifinal image. Optical (C) and fluorescence (D-F) images of a GFP-HeLa cell on an array of micropallets imaged with a FITC filter set. Pseudocolor fluorescence images are of the raw image (D) and following background subtraction by adaptive wiener filtering (E) and modified
top hat filtering (F) ... 134 Figure 5.4 Sensitivity vs Threshold value curves to optimize selected threshold
values for each filter set in order to achieve 100% sensitivity and
minimize false positives ... 135 Figure 5.5 Efficiencies of low abundance GFP-HeLa cell sorting by
micropallet arrays and FACS. GFP-HeLa cells admixed into a population of HeLa cells at frequencies of 10-6 – 10-4 were detected by their fluorescence in FITC channels (black triangles). Following sorting into a multiwell plate the proliferation was recorded as the percentage of cells that formed small colonies after 7 days incubation (blue
squares). ... 136 Figure 6.1 anti-EpCAM functionalization of micropallets. Brightfield image of
micropallets (A) and fluorescence images of untreated micropallets (B), FITC-EpCAM physically absorbed to micropallets (C) and FITC- EpCAM attached to micropallets grafted with PAA and covalently
attached protein A/G (D) ... 152 Figure 6.2 Selective cell capture on EpCAM functionalized micropallets.
MCF-7 cells on micropallet array before (A) and after rinsing (B).
HeLa cells on micropallet array before (C) and after rinsing (D) ... 153 Figure 6.3 Capture of MCF-7 cells from peripherial blood. Brightfield (A) and
xx
washing. Brightfield (C) and fluorescence images (D) of the same array
in A and B after washing ... 154 Figure 7.1 Schematic of cell printing and separation using the pallet and
printing arrays. A) Cross sectional view of the pallet array. The larger squares at the edge of the array represent the alignment structures (schematic is not to scale). B) The pallet array with cultured single cells (small black circles). C) The cells on the pallet array have expanded into clonal colonies. D) Cross sectional view of the printing array which is below the substrate in this schematic. The rectangles at the edges of the array represent the alignment structures. Shown also is the fluid reservoir on the opposite side of the printing array substrate used to weight the array after mating. E) Cross sectional view of the mated arrays with liquid in the printing array reservoir. F) Cells are shown migrating along the posts upward to the printing array. G) The arrays are separated with the pallet array returned to culture and the printing array subjected to an assay for target identification. H) Target colony(s)
are released and collected from the pallet array ... 178 Figure 7.2 Schematic of array-array alignment procedure ... 179 Figure 7.3 (A) Original pallet array with alignment markers. Array shown
measures 1×1 cm and contains 1296 individual pallets. The cross-shaped alignment markers are seen on the right and left of the central pallet array (B) 1×1 cm printing array with alignment marker grooves to either side of the array. The array is facing upward while a Transwell® chamber has been attached to the backside of the printing array. (C) The mated arrays placed in a Petri dish during cell transfer. The Transwell® chamber is on the top surface and filled with media to press the two arrays together. The pallet array is the bottom-most array
seated in the base of the Petri dish. Media is added to cover both arrays ... 180 Figure 7.4 Scanning electron micrographs of the arrays. A) The pallet array.
The individual pallets are 150 µm (L) × 150 µm (W) × 120 µm (H) with a 150 µm inter-pallet gap. B) The printing array. The base is 250 µm (L) × 250 µm (W) × 50 µm (H) with a 50 µm inter-pallet gap. The
post dimensions are 60 (L) × 60 (W) × 100 (H) µm ... 181 Figure 7.5 Culture and printing of cells. A) Brightfield image of a small region
xxi
posts. G-J) Localization of GFP- expressing and wild-type colonies on the arrays. Shown are brightfield and fluorescence images of corresponding regions of pallet and printing arrays with replicated colonies from a mixture of wild-type HeLa cells and cells expressing a nuclear GFP fusion protein. In G and H, 3 colonies are seen only one of which is composed of cells expressing GFP. In I and J, the replicated colonies are seen to be composed of the same phenotypes. Note that the cells from the colony in the lower center pallet are on the post and have
not yet spread to the printing base ... 182 Figure 7.7 Isolation of Coronin 1B knockdown in IA32 clones. Each column
contains in descending order: brightfield image, fluorescence image for GFP expression, fluorescence image of phalloidin-stained actin, and fluorescence image for Coronin 1B. A) Images of a successful knockdown of Coronin 1B in IA32 cells (GFP+/Coronin 1B-) replicated onto printing array, and B) corresponding cells isolated and cultured. C) Images of IA32 cells expressing GFP and expressing Coronin 1B replicated onto cell printing array, and D) corresponding cells isolated and cultured. E) Images of IA32 cells lacking GFP expression and lacking Coronin 1B knockdown replicated onto cell printing array, and
xxii
LIST OF ABBREVIATIONS AND SYMBOLS
γFe2O3 – iron(III)oxide nanoparticle PCR – polymerase chain reaction
MACS – magnetic-activated cell sorting
FACS – fluorescence-activated cell sorting
LCM – laser capture microdissection
LPC – laser pressure catapulting
CTC – circulating tumor cell
SU-8 – Formaldehyde, polymer with (chloromethyl)oxirane and 4,4'-(1- methylethylidene)bis[phenol]
1002F – phenol, 4,4′-(1-methylethylidene)bis-, polymer with 2,2′-[(1-methylethylidene) bis(4,1-phenyleneoxymethylene]bis[oxirane]
PEG – polyethylene glycol
PDMS – polydimethylsiloxane
Nd – neodymium
YAG –yttrium aluminum garnet
MEMS – microelectromechanical systems
µ – micro
Sm2Co17 – samarium cobalt PMMA – polymethylmethacrylate
EHEC – ethyl(hydroxyethyl)cellulose
CE – 3,4-epoxycyclohexylmethyl-3´4´-epoxycyclohexanecarboxylate
SWNT – single-wall carbon nanotubes
xxiii HeLa – human cervical cancer cell line
RBL – rat basophilic leukemic cell line
GBL – γ-butyralactone
1002F developer – 1-methoxy-2-propanol
DMEM – Dulbecco’s modified Eagle’s medium
FBS – fetal bovine serum
PBS – phosphate buffered saline
pH – potential hydrogen
EDTA – ethylenediaminetetraacetic acid
XTT – sodium 3´-[1-(phenylaminocarbonyl)- 3,4-tetrazolium]-bis (4-methoxy-6-nitro) benzene sulfonic acid hydrate
m – milli
m – meter
L – liter o
– degrees
C – celsius
CO2 – carbon dioxide g – gram
min – minute
% – percent
SEM – scanning electron microscopy
k – kilo
V – volts
xxiv TEM – transmission electron microscopy
M - molar
x – times
n – nano
s – second
DC – direct current
UV – ultra violet
n – number
Fcϵ - fragment crystallizable-epsilon receptors
IgE – immunoglobulin E
Fg – gravitational force Fm – magnetic force m – mass
g – acceleration due to gravity
V – volume
∆χ – difference in magnetic susceptibilities
N – newton
T – tesla
< – less than
> – greater than
± – plus or minus
Fe – iron
xxv Fe3O4 – magnetite or iron(III) oxide
γFe2O3 – maghemite or iron(II) oxide γ – gamma
HOOC(OA) – oleic acid
H2O – dihydrogen monoxide or water Ni – nickel
AIBN – 2,2'-azobisisobutyionitrile
DNA – deoxyribonucleic acid
h – hour
PS-AA – poly(styrene-co-acrylic acid)
v/v – volume/volume
ATR – attenuated total reflectance
FTIR – Fourier transform infrared spectroscopy
c – centi
rmp – revolutions per minute
vol – volume
in – inch
Hg – mercury
wt – weight
Au – gold
min – minute
GFP – green fluorescent protein
xxvi
C2C12 – mouse myoblast cell line
CMV – cytomegalovirus
CCD – charge-coupled device
DIC – differential interference contrast
L – length
W – width
H – height
W – watt
J – joule
G – gauge
B – magnitude of the magnetic field intensity
Bp – pole strength r – radius
≥ – greater than or equal to
≤ – less than or equal to
2–
squared
3–
cubed
CD – cluster of differentiation
diam – diameter
3D – three-dimensional
CMOS – complementary metal-oxide-semiconductor
FITC – Fluorescein isothiocyanate
xxvii
Texas Red – sulforhodamine 101 acid chloride
ABS – Acrylonitrile butadiene styrene
N.A. – numerical aperature
Fepi – light gathering power for epi-illumination M – magnification
M – million or mega
GUI – graphical user interface
Em – emission
Ex – excitation
S – signal
N – noise
FDA – Food and Drug Administration
MCF-7 – human breast cancer cell line
ECM – extracellular matrix
EpCAM – epithelial cell adhesion molecule
CAN – cerium(IV) ammonium nitrate
EDC – N-(3-dimethylaminopropyl)-N´-ethylcarbodiimide hydrochloride
PAA – polyacrylic acid
PDX – patient-derived xenograft
sh – short hairpin
RNA - ribonucleic acid
Cy – cyanine
xxviii A549 – human alveolar adenocarcinoma cell line
HT1080 – human fibrosarcoma cell line
NaCl – sodium chloride
KHPO4 – mono potassium phosphate KH2PO4 – potassium dihydrogen phosphate KCl – potassium chloride
BSA – bovine serum albumin
RIPA – radioimmunoprecipitation assay
PVDF – polyvinylidene fluoride
HRP – horseradish peroxidase
GAPDH – glyceraldehyde 3-phosphate dehydrogenase
# – number
= – equals
1
Chapter 1: Introduction to Single Cell Sorting: Applications and Technologies
1.1 Cell Heterogeneity
An adult human body is composed of trillions of mammalian cells and harbors
numerous other cells such as bacteria and yeast. Mammalian cells that construct our
bodies have been classified into hundreds of discrete cell types.1,2 Like the organisms they comprise, individual cells are not developmentally static but rather undergo
numerous changes during their lifespans. How cells have developed to their current
lineage and how environmental effects control their fate are crucial questions in biology
and medicine. Distinguishing various cells is critical to our ability to examine and
genetically modify cells. This task is complicated as cellular processes of genetically
equivalent cells and even the same cell change over time, resulting in cellular
heterogeneity.3-10 The behavior of these cells varies drastically as a function of numerous factors with their surroundings playing a dominant role in fate determination. The
complex interactions of cellular environment, function, and behavior have spurred the
development of many new tools for analyzing and exploiting these fundamental units of
life.
1.2 Analysis of Single Cells
Characterization of cellular phenotype and behavior is critical to identification
and understanding of cells.11,12 This information is important to research in the fields of cell biology, biomedical sciences and systems biology. Examination of human cells has
2
Further analyses of these cells provide information regarding possible therapies
and treatments. A plethora of information about disease may be obtained by observing
cell interactions and changes in their in vivo environment. Investigating cells in vivo, in
their native surroundings, produces the most biologically relevant systems for monitoring
cells. However, reliance on these systems for disease research limits assay throughput
and increases costs. Several approaches aim to remove cells from their in vivo
microenvironment and culture cells in an in vitro system. These methods include human
cell culture in a Petri dish, microtiter plate, microfluidic system or animal model. No
matter the mode of culture and isolation, the information these cells provide depends on
the method of analysis.
Traditional biochemical assays analyze bulk populations of cells. Standard cell
assays, such as, western blotting, electrophoresis, PCR, mass spectrometry and
immunofluorescence imaging, pool the lysates or data from thousands to millions of cells
for analysis. While averaging data over a large group of cells is sufficient for many
applications, this strategy masks critical information provided by individual or small
subsets of cells. Several approaches to analyzing cells on a cell-to-cell basis have
produced interesting information and results not documented by ensemble assays.14,15 Many of the technologies for analyzing bulk populations of cells have been adapted to
analyze single cells, including microscopy,16,17 mass spectrometry,18 PCR,19,20 gel electrophoresis,21,22 chromatography23,24 and capillary electrophoresis.25 Flow cytometry has obtained substantial commercial success for its ability to efficiently analyze millions
3
making it useful for a wide variety of applications.28,29 Unfortunately, there is generally a trade-off in the information that can be obtained by these various single cell analysis
techniques. For example, PCR, MS and capillary electrophoresis offer a wealth of
information; however, they are destructive techniques and therefore not capable probing
cellular responses over time. Likewise, flow-based technologies such as flow cytometry
are typically not compatible with multi-time-point analysis and discrimination of
intracellular spatial organization requires sophisticated imaging analysis.30 Acquisition of this information has been efficiently acquired by immobilizing cells during analysis.
Imaging cytometry analyzes immobilized cells by microscopy techniques
including brightfield and fluorescence microscopy.31 Imaging cytometry techniques affording efficient cell analysis include laser scanning cytometry32-34 and automated microscopy also referred to as high content screening or cellomics.35 Microscopy-based cell imaging is valuable in that the spatial location of fluorescent tags attached
specifically to target proteins, surface receptors, and other biomolecules may be
evaluated. Monitoring subcellular components as they exist naturally in cells allows
interrogation strategies not feasible by whole cell analysis. Furthermore, examining
adherent cells cultured on a substrate allows repeated examination of individual cells over
time. This permits observation of cellular responses to environmental stimuli resulting
from external factors such as drug additions and cell-cell interactions. The main
limitation of these systems is the lower throughput compared with flow cytometry, due to
imaging time and data processing speed.
The strengths of imaging cytometry for studying cellular interactions and function
4
immobilization and microenvironment of cells.36,37 These devices allow researchers to arrange individual cells in well-ordered arrays. Fixing cells in predefined locations offers
numerous advantages over standard culture with cells at random locations, including
controlled cell-to-cell interactions, simplified image processing and traceability of cells.
Tracking cells over time is especially useful for studying time dependent cell responses
and for system integration with automated tasks. Various strategies have been applied to
create cell arrays by employing physical, chemical, optical, or electrical forces.38 Physically trapping cells with microstructures is perhaps the simplest means for arraying
cells as this method does not require any external equipment. Several microstructure
geometries exist for trapping cells including wells,39,40 pores,41 wiers,42 and pallets.43 Following cell trapping numerous assays and further manipulation have been achieved on
these cells.
1.3 Cell Sorting
In order to perform many types of cellular analysis, it is essential to have methods
to isolate and culture specified target cells. Effective cell culture often requires isolation
of target cells from the surrounding heterogeneous cellular population. Non-target cells
can affect the growth of target cells and reduce accuracy of cellular analysis.12 For these reasons it is important to have a technique capable of identifying the cell of interest,
separating the cell from unwanted cells and collecting the cell for further studies. A
number of available technologies can provide isolation of target cells from a cell mixture.
These systems operate on a variety of instrumental attributes including: serial vs parallel
analysis, destructive vs live cell analyses, and flow-based vs stationary systems.
5
fluorescence-activated cell sorting (FACS),26,28,45 microfluidic-based cell sorting,46 limiting dilution,12,47 laser capture microdissection (LCM),48 laser pressure catapulting (LPC),49 and microarray technologies.44,50
1.4 Flow-Based Cell Sorting
Many cell sorting strategies have been developed for isolating non-adherent cells
from a heterogeneous population. Non-adherent cells, typically found in our bloodstream,
include erythrocytes (red blood cells), leukocytes (white blood cells) and thrombocytes
(platelets).51 In addition to common blood cells, tumorigenic cells or bacteria are occasionally present in the bloodstream of patients. The number of tumor cells,
commonly referred to as circulating tumor cells (CTCs), in a patient has recently been
correlated with tumor progression in response to anti-cancer therapies.52-54 Ease of cell collection from patients and the wealth of information these cells possess have led to the
development of many technologies for isolating and analyzing non-adherent blood
cells.51,55
Adherent mammalian cells may also be removed from their growth surfaces and
temporarily suspended in a non-adherent state. These cells are typically stripped from
their culture substrate by enzymatic digestion or mechanical shearing. These approaches
have successfully generated suspensions of viable adherent cells. However, removal of
adherent cells from their growth surfaces is accompanied by changed cell morphology,
reduced cellular surface markers, altered cell physiology and decreased viability.56,57 Strategies for sorting suspended adherent cells and non-adherent cells include: column
6
microfluidics. MACS and FACS have achieved perhaps the most commercial success due
to their efficiency at cell sorting.
Cell sorting methods employing magnetism, referred to as MACS, utilize the
cell-specific antibodies to bind magnetic beads to the cells of interest (positive selection) or
unwanted cells (negative selection).44 Typically avidin labeled-cells are captured on biotinylated magnetic beads and injected into a column or microfluidic channel. A
magnetic field is then applied to attract the cells with attached magnetic beads within the
device. Non-attached cells pass freely through the column or channel at this point.
Target cells are then eluted to side channels or upon removal of the external magnet.58-60 Though these sorting strategies offer extremely high throughputs they are reliant on
specific surface antibodies to bind cells to magnetic beads. This results in limited cell
sorting parameters and poor purity caused by non-specific antibody binding.
Integration of cell sorting capabilities with flow cytometry instrumentation allows
sensitive and multiparameter analysis of cells followed by isolation of the target cells.27 Cell sorting can be achieved through fluidic switching61 or isolation of individual droplets formed from a fluid stream,62 but the majority of cell isolation strategies are derived from the latter approach. Instrumentation employing the isolation of cells within individual
droplets has been commercialized and is referred to as fluorescence-activated cell sorters
(FACS). FACS instruments have successfully isolated viable mammalian cells by
numerous sorting parameters and with relatively high throughput (>10,000 cells/s).
However, FACS systems are not effective at sorting small sample sizes (<50,000 cells) or
7 1.5 Adherent Cell Sorting
FACS and MACS allow high-throughput and efficient sorting of suspended cells.
However, there are many applications where sorting is necessary while cells remain
adhered to a substrate, such as when cell identification depends on microscopy-based
methods.50 This can be the case for cells that that can be identified by differences in their growth rates, morphology or biomarker localization.
Traditional approaches to enriching adherent cells selectively target cells based on
their ability to proliferate in the presence of specific growth inhibitors or by their
selective affinity for culture substrates.12,65 Techniques for further isolation of pure cell strains from a heterogeneous culture rely on plating a dilute cell suspension and
selectively choosing the small colonies of interest by employing cloning rings or limiting
dilution methods.12,66 Isolation of cell colonies by cloning rings requires initial attachment of dispersed adherent cells to a substrate followed by growth of the individual
cells into discrete colonies. A collar, or the cloning ring, applied around target colonies
provides an isolating barrier allowing selective trypsinization and collection of the cells
within the cloning ring.47,67 With the limiting dilution technique, cell suspensions are added to multiwell plates to achieve wells containing single cells. Following cell culture,
a few of the thousands of wells will possess a clonal population.12 These methods have long been favored by the biology community because of their minimal instrumentation
requirements. However, while instrumentation costs are low, there are expenses
associated with prolonged cell maintenance in expensive growth media. In addition,
these techniques require significant amounts of labor, time, and reagents, all of which
8
Alternative approaches for achieving positive selection of adherent cells employ
lasers to separate target cells from the heterogeneous cell population.68 The two primary methods for isolating adherent cells, use a laser to either capture the target cell onto a
membrane or cut around a cell adhered to a membrane, commonly referred to as laser
capture microdissection and laser cutting microdissection, respectively.69 In laser capture microdissection, a thermoplastic membrane covering the cells is selectively fused to the
target cells by a focused laser.70 When the membrane is cooled to room temperature these cells become attached. Upon removal of the membrane the embedded cells are isolated
from the remaining cells. Conversely, in laser cutting microdissection the laser is used to
cut the film to which the cells are adhered.49,71,72 The dislodged film with the attached cell is then collected by a variety of techniques including a pressure catapulting approach,
gravity collection or collection with a fine-needle. The primary application of laser
microdissection has been isolating cells from tissue samples for genetic and proteomic
analysis.73,74 Recent papers have demonstrated the utility of these technologies for isolating and subsequently culturing viable cells. Though genetic analysis has
demonstrated cells are not disturbed by these technologies, published protocols to date
have only sorted small cell colonies. Additionally, undefined positioning of cultured cells
during sorting makes tracking cells over prolonged periods difficult and results in low
sorting throughputs.
1.6 Releasable Microarray Technology and Research Goals
Microfabricated and microprinted arrays afford researchers highly controlled
positioning of biomolecules and cells, as described in Section 1.3. While these
9
generally achieved by low-throughput and unreliable procedures. Techniques for
removing cells from the microarray include micromanipulation,75,76 laser capture microdissection77 and optofluidics.78 The Allbritton laboratory previously introduced two technologies for culturing adherent cells on arrays of microelements which could be
selectively detached from the array while still carrying the attached cells, referred to as ‘micropallets’ and ‘microrafts’.79-82
To date these arrays constitute 103 – 104 microelements fabricated on a substrate with a physical barrier serving to isolate cells on
the surfaces of individual microstructures. Microfabrication permits tailoring of the
geometry,83-85 material86 and functionalization87-90 of these microdevices to meet the requirement of cell attachment and growth. Consequently, a wide variety of cell types
have been cultured and isolated by these devices including; immortalized cell lines,80 primary cells87 and stem cells.91
Micropallets are developed by exploiting standard photolithography methods to
fabricate photoresponsive polymers (SU8 and 1002F photoresists) onto a glass
substrate.92 A physical barrier comprised of air43,93 or PEG94 is then generated between the microstructures. Following functionalization of the micropallets, cells are cultured on
the tops of the elements. SU8 and 1002F photoresists have poor adhesion to glass and
consequently the microdevices may be removed with minimal forces. The generation of a
cavitation bubble produced by a pulsed Nd:YAG laser focused at the glass
substrate:micropallet interface is employed to selectively release target micropallets from
10
the microwells by a dewetting phenomenon generates isolated microrafts.98 Additionally, individual microrafts are dislodged from the PDMS frame by mechanical actuation with a
microneedle. Detached microstructures are then collected by a pipette tip79 or via gravitational collection onto a collection dish. 81,82 Unfortunately, these collection approaches are plagued by loss of microstructures and contamination by undesired cells.
The goal of this graduate dissertation was to develop new strategies for capturing,
analyzing and collecting cells by microarray technologies. Micropallets were embedded
with magnetic nanoparticles to allow collection of released micropallets by an external
magnet as described in Chapter 2. A new strategy for uniformly dispersing the magnetic
nanoparticles throughout photoresists was developed to retain transparency of the
polymers to allow cell imaging. Related fabrication and collection approaches were then
employed to magnetically collect microrafts manufactured from a new selection of
transparent magnetic polymers in Chapter 3. Localization of the external magnetic fields
and regions of microstructure magnetism provided novel strategies for controlling
micropallet collection as described in Chapter 4. Magnetic actuation of the
microstructures afforded high collection efficiencies while eliminating foreign cell
contamination. These attributes made sorting rare cells by large arrays of micropallets
feasible as detailed in Chapter 5. Large arrays of micropallets were further utilized to
isolate CTCs directly from whole blood in Chapter 6. Chapter 7 details a strategy for
array-based replication of cell colonies to allow selection using destructive assays on
11 1.6 References
1. Vickaryous M, Hall B. Human cell type diversity, evolution, development, and classification with special reference to cells derived from the neural crest. Biological Reviews. 2006;81(3):425-455.
2. Alberts B, Bray D, Lewis J, Raff M, Roberts K, Watson JD. Molecular Biology of the Cell, 2nd Edn. New York: Garland Publishing, Inc.; 1989.
3. Ferrell JE, Machleder EM. The biochemical basis of an all-or-none cell fate switch in Xenopus oocytes. Science. 1998;280:895-896.
4. Taniguchi Y, Choi P, Li G, et al. Quantifying E-coli Proteome and Transcriptome with Single-Molecule Sensitivity in Single Cells. Science. 2010;329(5991):533-538.
5. Brehm-Stecher B, Johnson E. Single-cell microbiology: Tools, technologies, and applications. Microbiology and Molecular Biology Reviews. 2004;68(3):538-+. 6. Han A, Yang L, Frazier A. Quantification of the heterogeneity in breast cancer
cell lines using whole-cell impedance spectroscopy. Clinical Cancer Research. 2007;13(1):139-143.
7. Sims CE, Allbritton NL. Analysis of single mammalian cells on-chip. Lab on a Chip. 2007;7:423-440.
8. Graf T, Stadtfeld M. Heterogeneity of Embryonic and Adult Stem Cells. Cell Stem Cell. 2008;3(5):480-483.
9. Klein C, Blankenstein T, Schmidt-Kittler O, et al. Genetic heterogeneity of single
disseminated tumour cells in minimal residual cancer. Lancet.
2002;360(9334):683-689.
10. Dexter D, Leith J. Tumor heterogeneity and drug-resistance. Journal of Clinical Oncology. 1986;4(2):244-257.
11. Lindstrom S, Andersson-Svahn H. Overview of single-cell analyses: microdevices and applications. Lab on a Chip. 2010;10(24):3363-3372.
12. Freshney RI. Culture of Animal Cells, 6th Ed.: John Wiley & Sons, Inc.; 2010. 13. Walling M, Shepard J. Cellular heterogeneity and live cell arrays. Chemical
12
14. Sims CE, Allbritton NL. Single-cell kinase assays: opening a window onto cell behavior. Current Opinion in Biotechnology. 2003;14:1-6.
15. Kovarik M, Allbritton N. Measuring enzyme activity in single cells. Trends in Biotechnology. 2011;29(5):222-230.
16. Jongkind J, Ploem J, Reuser A, Galjaard H. Enzyme assays at single cell level using a new type of microfluorimeter. Histochemistry. 1974;40(3):221-229. 17. Reuser A, Jongkind J, Galjaard H. Methods for analysis of acid
alpha-1,4-glucosidase activity in single (hybrid) cells. Journal of Histochemistry & Cytochemistry. 1976;24(4):578-586.
18. Abramson F, McCaman M, McCaman R. Femtomole level of analysis of
bioenic-amines and amino-acids using functional group mass-spectrometry. Analytical Biochemistry. 1974;57(2):482-499.
19. Taniguchi K, Kajiyama T, Kambara H. Quantitative analysis of gene expression in a single cell by qPCR. Nature Methods. 2009;6(7):503-U550.
20. Warren L, Bryder D, Weissman I, Quake S. Transcription factor profiling in individual hematopoietic progenitors by digital RT-PCR. Proceedings of the National Academy of Sciences of the United States of America. 2006;103(47):17807-17812.
21. Rydberg B, Johanson KJ. Estimation of DNA strand breaks in single mammalian cells; DNA Repair Mechanisms. New York: Academic Press; 1978:456 - 468. 22. Osborne N. Do snail neurons contain more than one neurotrasmitter. Nature.
1977;270(5638):622-623.
23. Oates M, Cooper B, Jorgenson J. Quantitative amino-acid-analysis of individual snail neurons by open tubular liquid-chromatography. Analytical Chemistry. 1990;62(15):1573-1577.
24. Osborne N, Szczepan.AC, Neuhoff V. Amines and amino-acids in identified neurons of helix-pomatia. International Journal of Neuroscience. 1973;5(3):125-131.
25. Kennedy R, Oates M, Cooper B, Nickerson B, Jorgenson J. Microcolumn separations and the analysis of single cells. Science. 1989;246(4926):57-63. 26. Givan AL. Flow Cytometry First Principles (ed 2nd). New York: Wiley-Liss;
13
27. Ibrahim S, van den Engh G, Kumar A, Galaev I, Mattiasson B. Flow cytometry and cell sorting. Cell Separation: Fundamentals, Analytical and Preparative Methods. 2007;106:19-39.
28. Shapiro HM. Practical Flow Cytometry (ed 4th). New York: Wiley-Liss; 2003. 29. Bonetta L. Flow cytometry smaller and better. Nature Methods. 2005;2(10):785. 30. Goda K, Ayazi A, Gossett DR, et al. High-throughput single-microparticle
imaging flow analyzer. Proceedings of the National Academy of Sciences of the United States of America. 2012.
31. Chieco P, Jonker A, Van Noorden CJF. Image Cytometry. New York:
Springer-Verlag; 2001.
32. Kamentsky LA. Laser scanning cytometry. Methods in Cell Biology. 2001;63:51-87.
33. Kamentsky L. Laser scanning cytometry. Methods in Cell Biology, Vol 63. 2001;63:51-87.
34. Darzynkiewicz Z, Bedner E, Li X, Gorczyca W, Melamed M. Laser-scanning cytometry: A new instrumentation with many applications. Experimental Cell Research. 1999;249(1):1-12.
35. Starkuviene V, Pepperkok R. The potential of high-content high-throughput microscopy in drug discovery. British Journal of Pharmacology. 2007;152(1):62-71.
36. Zare R, Kim S, Yarmush M, Duncan J, Gray M. Microfluidic Platforms for Single-Cell Analysis. Annual Review of Biomedical Engineering, Vol 12. 2010;12:187-201.
37. Yarmush M, King K. Living-Cell Microarrays. Annual Review of Biomedical Engineering. 2009;11:235-257.
38. Di Carlo D, Lee L. Dynamic single-cell analysis for quantitative biology. Analytical Chemistry. 2006;78(23):7918-7925.
14
40. Lindstrom S, Andersson-Svahn H. Miniaturization of biological assays - overview on microwell devices for single-cell analyses. Biochimica Biophys Acta. 2011;1810:308-316.
41. Vona G, Sabile A, Louha M, et al. Isolation by size of epithelial tumor cells - A new method for the immunomorphological and molecular characterization of circulating tumor cells. American Journal of Pathology. 2000;156(1):57-63. 42. Di Carlo D, Aghdam N, Lee L. Single-cell enzyme concentrations, kinetics, and
inhibition analysis using high-density hydrodynamic cell isolation arrays. Analytical Chemistry. 2006;78(14):4925-4930.
43. Wang Y, Sims CE, Marc P, Bachman M, Li GP, Allbritton NL. Micropatterning
of living cells on a heterogeneously wetted surface. Langmuir. 2006;22:8257-8262.
44. Patel D. Separating Cells. New York: Springer-Verlag; 2001.
45. Schildkraut ER, Hercher M, Shapiro HM, et al. A system for storage and retrieval of individual cells following flow cytometry. J Histochemistry and Cytochemistry. 1979;27(1):289-292.
46. Chen P, Feng X, Du W, Liu B. Microfluidic chips for cell sorting. Frontiers in Bioscience-Landmark. 2008;13:2464-2483.
47. Kirkland DJ. Chemical transformation of Chinese hamster cells. I. A comparison of some properties of transformed cells. British Journal of Cancer. 1976;34:134-144.
48. EmmertBuck M, Bonner R, Smith P, et al. Laser capture microdissection. Science. 1996;274(5289):998-1001.
49. Schutze K, Lahr G. Identification of expressed genes by laser-mediated manipulation of single cells. Nature Biotechnology. 1998;16(8):737-742.
50. Sims C, Bachman M, Li G, Allbritton N. Choosing one from the many: Selection and sorting strategies for single adherent cells. Analytical and Bioanalytical Chemistry. 2007;387(1):5-8.
51. Toner M, Irimia D. Blood-on-a-chip. Annual Review of Biomedical Engineering. 2005;7:77-103.
15
metastatic colorectal cancer. Journal of Clinical Oncology. 2008;26(19):3213-3221.
53. Cristofanilli M, Budd G, Ellis M, et al. Circulating tumor cells, disease progression, and survival in metastatic breast cancer. New England Journal of Medicine. 2004;351(8):781-791.
54. Paterlini-Brechot P, Benali N. Circulating tumor cells (CTC) detection: Clinical impact and future directions. Cancer Letters. 2007;253(2):180-204.
55. Lauks I. Microfabricated biosensors and microanalytical systems for blood analysis. Accounts of Chemical Research. 1998;31(5):317-324.
56. Ingber DE. Tensegrity: the architectural basis of cellular mechanotransduction. Annual Review of Physiology. 1997;59:575-599.
57. Seidl J, Knuechel R, Kunz-Schughart LA. Evaluation of membrane physiology following fluorescence activated or magnetic cell separation. Cytometry. 1999;36(2):102-111.
58. Miltenyi S, Muller W, Weichel W, Radbruch A. High-gradient magnetic cell-separation with MACS. Cytometry. 1990;11(2):231-238.
59. Xia N, Hunt T, Mayers B, et al. Combined microfluidic-micromagnetic separation of living cells in continuous flow. Biomedical Microdevices. 2006;8(4):299-308. 60. Pregibon D, Toner M, Doyle P. Magnetically and biologically active
bead-patterned hydrogels. Langmuir. 2006;22(11):5122-5128.
61. Kamentsk LA, Melamed M. Spectrophotometric cell sorter. Science.
1967;156(3780):1364-&.
62. Herzenberg L, Sweet R. Fluorescence-activated cell sorting. Scientific American. 1976;234(3):108-117.
63. Scriba TJ, Purbhoo M, Day CL, et al. Ultrasensitive detection and phenotyping of CD4+ T cells with optimized HLA class II tetramer staining. J Immunology. 2005;175(10):6334-6343.
64. Xu W, Sims CE, Allbritton NL. Microcup arrays for the efficient isolation and cloning of cells. Analytical Chemistry. 2010;82:3161-3167.
16
66. Puck T, Marcus P, Cieciura S. Clonal growth of mammalian cells in vitro - growth characteristics of colonies from single HeLa cells with and without a feeder layer. Journal of Experimental Medicine. 1956;103(2):273-&.
67. McFarland DC. Preparation of pure cell cultures by cloning: Methods in Cell Science; 2000:63 - 66.
68. Berns MW, Greulich KO. Laser Manipulation of Cells and Tissues, 1st Ed.: Academic Press; 2007.
69. Murray G. An overview of laser microdissection technologies. Acta
Histochemica. 2007;109(3):171-176.
70. Emmert-Buck MR, Bonner RF, Smith PD, et al. Laser capture microdissection. Science. 1996;274:998-1001.
71. Bohm M, Wieland I, Schutze K, Rubben H. Microbeam MOMeNT - Non-contact
laser microdissection of membrane-mounted native tissue. American Journal of Pathology. 1997;151(1):63-67.
72. Schutze K, Posl H, Lahr G. Laser micromanipulation systems as universal tools in cellular and molecular biology and in medicine. Cell and Molecular Biology (Noisy-le-grand). 1998;44(5):735-746.
73. Burgemeister R. New aspects of laser microdissection in research and routine. Journal of Histochemistry and Cytochemistry. 2005;53:409-412.
74. Ladanyi A, Sipos F, Szoke D, Galamb O, Molnar B, Tulassay Z. Laser microdissection in translational and clinical research. Cytometry Part A. 2006;69A(9):947-960.
75. Tokilmitsu Y, Kishi H, Kondo S, et al. Single lymphocyte analysis with a microwell array chip. Cytometry Part A. 2007;71A(12):1003-1010.
76. Love JC, Ronan JL, Grotenbreg GM, van der Veen AG, Ploegh HL. A microengraving method for rapid selection of single cells producing antigen-specific antibodies. Nature Biotechnology. 2006;24(6):703-707.
77. Revzin A, Sekine K, Sin A, Tompkins R, Toner M. Development of a microfabricated cytometry platform for characterization and sorting of individual leukocytes. Lab on a Chip. 2005;5(1):30-37.
17
79. Salazar GT, Wang YL, Young G, et al. Micropallet arrays for the separation of single, adherent cells. Analytical Chemistry. 2007;79(2):682-687.
80. Wang Y, Young G, Aoto P, et al. Broadening cell selection criteria with micropallet arrays of adherent cells. Cytometry A. 2007;71:866-874.
81. Wang Y, Young G, Bachman M, Sims CE, Li GP, Allbritton NL. Collection and
expansion of single cells and colonies released from a micropallet array. Analytical Chemistry. 2007;79:2359-2366.
82. Wang Y, Phillips C, Xu W, et al. Micromolded arrays for separation of adherent cells. Lab on a Chip. 2010;10(21):2917-2924.
83. Pai JH, Xu W, Sims CE, Allbritton NL. Microtable arrays for culture and isolation of cell colonies. Analytical Bioanalytical Chemistry. 2010;398(6):2595-2604.
84. Wei X, Sims C, Allbritton N. Microcup Arrays for the Efficient Isolation and Cloning of Cells. Analytical Chemistry. 2010;82(8):3161-3167.
85. Xu W, Herman A, Phillips C, Pai JH, Sims CE, Allbritton NL. Selection and separation of viable cells based on a cell-lethal assay. Analytical Chemistry. 2011;83(1):278-283.
86. Pai J, Wang Y, Salazar G, et al. Photoresist with low fluorescence for bioanalytical applications. Analytical Chemistry. 2007;79(22):8774-8780.
87. Detwiler DA, Dobes NC, Sims CE, Kornegay JN, Allbritton NL. Polystyrene-coated micropallets for culture and separation of primary muscle cells. Analytical Bioanalytical Chemistry. 2012;402:1083-1091.
88. Gunn N, Bachman M, Li G, Nelson E. Fabrication and biological evaluation of uniform extracellular matrix coatings on discontinuous photolithography generated micropallet arrays. Journal of Biomedical Materials Research Part A. 2010;95A(2):401-412.
89. Shadpour H, Sims CE, Allbritton NL. Enrichment and expansion of cells using antibody-coated micropallet arrays. Cytometry A. 2009;75A:609-618.
18
92. Lorenz H, Despont M, Fahrni N, LaBianca N, Renaud P, Vettiger M. SU-8: a
low-cost negative resist for MEMS. Journal of Micromechancis and
Microengineering. 1997;7:121-124.
93. Wang Y, Bachman M, Sims CE, Li GP, Allbritton NL. Stability of virtual air walls on micropallet arrays. Analytical Chemistry. 2007;79:7104-7109.
94. Wang Y, Salazar G, Pai J, Shadpour H, Sims C, Allbritton N. Micropallet arrays with poly(ethylene glycol) walls. Lab on a Chip. 2008;8(5):734-740.
95. Ma H, Mismar W, Wang Y, et al. Impact of release dynamics of laser-irradiated polymer micropallets on the viability of selected adherent cells. J Royal Society Interface. 2011;doi: 10.1098/rsif.2011.0691.
96. Quinto-Su PA, Salazar GT, Sims CE, Allbritton NL, Venugopalan V. Mechanism
of pulsed laser microbeam release of SU-8 2100 polymer micropallets for the collection and separation of adherent cells. Analytical Chemistry. 2008;80:4675-4679.
97. Salazar GT, Wang YL, Sims CE, Bachman M, Li GP, Allbritton NL.
Characterization of the laser-based release of micropallets from arrays. Journal of Biomedical Optics. 2008;13(3).