A review of observed and projected changes in climate for the islands
in the Caribbean
A. V. KARMALKAR
School of Geography and the Environment, South Parks Road, University of Oxford, Oxford OX1 3QY, UK.
Corresponding author; email: [email protected]
M. A. TAYLOR, J. CAMPBELL and T. STEPHENSON
Climate Studies Group Mona, Department of Physics, University of the West Indies, Mona, Jamaica.
M. NEW
School of Geography and the Environment, South Parks Road, University of Oxford, Oxford OX1 3QY, UK/African Climate and Development Initiative, University of Cape Town, South Africa.
A. CENTELLA and A. BENZANILLA
Instituto de Meteorología de la República de Cuba, Habana 17, Cuba.
J. CHARLERY
Department of Computer Science, Mathematics and Physics, University of the West Indies, Cave Hill, Barbados.
Received October 3, 2012; accepted October 30, 2012
RESUMEN
disminución proyectada es mayor al inicio de la temporada de lluvias y suprime la sequía del medio ve-rano en el Caribe occidental. Las simulaciones del RCM muestran avances respecto del GCM, sobre todo por sus mejores representaciones de la extensión territorial, pero su desempeño depende en gran medida de la conducción del GCM. El presente estudio destaca la necesidad de contar con observaciones de alta resolución y comparar simulaciones de modelos climáticos para entender a fondo el cambio climático y su impacto en las pequeñas islas del Caribe.
ABSTRACT
Observed and projected changes in climate have serious socio-economic implications for the Caribbean islands. This article attempts to present basic climate change information—based on previous studies, available observations and climate model simulations—at spatial scales relevant for islands in the Carib-bean. We use the General Circulation Model (GCM) data included in the Coupled Model Intercomparison Project phase 3 (CMIP3) and the UK Hadley Centre regional climate model (RCM) data to provide both present-day and scenario-based future information on precipitation and temperature for individual island states. Gridded station observations and satellite data are used to study 20th century climate and to assess the performance of climate models. With main focus on precipitation, we also discuss factors such as sea surface temperature, sea level pressure and winds that affect seasonal variations in precipitation. The CMIP3 ensemble mean and the RCM successfully capture the large-scale atmospheric circulation features in the region, but show difficulty in capturing the characteristic bimodal seasonal cycle of precipitation. Future drying during the wet season in this region under climate change scenarios has been noted in pre-vious studies, but the magnitude of change is highly uncertain in both GCM and RCM simulations. The projected decrease is more prominent in the early wet season erasing the mid-summer drought feature in the western Caribbean. The RCM simulations show improvements over the GCM mainly due to better representation of landmass, but its performance is critically dependent on the driving GCM. This study highlights the need for high-resolution observations and ensemble of climate model simulations to fully understand climate change and its impacts on small islands in the Caribbean.
Keywords:Climate change, Caribbean islands, impacts, CMIP3, RCM.
1. Introduction
The islands of the Caribbean share a common set of features that include small size, steep inland topography restricting the land space available for development, and a heavy socio-economic dependence on the coastline and limited resources. These features enhance sensitivity to climate variability so that extreme events such as droughts, floods and hurricanes pose a very real threat to regional development. The threat is likely to be exacerbated under climate change.
For example, tourism, which is a significant contributor to regional GDP, is at high climate-induced risk from flooding, sea-level rise, coastal erosion and storm surges mainly due to its coastal
infrastructure (Pulwarty et al., 2010). In 2004 damages to guest rooms in Grenada from hurricanes
was equivalent to 13% of GDP (OECS, 2004). Similarly, the agricultural sector, which contributes 10-35% of Caribbean GDP, is also sensitive to climate variations. Damage to the nutmeg and cocoa industries due to hurricane Ivan in 2004 resulted in loss equivalent to 10% of Grenada’s GDP (Mimura
et al., 2007). Under future climate change, 46% of Caricom tourist resorts could be lost under a 1
m rise in sea-level (Moore, 2010; Simpson et al., 2010), while projected changes in temperature
and rainfall will likely increase crop pests and diseases and the occurrence of extreme water stress
(Nelson et al., 2009; Pulwarty et al., 2010; Simpson et al., 2010; Cashman et al., 2010). Past and future
climate impacts on other key areas of Caribbean existence, for example, biodiversity and marine and
et al., 2008) and on health and well being (e.g., Amarakoon et al., 2006; Chen et al., 2006; Ebi et al.,
2006; Taylor et al., 2009) have also been studied and shown to be significant.
It is, then, the increasing recognition that changes in the climate of the Caribbean have serious socio-economic implications for the region that has resulted in a number of recent studies focusing on providing local governments with climate change projections for adaptation and mitigation purposes. Many of these studies use coarse-resolution general circulation models (GCMs) included in the fourth assessment report (AR4) of the Intergovernmental Panel on Climate Change (IPCC)
to describe large-scale climatic changes in the region (e.g., Ángeles et al., 2007; Comarazamy and
González, 2008; Biasutti et al., 2012). More recently, a handful of studies have used high-resolution
regional climate models (RCMs) for studying climate change and its impact at spatial scales relevant
for the islands (e.g., Castro et al., 2006; Centella et al., 2008; Campbell et al., 2010; Charlery and
Nurse, 2010). In this study, we review what is now known about how the climate of the Caribbean has and will change under global warming, as can be gleaned from both available data and from existing literature. We do this for 15 island nations in the Caribbean that were studied as a part of the Caribsave (http://caribsave.org/) Climate Change Risk Atlas (CCCRA) project.
In this study, we use a subset of available model data (GCM and RCM) to provide information on the future climate of the Caribbean region. We also undertake (a) a comparative discussion of the performance of both GCMs and RCMs in simulating the 20th century (20C) climate of the Caribbean and (b) an assessment of the strengths and limitations of the climate change projections provided by both types of models. Because Caribbean station data are sparse, we rely on gridded
datasets to examine the nuances of present-day Caribbean climate (e.g., key features and spatial
variability). It is these nuances that also provide the basis for assessing model suitability for use in the region and against which climate change is evaluated.
The remainder of the paper is ordered as follows. Section 2 summarizes from literature what is known about historical climate trends in the Caribbean. Section 3 details the datasets, models and methodologies employed for the data analysis. Section 4 discusses key features of Caribbean climate as derived from the observed datasets. Sections 5 and 6 discuss 20C Caribbean climate and climate change projections based on GCM and RCM data for precipitation and surface air temperature respectively. A summary of results is presented in section 7 along with a discussion of some of their implications.
2. Observed climatic changes in the Caribbean
Historical temperature trends for the Caribbean have been shown to match global change (Frich
et al., 2002; Peterson et al., 2002; IPCC, 2007). The intra-annual extreme range has been decreasing
slightly although the trend is not significant (Peterson et al., 2002). Singh (1997) attributes the
decrease in part to increased cloud cover at night that leads to back radiation and the heating of the land. Maximum temperature is increasing with the trend significant at the 1% level. Peterson
et al. (2002) relate this to warmer sea surface temperatures (SSTs), though local SSTs only
minimum temperatures is significant at the 1% level (Peterson et al., 2002) and, as with maximum temperatures, linked to changes in SSTs, though the correlations are weaker and negative.
Precipitation also matches the global average changes (Frich et al., 2002; Peterson et al.,
2002; IPCC, 2007). Precipitation in the Caribbean is dominated by variability on annual and decadal scales. It is most closely related to SSTs in the South Caribbean Sea, and somewhat to the
tropical North Atlantic SSTs (Spence et al., 2004; Stephenson et al., 2007). Neelin et al. (2006)
show that the Caribbean is drier by 1-12 mm per month or 5-30% of rainfall per 100 years with a trend that is significant at 5% level. Singh (1997) shows a decrease in precipitation for five of the eight stations across the Caribbean, with the exceptions being the Bahamas, Venezuela and one of Trinidad’s stations. The simple daily intensity index shows a slight decrease, and although
the trend is not significant, it correlates well (0.41) with intense hurricanes (Peterson et al., 2002).
Maximum precipitation (95th percentile and above) is increasing, but it is not significant at the 10% level, probably due to the inter-annual and decadal variability. The greatest five day rain total is increasing with a significant trend at the 10% level and also displays significant inter-annual variability. The number of consecutive dry days has decreased and the trend is significant at the
1% level (Peterson et al., 2002). Additionally, Neelin et al. (2006), using station and satellite
precipitation data, show a drying trend between June and August in the Caribbean in the last few decades.
The IPCC AR4 reported an increase in global sea level at the rate of 1.8±0.5 mm/year between 1961 and 1993, and at the rate of 3.1±0.7 mm/year from 1993 to 2003 (IPCC, 2007). Sea level rise of around 1.5 to 3 mm per year (1950-2000) has been observed at tidal gauging stations around
the Caribbean making the regional trend similar to that for the globe (Church et al., 2004). Future
sea level projections are uncertain mainly owing to difficulties in predicting the melt rates of the Greenland and Antarctic ice sheets. The IPCC AR4 indicates an increase of mean global sea level by 18 to 59 cm by 2100 under the A2 emissions scenario (IPCC, 2007) with recent studies
suggesting an even more rapid increase. Simpson et al. (2010) discuss the likelihood of 1 or 2 m
sea level rise in the Caribbean under either a 2.0 or 2.5 ºC global warming scenario and how it would affect costal infrastructure in the region.
Other variables are not easily available across the Caribbean for long time periods and as such their trends have yet to be seriously studied.
3. Data, models, and methodology
Observation datasets used in this study include gridded observational and reanalysis products (see Table I). The GCMs used in this study are a part of the third phase of the Coupled Model
Intercomparison Project (CMIP3; Meehl et al., 2007) and were used in the IPCC AR4. The subset of
GCMs (15) used in this study are listed in McSweeney et al. (2010; see Table II) and are described
in more detail in Randall et al. (2007; see pp. 597-599). We refer to these models as CMIP3
models. All the GCM data are first regridded to a common 2.5 × 2.5o latitude-longitude grid before
modelling system called PRECIS (Providing Regional Climates for Impacts Studies). A detailed
description of the RCM domain and the methodology is discussed in Campbell et al. (2010) and
Centella et al. (2008). The PRECIS RCM simulations are driven by the HadAM3P and ECHAM4
GCMs (see Jones et al., 2004).
Climate change projections are calculated for the 2080s (mean of 2080-2089) for the SRES A2 scenario relative to the mean climate of 1970-1989. These two time slices are chosen because they provide maximum overlap between all the GCM and RCM data included in this study. The discussion is also limited to one scenario because of data availability at the time of writing. The SRES A2 scenario, being the high emissions scenario (IPCC, 2000), gives projections that lie towards the high-end of the range of projections based on all the available emissions scenarios. Even though all the scenarios described in IPCC (2000) are equally plausible, it has been shown that the spatial pattern of response for key variables such as temperature and precipitation is very similar across all the scenarios in this region and differs significantly only in its magnitude (Mitchell, 2003). Therefore the results presented here can be scaled to determine approximate projections for other scenarios. Table II describes the nature of information generated in this study with the help of precipitation information for Anguilla, as an example. Similar information on precipitation and
temperature for all 15 island states included in this study is tabulated in Tables S1 and S2 of the
supplementary material.
Table I. Observational datasets used in this study.
Dataset Resolution Details References
Precipitation (PRCP) Climate Research Unit
(CRU) 0.5 × 0.5
o Land-only gridded station
observations New et al., 2002
University of Delaware
(UDel) 0.5 × 0.5
o Land-only gridded station
observations Matsuura and Willmott, 2007a, b Global Precipitation
Climatology Centre (GPCC)
0.5 × 0.5o Gridded observations Rudolf and Schneider, 2005;
Rudolf et al., 2005
Climate Prediction Center Merged Analysis of Precipitation (CMAP)
2.5 × 2.5o Satellite Xie and Arkin, 1997
Tropical Rainfall Measuring Mission (TRMM)
0.25 × 0.25º Satellite Huffman et al., 2007
Sea surface temperature (SST) Hadley Centre SST
(HadISST) 1 × 1
o In situ observations and
satellite-derived estimates Rayner et al., 2003 Sea level pressure (SLP), wind speed (WSP)
4. 20th century climate of the Caribbean
4.1 Observed precipitation
From the point of view of climate change and its impacts, change in precipitation remains one of the most important parameters for the Caribbean. The islands in the Caribbean experience two distinct seasons in general: a dry season from November through April and a wet season from May through October (Granger, 1985; Taylor and Alfaro, 2006). Precipitation magnitude varies considerably from the Bahamas to the southernmost islands of the Lesser Antilles and mountainous topography and its orientation with respect to the direction of trade winds further yield large spatial variations
in precipitation on many islands (Granger, 1985; Sobel et al., 2011). A prominent feature of the
seasonal cycle of precipitation is the mid summer drought (MSD) (Magaña et al., 1999), which
is not a real drought but a period during the wet season months when precipitation is relatively lower resulting in a bimodal cycle of precipitation. The timing and duration of the MSD vary
across the Caribbean, e.g., the MSD appears in early June in parts of the eastern Caribbean and
Table II. Island-specific precipitation data. Observed and simulated means for the period 1970-1989 for all season and climate change projections based on the CMIP3 ensemble and RCM simulations for the SRES A2 scenario. This table shows results for Anguilla. Similar information is summarized in Table S1 of supplementary material for the following countries: Anguilla, Antigua and Barbuda, the Bahamas, Barbados, Cuba, Dominica, Dominican Republic, Grenada, Haiti, Jamaica, St Kitts and Nevis, St Lucia, St Vincent and the Grenadines, Trinidad and Tobago, Turks and Caicos Islands.
Season Dataset Mean
climate (mm/ month)
Projections (SRES A2 scenario) Mean
(mm/month, %) (mm/month, %)Min (mm/month, %)Median (mm/month, %)Max
Annual CMIP3
RCM–H RCM–E OBS
57.3 126.8 62.7 110.7
–9.8 (–18.4) –31.2 (–24.6) –3.6 (–5.7)
–33.9 (–55.3) –7.0 (–22.8) 7.4 (16.5)
Dry CMIP3
RCM–H RCM–E OBS
38.9 86.5 59.3 76.6
–1.4 (–5.2) –0.2 (–0.2) 0 (0)
–13.7 (–41.0) –0.2 (–1.2) 6.4 (21.5)
Wet CMIP3
RCM–H RCM–E OBS
70.4 155.5 65.0 135.1
–15.8 (–23.2) –53.3 (–34.3) –6.2 (–9.5)
–48.3 (–68.2) –10.7 (–23.2) 10.5 (18.5)
MJJ CMIP3
RCM–H RCM–E OBS
50.7 139.2 54.1 109.9
–17.1 (–32.2) –50.5 (–36.3) 3.1 (5.7)
–45.7 (–70.6) –14.2 (–24.0) –1.7 (–5.0)
ASON CMIP3
RCM–H RCM–E OBS
85.2 167.8 72.9 154.0
–14.9 (–20.0) –55.4 (–33.0) –12.8 (–17.6)
in late July around Cuba and the Bahamas and is non-existent in some eastern islands (Magaña et
al., 1999; Gamble and Curtis, 2008). Capturing the timing, duration and existence of the MSD in
the Caribbean are important measures for both observed and simulated datasets.
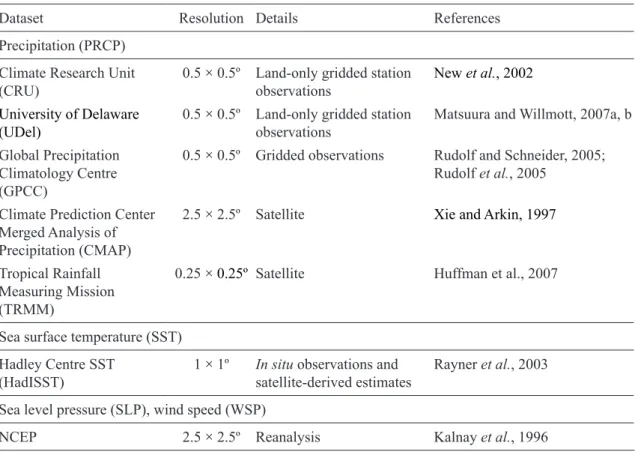
Observed (Climate Research Unit, CRU; University of Delaware, UDel; Global Precipitation Climatology Centre, GPCC) zonal mean precipitation for two latitude bands—one covering most of the Greater Antilles and the Bahamas in the western Caribbean and the other over the Lesser Antilles in the eastern Caribbean (Fig. 1)—for the period 1979-2000 is shown in Figure 2. The seasonal cycle of precipitation in the western Caribbean is predominantly bimodal in nature (Fig. 2a) with first maximum in precipitation in May or June and the second maximum between August and November. Jamaica, Haiti and Dominican Republic show precipitation peaks in May and October with a relative decrease in precipitation during the intermediate months. In the Bahamas and Cuba, precipitation peaks around June and in September with a shorter MSD period relative to the islands to their south. The double peak in precipitation can be seen at all latitudes in the western Caribbean with the second peak generally greater than the first. The seasonal cycle of precipitation over the islands in the eastern Caribbean (Fig. 2b) similarly shows a bimodal cycle for most latitudes north of about 15º N with the late wet season peak being greater than the first maximum. For islands south of 15º N, however, there is only one peak which occurs in the late wet season (Fig. 2b) and which is in part related to the inter-tropical convergence zone (ITCZ) reaching its northernmost position in those months. Since the CRU, UDel and GPCC datasets are based on the station network in the region, these maps represent precipitation over land.
Although satellite observations have limited temporal coverage they provide better spatial coverage for this region where station data is sparse. CPC Merged Analysis of Precipitation (CMAP) data are used for the period 1979-2000 and Tropical Rainfall Measuring Mission (TRMM) data for 1998-2007, in addition to the CRU and UDel data, to assess differences between the observation
84 78 72 66 60
28
24
20
16
12
8
Longitude (ºW)
Latitude (ºN)
Fig. 2. Zonal maps of observed precipitation and SSTs for the western (left panels) and eastern (right panels) Caribbean regions shown in Figure 1. Zonal maps of precipitation based on station observations (CRU, UDel, GPCC) are shown in panels (a) and (b); CMAP in (c) and (d); and TRMM in (e) and (f). Stars in (a) and (b) mark the maximum precipitation at a given latitude. Observed SSTs (HadISST) are shown in panels (g) and (h). White dotted lines mark the 26.5 ºC threshold for convection. Rough positions of the islands are marked on the plots.
Latitude (ºN)
PRCP (CRU+UDel+GPCC, 1979−2000)(70W−80W)
Haiti, Dom Rep | The Bahamas | Cuba | Jamaica
J F M A M J J A S O N D
17 18 19 20 21 22 23 24 25 26 27 [mm/day]
0 0.6 1.2 1.8 2.4 3 3.6 4.2 4.8 5.4 6
PRCP (CRU+UDel+GPCC, 1979−2000)(58W−68W)
Puerto RicoAnguilla Barbuda St Kitts & Nevis Antigua Montserrat Guadaloupe Dominica Martinique St Lucia Barbados, St Vincent The Grenadines Grenada | | | | Lesser Antilles | | | | |
J F M A M J J A S O N D
12 13 14 15 16 17 18 [mm/day] Latitude (ºN)
J F M A M J J A S O N D
18 19 20 21 22 23 24 25 26 27
[mm/day] J F M A M J J A S O N D
12 13 14 15 16 17 18 [mm/day] Latitude (ºN)
J F M A M J J A S O N D
18 19 20 21 22 23 24 25 26 27
[mm/day] J F M A M J J A S O N D
12 13 14 15 16 17 18 [mm/day] Latitude (ºN)
J F M A M J J A S O N D
18 19 20 21 22 23 24 25 26 27
[ºC] J F M A M J J A S O N D
12 13 14 15 16 17 18 [ºC]
0 1.2 2.4 3.6 4.8 6 7.2 8.4 9.6 10.8 12
(a) (b)
PRCP (CMAP, 1979−2000)(70W−80W)
0 0.6 1.2 1.8 2.4 3 3.6 4.2 4.8 5.4 6
PRCP (CMAP, 1979−2000)(58W−68W)
0 0.6 1.2 1.8 2.4 3 3.6 4.2 4.8 5.4 6
(c) (d)
PRCP (TRMM, 1998−2007)(70W−80W)
0 0.6 1.2 1.8 2.4 3 3.6 4.2 4.8 5.4 6
PRCP (TRMM, 1998−2007)(58W−68W)
0 0.6 1.2 1.8 2.4 3 3.6 4.2 4.8 5.4 6
(e) (f)
SST (HadISST, 1970−1989) (70W−80W)
24 24.5 25 25.5 26 26.5 27 27.5 28 28.5 29
SST (HadISST, 1970−1989) (58W−68W)
24 24.5 25 25.5 26 26.5 27 27.5 28 28.5 29
datasets and for comparison with simulated precipitation (section 5). All the observational products show similar variations in zonal precipitation in the north-western Caribbean (Fig. 2a, c, e). All show a bimodal precipitation cycle with a longer MSD period around the Greater Antilles (Cuba,
Jamaica, Hispaniola) region than that in the northern Caribbean (i.e., the Bahamas). In the eastern
Caribbean, however, the second maximum in precipitation in CMAP occurs in September (Fig. 2d) instead of October-November indicated by station observations (Fig. 2b). In the TRMM product the second precipitation peak occurs around October-November in the eastern Caribbean (Fig. 2f), but it does not agree well with the magnitude of observed precipitation seen in Figure 2b.
Figure 2c-f also shows that the magnitude of zonal averaged precipitation for the satellite products is lower than that for the station data since the average involves contribution from the oceans. That is, the difference likely arises from variations induced by land-surface heating and the topography. This is more so evident in the eastern Caribbean region (Fig. 2d, f), which generally has very little landmass and therefore the zonal precipitation is likely dominated by precipitation over the ocean leading to disagreements between the satellite and station observation products. Jury (2009) noted several such biases in all observational products in the Caribbean, making their use in climate model evaluation challenging.
Notwithstanding, the islands of the Greater Antilles and the fairly large islands in the Lesser Antilles such as Dominica and Martinique show regional maxima in precipitation during the wet season months (Fig. 2c, e). Many islands in the Lesser Antilles from Guadeloupe to St. Lucia also receive considerably more precipitation than the surrounding waters in the satellite products (Fig. 2d, f). In addition to precipitation that results from mid-latitude air intrusions in the dry
season (Schultz et al., 1998), mountainous topography gives rise to orographic precipitation
during the dry season months along the windward slopes of the islands. As a result, higher precipitation totals along the windward slopes and large spatial variations in precipitation
from windward to leeward slopes are observed on these islands (Reed, 1926; Smith et al.,
2009). Dominica, in particular, shows over 2-3 mm/day precipitation throughout the year with a maximum of 10-12 mm/day in November (Fig. 2b). There is consistency with the results of
Biasutti et al. (2012) who use TRMM high-resolution data to show that precipitation over the
Caribbean islands is more frequent than over the adjacent ocean during the wet season months
due to land-sea thermal contrast. Sobel et al. (2011) also demonstrate that there is a significant
increase in average island precipitation (relative to the ocean surrounding it) for large islands with mountainous topography. The authors, however, suggest that small islands receive less
precipitation than the surrounding ocean (Sobel et al., 2011).
4.2 Sea surface temperatures
One of the primary controls of seasonal precipitation in the Caribbean is SST. The tropical North Atlantic, the Caribbean Sea and the Gulf of Mexico are important sources of heat and moisture to the Caribbean. SST variability in the region affects the climate of the Caribbean, particularly in
the wet season months (May-November) (Taylor et al., 2002; Wang et al., 2008) when an increase
to values over 26.5 ºC creates conducive conditions for organized convection and widespread precipitation (Graham and Barnett, 1987).
(Fig. 2h) Caribbean. The SST threshold of 26.5ºC for convection (marked by the dashed white line) is crossed around March-April in the central Caribbean and not until May-June around the Bahamas (Fig. 2g). The timing is consistent with variations in the onset of the wet season and the first maximum in precipitation, which occur earlier in the western Caribbean and later in the northwestern Caribbean. In the eastern Caribbean, for waters surrounding the Lesser Antilles, the 26.5 ºC threshold is crossed around April and SSTs are greater than 28.5 ºC from August through November (Fig. 2h). This strong link between precipitation and SST is manifested, in part, through the influence of SST variability on the North Atlantic high-pressure system, which is discussed below.
4.3 The North Atlantic subtropical high and the Caribbean low-level jet
Though we do not illustrate it with diagrams, it is important to note that a second major control of seasonal precipitation in the Caribbean is the pressure gradient determined by the North Atlantic subtropical high (NASH) and the equatorial low-pressure band. Whereas SSTs control organized convection, the sea level pressure (SLP) variability controls the magnitude and direction of the trade winds in the Caribbean.
Wang (2007) and Wang and Lee (2007) demonstrate that the seasonal movement and changes in the intensity of the NASH are intimately linked to changes in precipitation through its relation to SSTs and influence on winds. Lowest SLP generally helps to define the wet season months. During the months of July and August, SLP increases due to a brief intrusion of the NASH, particularly in the western Caribbean. Gamble and Curtis (2008) note that this is a contributory factor to the MSD. Precipitation peaks again when the SSTs reach their maximum values and SLP its minimum value of the year for a given latitude. Note, then, that the seasonal cycle of SSTs in the Caribbean Sea has only one peak during late summer (see again Fig. 2g, h) unlike the precipitation seasonal cycle, but the seasonal cycle of local SLP has two peaks. SLP peaks in boreal winter (the dry season) and again during mid-summer and is also associated with peak intensities in easterly
trade winds in the Caribbean Sea (Wang, 2007; Amador, 2008; Muñoz et al., 2008; Whyte et al.,
2008). This latter feature is commonly known as the Caribbean low-level jet (CLLJ), which is essentially the intensified easterly trade winds along the southern flank of the NASH resulting from a large meridional pressure gradient in the region. We further note that the CLLJ also has a bimodal seasonal cycle with maxima in July and February associated with the movement of the NASH and heating over the tropical South America (Wang and Lee, 2007; Cook and Vizy, 2010). A number of studies note a strong negative correlation between Caribbean precipitation and the
strength of the CLLJ (Muñoz et al., 2008; Whyte et al., 2008; Cook and Vizy, 2010; Taylor et
al., 2012), particularly during the wet season months. An increase in the CLLJ intensity in July
is associated with a decrease in precipitation, whereas a minimum in CLLJ strength in October-November coincides with peak precipitation in the region.
5. Simulated Caribbean precipitation
5.1 Climate model performance
depends on the island’s size and topographic features (Sobel et al., 2011). This effect is small for the
small islands in the Caribbean (Chan et al., 2011; Sobel et al., 2011). Therefore, it is reasonable to
expect that the CMIP3 models should still capture the large-scale circulation features of the Caribbean. Regional climate models operational at 25 to 50 km horizontal resolution are more appropriate for studies of climate change in the Caribbean islands, but their performance also needs to be thoroughly validated against observations.
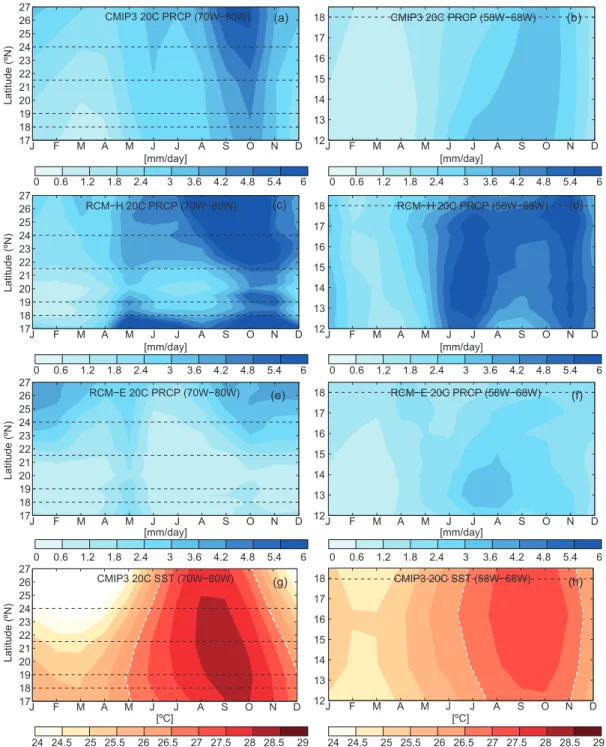
Simulated 20C precipitation in the CMIP3 models (Fig. 3a, b) can be compared with CMAP precipitation for the period of overlap 1979-1989. Comparisons between Figures 3a, 2c and 3b, 2d indicate underestimation of the CMIP3 ensemble mean precipitation relative to CMAP during the wet season in both the western as well as eastern Caribbean. Since, as noted previously, islands receive more precipitation than the surrounding waters due to the effects of land-sea thermal contrasts and topography, underestimation of precipitation by the GCMs that do not resolve these islands is expected. But even at larger spatial scales, the CMIP3 GCMs have been shown to systematically underestimate precipitation in the region (Dai, 2006). Many CMIP3 models fail to capture the first peak in precipitation seen in the region and the ones that do capture it severely underestimate precipitation during the early wet season months (not shown). In the western Caribbean, the ensemble mean precipitation shows a dry bias in Jamaica and Hispaniola (Fig. 4a), particularly in the wet season. Over Cuba and the Bahamas, CMIP3 ensemble mean shows a dry bias in the early wet season and a wet bias in the late wet season. In the eastern Caribbean, precipitation is underestimated over the Lesser Antilles from April through November (Fig. 4b). It is important to note, however, that CMAP precipitation does not agree well with other observations in this latter region (see previous section).
Sensitivity of model convection schemes to SSTs and SST underestimation in the Caribbean region (Wang and Lee, 2007) are thought to be partially responsible for the dry bias in wet season precipitation (Dai, 2006). Figure 3g, h show that although the seasonal cycle of SSTs is fairly well captured in the CMIP3 ensemble mean, the simulated SSTs are lower by about 0.5-1.5 ºC than
the observed SSTs throughout most of the year (Fig. 4g, h). This is consistent with Rauscher et al.
(2008), who show that the CMIP3 ensemble underestimates SSTs by about 1 ºC in JJA in the tropical
North Atlantic, the Caribbean Sea and the Gulf of Mexico. Rauscher et al. (2008) also demonstrate
that higher resolution GCMs have smaller precipitation bias making horizontal resolution of the models an important factor. The underestimation of precipitation in the CMIP3 ensemble is also linked to an overestimation of SLPs in the region (Fig. 5). Early wet season minimum in SLP in the western Caribbean, as shown by NCEP reanalysis data, is not well simulated in the CMIP3 ensemble mean. Notwithstanding, the semi-annual features in the local SLP and CLLJ in the Caribbean are reproduced by the CMIP3 model ensemble mean (Fig. 5) so the late wet season precipitation peak coincides with the yearly maximum in SSTs and the yearly minimum in SLPs and wind speeds. Martin and Schumacher (2011) show that all the CMIP3 models successfully capture and maintain the observed features of the CLLJ, but some have difficulty in simulating its semi-annual seasonal cycle.
bias in the early and late wet seasons. The spatial pattern of precipitation biases in the HadAM3P GCM and RCM (not shown) suggest that uncertainties in the driving model may be, to some extent, responsible for precipitation biases seen in the RCM. Nonetheless, previous studies have
CMIP3 20C PRCP (70W−80W)
J F M A M J J A S O N D
17 18 19 20 21 22 23 24 25 26 27 [mm/day] Latitude (ºN) Latitude (ºN) Latitude (ºN) Latitude (ºN)
0 0.6 1.2 1.8 2.4 3 3.6 4.2 4.8 5.4 6
CMIP3 20C PRCP (58W−68W)
J F M A M J J A S O N D
12 13 14 15 16 17 18 [mm/day]
0 0.6 1.2 1.8 2.4 3 3.6 4.2 4.8 5.4 6
RCM−H 20C PRCP (70W−80W)
J F M A M J J A S O N D
17 18 19 20 21 22 23 24 25 26 27 [mm/day]
0 0.6 1.2 1.8 2.4 3 3.6 4.2 4.8 5.4 6
RCM−H 20C PRCP (58W−68W)
J F M A M J J A S O N D
12 13 14 15 16 17 18 [mm/day]
0 0.6 1.2 1.8 2.4 3 3.6 4.2 4.8 5.4 6 RCM−E 20C PRCP (70W−80W)
J F M A M J J A S O N D
17 18 19 20 21 22 23 24 25 26 27 [mm/day]
0 0.6 1.2 1.8 2.4 3 3.6 4.2 4.8 5.4 6
RCM−E 20C PRCP (58W−68W)
J F M A M J J A S O N D
12 13 14 15 16 17 18 [mm/day] [ºC] [ºC]
0 0.6 1.2 1.8 2.4 3 3.6 4.2 4.8 5.4 6 CMIP3 20C SST (70W−80W)
J F M A M J J A S O N D
17 18 19 20 21 22 23 24 25 26 27
24 24.5 25 25.5 26 26.5 27 27.5 28 28.5 29
CMIP3 20C SST (58W−68W)
J F M A M J J A S O N D
12 13 14 15 16 17 18
24 24.5 25 25.5 26 26.5 27 27.5 28 28.5 29
(a) (b)
(c) (d)
(e) (f)
(g) (h)
Fig. 4. Precipitation biases in simulated precipitation relative to CMAP data and in SSTs relative to HadISST data for the western (left panels) and eastern (right panels) Caribbean regions shown in Fig. 1. (a, b) PRCP: CMIP3-CMAP; (c, d) PRCP: RCM-H-CMAP; (e, f) PRCP: RCM-E-CMAP; (g, h) SST: CMIP3-HadISST.
CMIP3 PRCP Bias (70W−80W)
J F M A M J J A S O N D
[mm] J F M A M J[mm]J A S O N D
−2.75 −2.25 −1.75 −1.25 −0.75 −0.25 0.25 0.75 1.25 1.75 2.25 2.75
CMIP3 PRCP Bias (58W−68W)
−2.75 −2.25 −1.75 −1.25 −0.75 −0.25 0.25 0.75 1.25 1.75 2.25 2.75
RCM−H PRCP Bias (70W−80W)
−2.75 −2.25 −1.75 −1.25 −0.75 −0.25 0.25 0.75 1.25 1.75 2.25 2.75
RCM−H PRCP Bias (58W−68W)
−2.75 −2.25 −1.75 −1.25 −0.75 −0.25 0.25 0.75 1.25 1.75 2.25 2.75
RCM−E PRCP Bias (70W−80W)
−3.41 −2.79 −2.17 −1.55 −0.93 −0.31 0.31 0.93 1.55 2.17 2.79 3.41
RCM−E PRCP Bias (58W−68W)
−3.41 −2.79 −2.17 −1.55 −0.93 −0.31 0.31 0.93 1.55 2.17 2.79 3.41
CMIP3 SST Bias (70W−80W)
−1.65 −1.35 −1.05 −0.75 −0.45 −0.15 0.15 0.45 0.75 1.05 1.35 1.65
CMIP3 SST Bias (58W−68W)
−1.65 −1.35 −1.05 −0.75 −0.45 −0.15 0.15 0.45 0.75 1.05 1.35 1.65
Latitude (ºN) 17 18 19 20 21 22 23 24 25 26 27 12 13 14 15 16 17 18
J F M A M J J A S O N D
[mm] J F M A M J[mm]J A S O N D
Latitude (ºN) 17 18 19 20 21 22 23 24 25 26 27 12 13 14 15 16 17 18
J F M A M J J A S O N D
[mm] J F M A M J[mm]J A S O N D
[ºC] [ºC] Latitude (ºN) 17 18 19 20 21 22 23 24 25 26 27 12 13 14 15 16 17 18
J F M A M J J A S O N D J F M A M J J A S O N D
shown the importance of added value of PRECIS RCM in the Caribbean (Campbell et al., 2010)
and in Central America (Karmalkar et al., 2008, 2011). Overestimation of precipitation in the late
season at higher latitudes in the western Caribbean and underestimation of precipitation in the
wet season in Jamaica and Hispaniola have been noted in Campbell et al. (2010) and can be linked
to similar biases in the driving model (HadAM3P). The RCM-H captures the bimodal nature of the precipitation cycle in Cuba, Hispaniola and Jamaica, but not in the Bahamas (Fig. 3c). In the eastern Caribbean, where observations show a single precipitation peak in November, RCM-H shows two peaks, one around June-July and the second one in November (Fig. 3d). Overall, the underestimation of precipitation in the wet season and overestimation in the dry season demonstrates the models’ difficulty in capturing the seasonal precipitation variability in the region.
5.2 Precipitation projections
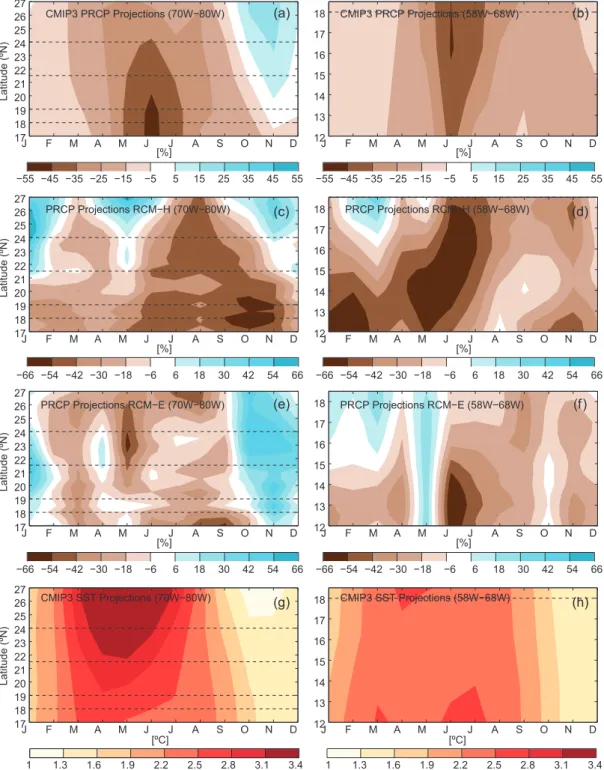
Most CMIP3 models (and therefore the ensemble median projections) indicate a decrease in
precipitation in the Caribbean under the SRES A2 scenario (Fig. 6, Table S1). Figure 6 focuses
on the wet season when the region receives most of its precipitation. The proportional decrease in precipitation is higher during the early (MJJ) than the late (ASO) wet season (Fig. 6a, b).
1 2 3 4
5 PRCP
mm/da
y
CMAP 20C TRMM CMIP3 20C CMIP3 A2
1013 1014 1015 1016 1017
1018 SLP
mb
NCEP 20C CMIP3 20C CMIP3 A2
J F M A M J J A S O N D
3 4 5 6
7 WSP
m/
s
NCEP 20C CMIP3 20C CMIP3 A2
0 1 2 3 4
5 PRCP
mm/day
CMAP 20C TRMM CMIP3 20C CMIP3 A2
1012 1013 1014 1015
1016 SLP
mb
NCEP 20C CMIP3 20C CMIP3 A2
J F M A M J J A S O N D
5.5 6 6.5 7 7.5
8 WSP
m/
s
NCEP 20C CMIP3 20C CMIP3 A2
(a) (b)
In MJJ, the CMIP3 ensemble median projections for the 2080s relative to 1970-1989 mean indicate drying by 30-40% in the western Caribbean and by 20-30% in the eastern Caribbean (Fig. 6a). In ASO, the proportional drying is 10-25% in the western Caribbean and 20% in the eastern Caribbean (Fig. 6b). Overall, the region around Haiti and Dominican Republic shows
−22 −21 −29 −30 −25 −24 −21 −18 −19 −20 −20 −21 −18
−22 −28 −30 −32 −34 −24 −25 −24 −24 −24 −24 −22 −17
−25 −26 −30 −37 −37 −33 −33 −37 −33 −30 −30 −27 −18
−34 −27 −33 −39 −37 −48 −41 −42 −33 −24 −22 −21 −18
−45 −32 −30 −37 −45 −44 −40 −36 −32 −26 −23 −23 −17
−47 −36 −27 −30 −36 −38 −31 −26 −29 −28 −30 −26 −24
−37 −23 −25 −30 −30 −32 −30 −32 −31 −29 −26 −20 −20
−18 −14 −13 −8 −14 −18 −21 −24 −25 −28 −26 −18 −16
−66 −73 −81 −76 −69 −61 −60 −56 −55 −50 −50 −57 −60
−73 −67 −66 −70 −64 −60 −63 −57 −57 −59 −62 −66 −63
−82 −68 −74 −82 −78 −76 −80 −65 −57 −67 −75 −77 −78
−85 −75 −78 −76 −81 −85 −85 −75 −70 −71 −80 −84 −86
−86 −87 −88 −90 −90 −87 −85 −80 −78 −78 −76 −77 −79
−92 −85 −83 −88 −89 −75 −75 −73 −78 −79 −78 −77 −75
−93 −82 −83 −85 −79 −74 −75 −66 −76 −81 −76 −73 −71
−70 −66 −58 −44 −41 −45 −58 −65 −69 −69 −69 −66 −65 43 19 16 13 9 12 26 31 34 46 44 31 17
23 1 3 3 3 12 18 22 20 11 8 7 4
−9 −11 −5 −9 −5 6 1 2 9 2 −9 −4 −5
−10 −6 −11 −19 −22 −21 −13 −9 −10 −5 −7 −4 3
−5 −3 −8 −15 −22 −21 −15 −6 −4 −3 −2 3 12
0 0 25 21 11 −4 −9 −8 −5 5 5 7 9
12 11 8 11 −2 −4 −6 −5 −5 −7 6 18 26
19 24 19 16 17 17 17 9 5 2 1 3 13 [2080−89(SRES A2) − 1970−89], PRCP (%), MJJ
[%]−50 −40 −30 −20 −10 0 0 10 20 30 40 50 [%]−50 −40 −30 −20 −10 10 20 30 40 50 24ºC 20ºC 16ºC 12ºC 8ºC
84ºC 78ºC 72ºC 66ºC 60ºC
(a) 24ºC 20ºC 16ºC 12ºC 8ºC
84ºC 78ºC 72ºC 66ºC 60ºC
(b)
8 6 6 0 2 4 4 1 −2 −2 −4 −6 −7
0 0 −2 −1 1 0 −3 −4 −8 −11 −10 −9 −11
−1 −4 −6 −7 −5 −3 −8 −13 −12 −11 −19 −13 −9
−3 −6 −8 −10 −8 −13 −22 −24 −18 −13 −20 −14 −13
−16 −13 −17 −15 −18 −22 −26 −22 −17 −14 −16 −16 −15
−28 −9 −14 −18 −19 −19 −25 −27 −26 −24 −19 −13 −20
−6 −16 −9 −25 −27 −29 −30 −35 −40 −34 −21 −20 −20
−3 −8 −7 −1 −1 −3 −14 −22 −28 −39 −30 −22 −18
−22 −21 −13 −8 −14 −22 −25 −27 −28 −29 −29 −28 −29
−30 −19 −15 −24 −36 −49 −52 −49 −46 −45 −43 −38 −30
−35 −25 −35 −51 −54 −73 −77 −64 −59 −56 −53 −47 −43
−50 −51 −48 −54 −62 −77 −81 −75 −72 −69 −67 −64 −69
−66 −58 −59 −65 −72 −79 −82 −78 −76 −76 −75 −74 −71
−71 −66 −69 −76 −77 −78 −71 −70 −76 −76 −68 −66 −67
−62 −75 −80 −82 −73 −60 −61 −68 −82 −82 −65 −56 −50
−54 −58 −50 −42 −45 −51 −57 −70 −82 −83 −73 −59 −48 28 32 22 16 26 38 36 35 42 44 44 45 44
22 25 22 29 32 31 25 17 12 12 16 17 13
32 32 32 41 38 29 21 13 6 9 11 13 8
39 37 30 26 26 28 23 22 29 30 25 22 19
20 19 13 12 9 13 17 23 32 36 37 41 43
20 21 11 5 3 −1 −1 0 12 16 21 33 43
23 21 24 24 14 12 10 2 1 1 5 6 13
20 19 31 36 29 25 29 23 11 7 6 33 35 [2080−89(SRES A2) − 1970−89], PRCP (%), ASON
largest decrease during both MJJ and ASO. In contrast there are relatively small changes in the northern Bahamas. Although there is a general agreement between models on the sign of change, the model projections across the CMIP3 ensemble range from –80 to +5%.
Large projected decreases in precipitation in the early wet season smooth out the bimodality in the western Caribbean in the ensemble mean projections (Fig. 5, top left panel), but the shape of the seasonal cycle remains unchanged in the eastern Caribbean (Fig. 5, top right panel). The dry season experiences very little proportional decrease in precipitation in the Caribbean under the SRES A2 scenario, while there is a small increase in precipitation in November in the northwest Caribbean in the Bahamas.
Both RCM simulations project a decrease in precipitation in the early and late dry season
(Fig. 7c, f; also see Table S1), but the magnitude of change is very different with RCM-H
projecting much higher decrease than the RCM-E. Projected changes in precipitation throughout the year are also very different in the two RCM simulations. RCM-H projects year-round decrease in precipitation in Jamaica and Hispaniola whereas the RCM-E indicates small increases between November and January in this region (Fig. 7c, e). The Bahamas islands, in both RCM simulations, are projected to experience wetter conditions in the dry season. In the eastern Caribbean the agreement between the two RCM projections is poor (Fig. 7d, f).
Local SSTs in both the western and eastern Caribbean are projected by the CMIP3 ensemble to increase by about 1-3.5 ºC by the 2080s relative to 1970-89 mean under the SRES A2 scenario (Fig. 7g, h). In general, the SST warming is higher in the months from March through July in the western Caribbean with largest increase in the northwestern Caribbean around the Bahamas. Though warmer SSTs may seem incongruous with the strong projected drying during this period, Taylor
et al. (2011, 2012) argue that it is SST gradients across the tropical oceans that are important. SSTs
in the tropical North Atlantic and the Caribbean Sea are projected to increase less compared to other tropical regions (Vecchi and Soden, 2007) due to the influence of northeast trades (Leloup and Clement, 2009). Therefore, the waters surrounding the Lesser Antilles warm less compared to the Gulf of Mexico and waters surrounding the Bahamas (Fig. 7h). These variations have been
shown to play a role in wet season drying projected by the models (Rauscher et al., 2011). We also
note that the projected decrease in early summer (May-August) precipitation has been shown to be related to low-level divergence in the Caribbean associated with an early intrusion of NASH in the
region (Rauscher et al., 2008) and strengthening of low-level easterlies (Vecchi and Soden, 2007;
Cook and Vizy, 2010, Taylor et al., 2012). A projected precipitation decrease in the early wet season
could also be associated with the southward displacement of the ITCZ (Rauscher et al., 2008).
6. Simulated surface air temperature (SAT)
6.1 Climate model performance
The Caribbean, being in the tropical belt, experiences very little variation in temperatures during the course of a year. Daily temperature range is slightly higher than the annual range, which varies between 2 and 5.5 ºC from southern Caribbean to Cuba (Granger, 1985). A comparison of simulated SAT with observations shows that the CMIP3 models have a cold bias for all the small islands that
are not resolved in the coarse-resolution GCMs (Table S2). This is so because the CMIP3 models
CMIP3 PRCP Projections (70W−80W)
J F M A M J J A S O N D
17 18 19 20 21 22 23 24 25 26 27 [%]
−55 −45 −35 −25 −15 −5 5 15 25 35 45 55
CMIP3 PRCP Projections (58W−68W)
J F M A M J J A S O N D
12 13 14 15 16 17 18 [%]
−55 −45 −35 −25 −15 −5 5 15 25 35 45 55
(a) (b)
PRCP Projections RCM−H (70W−80W)
J F M A M J J A S O N D
17 18 19 20 21 22 23 24 25 26 27 [%]
−66 −54 −42 −30 −18 −6 6 18 30 42 54 66
PRCP Projections RCM−H (58W−68W)
J F M A M J J A S O N D
12 13 14 15 16 17 18 [%]
−66 −54 −42 −30 −18 −6 6 18 30 42 54 66
(c) (d)
PRCP Projections RCM−E (70W−80W)
J F M A M J J A S O N D
17 18 19 20 21 22 23 24 25 26 27 [%]
−66 −54 −42 −30 −18 −6 6 18 30 42 54 66
PRCP Projections RCM−E (58W−68W)
J F M A M J J A S O N D
12 13 14 15 16 17 18 [%]
−66 −54 −42 −30 −18 −6 6 18 30 42 54 66
(e) (f)
CMIP3 SST Projections (70W−80W)
J F M A M J J A S O N D
17 18 19 20 21 22 23 24 25 26 27
1 1.3 1.6 1.9 2.2 2.5 2.8 3.1 3.4
CMIP3 SST Projections (58W−68W)
J F M A M J J A S O N D
12 13 14 15 16 17 18
1 1.3 1.6 1.9 2.2 2.5 2.8 3.1 3.4
(g) (h) [ºC] [ºC] Latitude (ºN) Latitude (ºN) Latitude (ºN) Latitude (ºN)
such as Jamaica, Hispaniola and Cuba, the ensemble mean SATs show a warm bias (Table S2). For the small islands, the RCM simulations show a warm bias with RCM-E consistently showing
a larger bias in all seasons compared to RCM-H (Table S2).
All the islands in the Caribbean show statistically significant increasing SAT trends from 1970-2006 except for some parts of Cuba, where the SAT trends are slightly negative (not shown). Trends in observed mean annual SAT for the period 1970-89 are positive but not statistically significant for all islands. CMIP3 ensemble mean, however, shows statistically increasing SAT trends for this
period, which are generally smaller than the observed trends (Table S2). RCM simulations also
show increasing SAT trends, but they are not always statistically significant.
6.2 SAT projections
Spatial maps of projected changes in SAT based on the CMIP3 multi-model ensemble for the SRES A2 scenario show higher warming in the northwestern Caribbean and relatively lower warming in the southeastern Caribbean (Fig. 8a). Note that Figure 8a shows a range of projections spanned by the CMIP ensemble, in addition to ensemble mean and median projections. Mean annual warming ranges from 2.4 ºC in the eastern Caribbean to about 2.9 ºC over Cuba in the western Caribbean. Although the magnitudes are different, this spatial pattern of warming is consistent throughout the year. We note again that the small islands of the Lesser Antilles are not represented in the CMIP3 models, and therefore projections discussed here simply describe warming over water. The multi-model spread in SAT projections is about 1-1.5 ºC in the region and is, in general, higher for land grid-boxes than those over water.
It is expected that the RCM simulations will indicate higher warming over land than water given the better representation of the landmass at 50 km model resolution. The available RCM simulations show a similar spatial pattern of warming as the CMIP3 multi-model ensemble but with higher warming over the bigger islands (Cuba, Hispaniola, and Jamaica) (Fig. 8b, c). Between the RCMs, the simulation driven by ECHAM4 projects higher increases in mean annual and seasonal SAT than that driven by HadAM3P. Furthermore, mean annual warming indicated by the RCM-E projections is higher than any models in the CMIP3 ensemble for all the islands in the Caribbean
included in this study (Table S2). RCM-H projections are similarly higher compared to median
projections of the CMIP3 ensemble for all islands except Trinidad and Tobago, Turks and Caicos and Grenada. The RCM projections also show that smaller islands in the Lesser Antilles that are resolved in RCM simulations (Dominica, Martinique, St. Lucia and Barbados) show slightly more warming than that over the surrounding waters.
Finally, early wet season warming in the CMIP3 ensemble seems to be closely related to projected
drying during these months (see Table S2) with higher warming and more drying for big islands
such as Cuba and Jamaica. The relationship is not so evident for other seasons. ECHAM-driven PRECIS simulation also projects higher warming and less drying under the SRES A2 scenario compared to CMIP3 ensemble and RCM-H projections.
7. Summary and discussion
for the island nations using the model data and other sources. The CMIP3 models underestimate the present day precipitation of the islands of the Caribbean. This might be attributable to their inability to resolve the smaller islands, particularly in the eastern Caribbean. However, since many of the CMIP3 models also fail to capture or severely underestimate the first peak in the bimodal precipitation signal, and this early season maximum is primarily a feature of the larger islands of the western Caribbean region, it suggests other deficiencies. Though we do not discuss it in this paper, the models seem to generally underestimate local SSTs and in particular the early onset of the Atlantic warm pool (Wang, 2007) in the western Caribbean. The models do however capture the late season maximum of SST as well as the annual cycles of local SLP and the CLLJ—two other important drivers of Caribbean climate—and so correctly time the occurrence of the late season maximum in Caribbean rainfall. On the other hand, the PRECIS RCM simulations show varied performance with one mostly overestimating precipitation and the other underestimating it in the wet season. The uncertainties in the driving models are seemingly responsible for some
Fig. 8. Projected change in mean annual surface air temperature (ºC) by the 2080s under the SRES A2 scenario in (a) CMIP3 multi-model ensemble, (b) RCM-H and (c) RCM-E. Projected change by the 2080s is relative to the mean climate of 1970-1989. In (a) for every grid box, the color indicates ensemble mean projection, the value at the center indicates ensemble median projection and values at the bottom-left and top-right corners indicate ensemble minimum and maximum projections, respectively.
2.9 2.9 3.1 2.8 2.7 2.7 2.7 2.8 2.8 2.8 2.8 2.7 2.7
2.8 2.8 2.9 2.7 2.7 2.6 2.7 2.7 2.7 2.6 2.6 2.6 2.6
2.7 2.8 2.9 2.9 2.8 2.6 2.7 2.7 2.5 2.5 2.4 2.4 2.4
2.7 2.7 2.7 2.7 2.8 2.7 2.8 2.5 2.5 2.5 2.5 2.4 2.4
2.9 2.6 2.6 2.5 2.5 2.5 2.5 2.5 2.5 2.4 2.4 2.4 2.4
3.5 2.9 2.6 2.5 2.5 2.5 2.6 2.5 2.5 2.5 2.4 2.5 2.4
3.3 3.1 2.9 2.8 2.9 3.2 3.2 3 2.9 2.9 2.8 2.6 2.6
2.9 3.1 3.1 3.1 3.3 4 4.2 4.2 4.1 3.6 3.2 2.9 2.7
2.1 2.2 2.2 2.1 2 2.1 2.2 2.2 2.2 2.1 2.1 2.1 2.1
2.1 2.1 2.2 2.2 2.1 2 2.1 2.1 2.1 2.1 2.1 2 2
2.2 2.1 2.2 2.2 2.2 2.1 2.1 2.1 1.9 1.9 1.9 1.9 1.9
2 2 2 2 2 2 2.1 1.9 1.8 1.8 1.8 1.7 1.7
2.1 1.9 1.9 2 1.9 1.9 1.9 1.8 1.8 1.7 1.6 1.6 1.5
2.4 2 1.7 1.6 1.6 1.6 1.5 1.6 1.6 1.6 1.6 1.6 1.6
2.1 1.9 1.7 1.6 1.8 2 2.1 2.1 1.9 1.6 1.8 1.7 1.8
2 2.2 2.3 2.3 2.4 2.4 2.4 2.5 2.6 2.5 2.4 2.1 2.1
3.2 3.5 3.6 3.2 3.1 3 3.1 3.1 3 3.1 3.2 3.3 3.3
3 3.2 3.6 4 3.4 2.9 2.9 2.9 2.9 3 3 3 3.1
3 3 3.5 4.1 4 3.7 3.4 2.9 3 3 2.9 2.9 3
2.9 3 3.1 3 3.2 3.3 3.1 3 3 3 3 3 3.1
4.2 3.8 3.1 3.1 3.1 3.1 3.1 3.1 3 3 3.1 3.1 3.1
5 4.3 3.2 3.1 3.1 3.1 3.1 3.1 3.1 3.1 3.1 3.1 3.2
4.4 4.1 3.2 3.2 3.5 3.7 4 4.2 4.2 4.1 3.8 3.3 3.2
3.5 4.1 4.2 3.8 4.8 5.5 5.5 5.5 5.3 5.2 4.7 3.7 3.3
2 2.25 2.5 2.75 3 3.25 3.5 3.75 4 (a) 2 2.5 3 3.5 4 4.5 5 5.5 6 2 2.5 3 3.5 4 4.5 5 5.5 6 (b) (c)
[2080−89(SRES A2) − 1970−89], SAT (ºC), ANN
[2080−89(SRES A2) − 1970−89], RCM−H SAT (ºC), ANN [2080−89(SRES A2) − 1970−89], RCM−E SAT (ºC), ANN 24º N 24º N 20º N 16º N 12º N 8º N 24º N 20º N 16º N 12º N 8º N 20º N 16º N 12º N 8º N 84º W
84º W 78º W 72º W 66º W 60º W 84º W 78º W 72º W 66º W 60º W
84º W 84º W 84º W 60º W
[ºC]
of the precipitation biases. The Hadley driven RCM, however, does capture the bimodal nature of the precipitation cycle in the western Caribbean (Cuba, Hispaniola and Jamaica), which makes a
case for added value by the RCM (Campbell et al., 2010). Yet, even for the RCM, with its better
resolution, there is some difficulty in capturing the seasonal precipitation variability in the region. With respect to surface air temperatures, the CMIP3 models display a cold bias for all the small islands that are not resolved in the coarse-resolution but a warm bias for the larger islands that are resolved. The RCM simulations show a warm bias across the entire region, especially the eastern Caribbean islands which are better resolved.
The end of century picture of Caribbean climate, as deduced from the CMIP3 models is one characterized by a decrease in wet season precipitation. The decrease is generally higher for the early wet season than the late wet season and for the western Caribbean than the eastern Caribbean. The intense early season drying tends to smooth out the bimodality of the western Caribbean, but the seasonal cycle of the eastern Caribbean remains unchanged. The dry season is largely unaltered except for a small increase in precipitation in November in the Bahamas. The RCM simulations similarly project a drying (though more intense) for the wet season but the agreement between the two RCM projections is generally poor with respect to which portion (early or late) will be driest. Both the GCMs and the RCM project higher warming of surface air temperatures over the northwestern Caribbean and relatively lower warming in the southeastern Caribbean. The RCMs however have higher warming values in general, especially over the eastern Caribbean where the landmasses are better resolved.
In addition to the results above, a few other things bear noting. Firstly, most regions in the Caribbean present a bimodal seasonal cycle of precipitation, which results from the interaction between the NASH, the CLLJ, regional wind shear, local divergence, subsidence and the upper level atmospheric dynamics (Gamble and Curtis, 2008). Capturing of the cycle is a useful determinant of model or dataset suitability for use in the Caribbean since it would also suggest that the regional driving forces are also being reasonably captured. Equally important, then, is being able to accurately characterize the bimodality. Future work must include an examination of daily data, both observed and simulated, to determine, for example, the exact timing of the onset and end of the wet season and the duration of the MSD. This information is also vital for water resource management and agricultural activities in the region. We also note that whereas many of the physical processes affecting climate of the Caribbean are well studied and documented in the literature, easterly waves are not well discussed in the context of their significant contribution to Caribbean rainfall. There is need for further investigation of easterly waves in both current and future climates.
Secondly, although the GCM precipitation projections span a very wide range across the ensemble, most GCMs project a decrease in precipitation under the SRES A2 scenario by the 2080s. This drying is thought to be related to several interdependent factors such as expansion and
intensification of the NASH (Rauscher et al., 2008), an increase in wind speeds over the Caribbean
Sea (Cook and Vizy, 2010; Taylor et al., 2011, 2012), SST warming in the tropical North Atlantic
(Rauscher et al., 2011), and a decrease in precipitation in regions along the margins of convective
areas in the tropics (Chou and Neelin, 2004; Neelin et al., 2006). The RCM used in this study
gives very different results when driven by boundary conditions from two different GCMs. This highlights the need to use an ensemble of model simulations that provide a range of projections taking into account various modeling uncertainties. Such a setup is now available for the RCM used
the RCM (50 km) is still not sufficient to resolve many small islands in the Caribbean, the suite of models should include some with 10 km or better resolution to fully resolve the smallest islands.
Thirdly, the performance of the individual GCMs included in the ensemble is not taken into account while calculating the ensemble mean. The ensemble mean and median have been shown
to match observations better than any individual models (Gleckler et al., 2008), but using equal
weights in ensemble mean calculations is problematic due to intermodel relationships (Masson and Kuntti, 2011). A worthwhile exercise would be to evaluate individual models in the region before using them for projections. Rigorous model evaluation however requires reliable observed data. Gridded observed (station and satellite) precipitation products used in this study show several disagreements (also shown in Jury, 2009); therefore making model evaluation challenging.
Fourthly, interannual variations in the seasonal cycle of climate parameters described above are large in the Caribbean, mainly resulting from climate variability in the eastern Pacific and
the North Atlantic (Enfield and Alfaro, 1999; Giannini et al., 2000, 2001; Chen and Taylor,
2002; Taylor et al., 2002; Jury et al., 2007). El Niño Southern Oscillation (ENSO) (Enfield and
Alfaro, 1999; Giannini et al., 2000; Taylor et al., 2002; Gouirand et al., 2012) and the North
Atlantic Oscillation (Charlery et al., 2006; Jury et al., 2007; Gouirand et al., 2012) have seasonally
dependent influence on temperature and precipitation. Changes, then, in ENSO and NAO variability in the future will affect climate variability in the Caribbean. The regional model PRECIS performed reasonably well in capturing the interannual variability in Central American temperature because the baseline simulations used observed SSTs as the surface boundary conditions and therefore
a realistic ENSO forcing (Karmalkar et al., 2011). However, the global climate models used in
this study show a varying degree of performances when tested for their ability to capture ENSO variations and disagree significantly on its future behavior (AchutaRao and Sperber, 2006).
Studies that suggest a perpetual El Niño-like state for the Pacific in the future (Vecchi et al.,
2006; Vecchi and Soden, 2007; DiNezio et al., 2009) are consistent with a summer drying in the
Caribbean. However, the nature of ENSO and NAO variations in response to elevated levels of GHGs remains highly uncertain and is a limitation to examining future changes in interannual variability of Caribbean climate.
Finally, although the RCM simulations add regional detail to climate simulations produced by the GCMs in this region, the RCMs use dynamical downscaling techniques making their performance critically dependent on the quality of the driving GCM. These results indicate that, for spatial scales in question, improvements in model physics may contribute perhaps as much to our understanding of climate of the Caribbean as dynamical downscaling to 50 km resolution. For example, considering the major influence of SSTs on the climate of the Caribbean and on simulated precipitation, accurate representation of SSTs in the models could improve their performance. The dynamical downscaling using PRECIS RCM uses prescribed SSTs, but a model set-up in which SSTs are allowed to dynamically interact with and respond to changes in the overlaying atmosphere has
been shown to perform better at simulating precipitation in other parts of the world (Artale et al.,
2009; Ratnam et al., 2009). Such RCM studies are, however, non-existent for the Caribbean region.
Acknowledgement
contributions to the modeling efforts in the region. We thank Gil Lizcano and Carol McSweeney for their help with data management and processing.
References
AchutaRao K. M. and K. R. Sperber, 2006. ENSO simulation in coupled ocean-atmosphere models:
Are the current models better? Clim. Dyn.2, 1-15, doi:10.1007/s00382-006-0119-7.
Amador J. A., 2008. The Intra-Americas sea low-level jet: Overview and future research. Annal.
N.Y. Acad. Sci.1146, 153-188.
Amarakoon D. A., A. A. Chen, S. C. Rawlins, M. A. Taylor and D. D. Chadee, 2006. Retrospective
study. In Climate change impact on dengue: The Caribbean experience. (A. A. Chen, D. D.
Chadee and S. Rawlins, eds.). Mona, Jamaica: University of the West Indies, Climate Studies Group Mona, 66-77.
Ángeles M. E., J. E. González, D. J. Erickson III, J. L. Hernández, 2007. Predictions of future
climate change in the Caribbean region using global general circulation models. Int. J. Clim.
27, 555-569, doi:10.1002/joc.1416.
Artale V. S., A. C. Calmanti, A. Dell’Aquila, M. Herrmann, G. Pisacane, P. M. Ruti, G. Sannino, M. V. Struglia, F. Giorgi, X. Bi, J. S. Pal, S. Rauscher and The PROTHEUS Group, 2009. An atmosphere ocean regional climate model for the Mediterranean area: Assessment of a present
climate simulation. Clim. Dyn.35, 721-740, doi:10.1007/s00382-009-0691-8.
Biasutti M., A. H. Sobel, S. J. Camargo and T. T. Creyts, 2012. Projected changes in the physical
climate of the Gulf coast and Caribbean. Climatic Change112, 819-845.
Campbell J. D., M. A. Taylor, T. S. Stephenson, R. A. Watson and F. S. Whyte, 2010. Future climate
of the Caribbean from a regional climate model. Int. J. Clim. 31, 1866-1878, doi:10.1002/joc.2200.
Cashman A., L. Nurse and J. Charlery, 2010. Climate change in the Caribbean: The water
management implications. The Journal of Environment & Development 19, 42-67.
Castro D. M., R. P. da Rocha, A. Benzanilla-Morlot, L. Álvarez-Escudero, J. P. Reyes-Fernández, Y. Silva-Vidal and R. W. Arritt, 2006. Sensitivity studies of the RegCM3 simulation of summer
precipitation, temperature and local wind field in the Caribbean region. Theor. Appl. Climatol.
86, 5-22, doi:10.1007/s00704-005-0201-9.
Centella A., A. Bezanilla and K. Leslie, 2008. A study of the uncertainty in future Caribbean climate using the PRECIS regional climate model. Technical report. Belmopan, Belize: Caribbean Community Climate Change Centre (CCCCC).
Chan S. C., V. Misra and H. Smith, 2011. A modeling study of the interaction between the Atlantic
warm pool, the tropical Atlantic easterlies, and the Lesser Antilles. J. Geophys. Res. 116,
D00Q02, doi:10.1029/2010JD015260.
Charlery, J., L. Nurse and K. Whitehall, 2006. Exploring the relationship between the North Atlantic
Oscillation and rainfall patterns in Barbados. Int. J. Clim. 26, 819-827.
Charlery J. and A. Nurse, 2010. Areal downscaling of global climate models: an approach that
avoids data remodeling. Clim. Res.43, 241-249, doi:10.3354/cr00875.
Chen A. A. and M. A. Taylor, 2002. Investigating the link between early season Caribbean rainfall
and the El Niño+1 year. Int. J. Climatol.22, 87-106.
Chen A. A., D. D. Chadee and S. Rawlins (eds.), 2006. Climate change impact on dengue: The
Caribbean experience. Mona, Jamaica: Climate Studies Group Mona, University of the West
Chen. A., M. Taylor, A. Centella and D. Farrell, 2008. Climate trends and scenarios for climate change in the insular Caribbean: Report of Working Group I, Climate Change and Biodiversity
in the Insular Caribbean. CANARI Technical Report No. 381. Trinidad, W.I.: Caribbean Natural
Resources Institute, 63 pp.
Chou C. and J. D. Neelin, 2004. Mechanisms of global warming impacts on regional tropical
precipitation. J. Clim.17, 2688-2701.
Church J. A., N. White, R. Coleman, K. Lambeck and J. Mitrovica, 2004. Estimates of regional
distribution of sea level rise over the 1950-2000 period. J. Clim. 17, 2609-2625.
Comarazamy D. E. and J. E. González, 2008. On the validation of the simulation of early season
precipitation on the island of Puerto Rico using a mesoscale atmospheric model. J. Hydrometeor.
9, 507-520.
Cook K. and E. Vizy, 2010. Hydrodynamics of the Caribbean low-level jet and its relationship to
precipitation. J. Clim.23, 1477-1494.
Dai A., 2006. Precipitation characteristics in eighteen coupled climate models. J. Clim. 19, 4605-4630.
DiNezio P., A. Clement, G. A. Vecchi, B. J. Soden, B. Kirtman and S. K. Lee, 2009. Climate
response of the equatorial Pacific to global warming. J. Clim.22, 4873-4892.
Donner S. D., T. R. Knutson and M. Oppenheimer, 2007. Model-based assessment of the role of
human-induced climate change in the 2005 Caribbean coral bleaching event. Proc. Natl. Acad.
Sci.U.S.A.104, 5483-5488.
Ebi, K. L., N. D. Lewis and C. Corvalán, 2006. Climate variability and change and their potential health effects in small island states: Information for adaptation planning in the health sector.
Environ. Health Perspect.114, 1957-1963.
Enfield D. B. and E. J. Alfaro, 1999. The dependence of Caribbean rainfall on the interaction of
the tropical Atlantic and Pacific oceans. J. Clim.12, 2093-2103.
Fish M. R., I. M. Cote, J. A. Gill, A. P. Jones, S. Renshoff and A. Watkinson, 2005. Predicting the
impact of sea level rise on Caribbean sea turtle nesting habitat. Conserv. Biol. 19, 482-491.
Frich P., L. V. Alexander, P. Della-Marta, B. Gleason, M. Haylock, A. M. G. Klein Tank and T. Peterson, 2002. Observed coherent changes in climatic extremes during the second half of the
twentieth century. Clim. Res.19, 193-212.
Gamble D. W. and S. Curtis, 2008. Caribbean precipitation: review, model and prospect. Prog.
Phys. Geo.32, doi:10.1177/0309133308096027.
Giannini A., Y. Kushnir Y and M. A. Cane, 2000. Interannual variability of Caribbean rainfall,
ENSO, and the Atlantic Ocean. J. Clim.13, 297-311.
Giannini A., Y. Kushnir and M. A. Cane, 2001. Seasonality in the impact of ENSO and the North
Atlantic high on Caribbean rainfall. Phys. Chem. Earth Part B26, 143-147.
Gleckler, P. J., K. E. Taylor and C. Doutriaux, 2008. Performance metrics for climate models,
J. Geophys. Res. 113, D06104, doi:10.1029/2007JD008972.
Gouirand I., M. R. Jury and B. Sing, 2012. An analysis of low- and high-frequency summer climate
variability around the Caribbean Antilles. J. Clim.25, 3942-3952.
Graham N. E. and T. P. Barnett, 1987. Sea surface temperature, surface wind divergence, and
convection over tropical oceans. Science238, 657-659.
Granger O. E., 1985. Caribbean climates. Prog. Phys. Geog.9, 16-43.