Commentary
Measuring the Load,
Easing the Burden
Ross Finnie
w w w . c d h o w e . o r g N o . 1 5 5 , N o v e m b e r 2 0 0 1
In this issue...
Canada's system of loans to college and university students works better than many critics believe, but an expanded program is needed as part of a package to revitalize postsecondary education in Canada.
Canada’s Student Loan Programs
and the Revitalization of Canadian
Postsecondary Education
Postsecondary education is of increasing importance to both Canada’s international competitiveness and individuals’ career success. Are the Canada Student Loans Program and its provincial counterparts doing a good job of enabling Canadians to pursue college or university education without undue financial stress?
The most recent data available (the class of 1995) indicate that fewer than half of all college and university graduates held student loans, that two years after graduation individuals had paid back an average of 40 percent (or more) of these debts, and that only 10 to 15 percent of all graduates reported difficulties with repayment. An updating of the record to the present would likely yield only moderate changes to this profile.
The general picture is, therefore, quite good — at least in terms of current debt levels not being overly burdensome for most graduates. But the system could certainly be improved. Policymakers should consider:
• increasing the eligibility for and limits on student loans for those who need the money;
• further expanding current interest-relief and debt-reduction programs for individuals who face repayment hardship, a group that includes not only many unemployed but also part-time and even full-time workers in lower-paying jobs;
• favoring assistance to most students in the form of loans, while targeting grants on those from low-income families for whom debt aversion is a significant problem;
• enabling further research into how many Canadians have been able to pursue postsecondary education because of student loans and, conversely, how many potential candidates have not studied because they could not get loans, could not borrow enough, or were unwilling to take on the debt load. Policymakers should also inject resources into the badly strapped postsecondary education system through a “revitalization social contract.” Each principal stakeholder — the federal government,
provincial governments, and students themselves — would put an additional $1,000 per capita into the system. Students would pay their share through increased tuition, but those who needed aid would receive assistance through grants and the enhanced loans program proposed in this Commentary.
The Author of This Issue
Ross Finnie is a Research Fellow and Adjunct Professor in the School of Policy Studies at Queen’s
University, Kingston, Ontario.
C.D. Howe Institute Commentary©is a periodic analysis of, and commentary on, current public policy issues. The manuscript was copy edited by Lenore d’Anjou and prepared for publication by Marie Hubbs and Barry A. Norris. As with all Institute publications, the views expressed here are those of the author, and do not necessarily reflect the opinions of the Institute’s members or Board of Directors.
To order this publication, please contact: Renouf Publishing Co. Ltd., 5369 Canotek Rd., Unit 1, Ottawa K1J 9J3 (tel.: 613-745-2665; fax: 613-745-7660), Renouf’s store at 71½ Sparks St., Ottawa (tel.: 613-238-8985), or the C.D. Howe Institute, 125 Adelaide St. E., Toronto M5C 1L7 (tel.: 416-865-1904; fax: 416-865-1866; e-mail: [email protected]).
F
or almost 30 years, the Canada Student Loans Program (CSLP) and its provincial counterparts have helped millions of Canadians attend college or university and thereby achieve major career and life goals. But this system has never been beyond criticism. An important set of recent concerns focuses on borrowing levels and debt loads. Tuition fees have increased substantially over the past decade or so, while students appear to have been borrowing more, facing greater debt burdens, paying off their loans more slowly, and defaulting on their loans in larger numbers than ever before.1These developments are creating fears that:
• access to the Canadian postsecondary system is suffering;
• individuals are forgoing, delaying, or slowing down their studies;
• students’ choices regarding field of study, which institution to attend, part-time versus full-time enrollment, outside work during school, and going on to graduate school are also being affected; and
• young people from lower socioeconomic backgrounds are being hit the hardest, thus relating the opportunity of going on to college or university increasingly to family background, rather than the ability to do the work and the desire to succeed.
Furthermore, these issues are arising at a time when a highly skilled labor force is of unprecedented importance to the country’s productivity and international competitiveness in the new knowledge-based global economy, and when the value of a postsecondary education appears to be greater than ever, with college and university graduates largely holding their own while the fortunes of those with less schooling are in steady decline.
In short, student debt issues strike at the heart of the twin concerns of opportunity (or social justice) and the nation’s economic performance as they relate to one of Canada’s central social programs — a powerful context for any related policy discussion. The issues are real and important. Not surprisingly, debates abound.
To help to put these debates on a firmer factual footing, this Commentary summarizes the results of an empirical analysis of the borrowing and repayment patterns of four recent cohorts of postsecondary graduates.2It then addresses a
The research reported in this Commentary was made possible by financial support received from the Canada Student Loans Program Branch of Human Resources Development Canada. Assistance from the Social Sciences and Humanities Research Council of Canada for earlier phases of this research is also gratefully acknowledged. Gaétan Garneau carried out all the data calculations, and his typically excellent work is greatly appreciated. Very helpful comments were received from David Cameron, David Laidler, Herb O’Heron, Bill Robson, David Stager, Alex Usher, and Bob Young. Lenore d’Anjou did a superb job of copy editing. Some of this paper represents the extension of earlier research carried out with Saul Schwartz of the School of Public Administration at Carleton University and thus owes a considerable debt to that very agreeable and productive collaboration.
1 For general discussions of the student loan system, see AUCC (1993); Cameron (1995); Cook and Stager (1969); Duncan (1993); Finnie and Schwartz (1996); Kesselman (1993); Stager (1985; 1989); Stager and Derlach (1992); and West (1993).
2 In this respect, the paper updates and extends some of my previous work: Finnie (1994); Finnie and Garneau (1996a; 1996b); Finnie and Schwartz (1996); Schwartz and Finnie (forthcoming).
number of related policy issues that, taken together, constitute a general plan for providing future assistance to Canadian students that focuses on an improved and expanded loan system, rather than on the wholesale increases in grants (or lower tuition fees) that many commentators have been calling for. Finally, the study floats an idea for revitalizing the cash-strapped postsecondary system with infusions from governments, both federal and provincial, and from students themselves, the latter facilitated by the recommended changes in the loans system.
The Commentary should, therefore, interest anyone concerned with students’ economic situation and their access to the postsecondary system; anyone more narrowly interested in the performance of the CSLP and the related provincial lending programs, including advocates of reform of these programs; and anyone who sees a need to breathe fresh life into Canada’s postsecondary education system after a decade or so of fiscal constraint and declining quality.
The Student Loans System: How and Why
To provide a context for the analysis of borrowing and repayment patterns and the associated policy issues that follows, this section briefly explains how student loan programs have worked in Canada and provides a brief primer on why such a public system is required.3
How Does the Student Loans System Work?
As noted earlier, the country’s student loans system is anchored by the Canada Student Loans Program. Since the early 1960s, it, along with its increasingly
important provincial counterparts, has guaranteed loans made by private financial institutions to qualifying students.
Eligibility
Loan eligibility is based on need assessments carried out by the provinces. The calculation begins with an individual’s direct educational costs (tuition, books, and so on) plus an allowance for living and related expenses. These costs are then compared to an estimate of the student’s resources, including expected savings from summer jobs, presumed parental contributions, scholarships and bursaries, and other sources. If a student’s assessed need exceeds the estimated resources, he or she is awarded a loan certificate up to the allowable maximum (see below). The student can then decide to take the certificate to a participating financial institution and obtain a loan. Such institutions cannot refuse a loan for which a certificate has been issued. This policy ensures that access to the system is controlled by the government and is based on need, not on a student’s creditworthiness.
Until 1994, need-assessment procedures and the packaging of CSLP and provincial assistance (loans and grants) varied considerably across provinces. Reforms instituted in the 1995/96 academic year resulted in substantially greater standardization, especially in the calculations of need assessment. But differences
3 This section borrows heavily from Finnie and Schwartz (1996).
The Commentary should interest anyone who sees a need to breathe fresh life into Canada’s postsecondary education system after a decade or so of fiscal constraint and declining quality.
remain, particularly in the mix of federal and provincial funding. Further coordination is currently being negotiated as part of a general set of federal-provincial agreements on student loans.
The provinces determine which educational institutions are certified for student loans. Although virtually all public colleges and universities are covered, considerably more variation exists for vocational institutes, especially private ones, which have received considerable recent attention because of the high default rates sometimes associated with their graduates.4
Loan limits specify the maximum amount students can borrow for each week of school. The CSLP limit in the early 1980s was $50 per week, rose in 1983 to $100, inched up in 1992 to $105, and then in 1994 increased to $165. It has remained at that level ever since. Thus, for a typical 34-week school year, a student can borrow a maximum of $5,610 through the federal program.5
A student can also obtain additional aid through his or her province of residence. Most provincial plans currently have loan limits of about $110 per week, although the amounts vary across provinces: from $95 for single students in British Columbia to $335 for students in Ontario who are married or have dependents.
Repayment
While an individual is in school, the government pays the interest on his or her student loans, a significant subsidy to the full cost of the borrowing. Within six months of finishing their studies, individuals must “consolidate” their loans with a single bank, agree on a repayment schedule, and begin repayment. In earlier years, student loans normally had a fixed payment (amortization) period of ten years, regardless of the size of the debt or the individual’s financial situation. The size of the monthly payments, therefore, varied greatly from one situation to another. If a loan fell into default, the bank filed a claim with the federal government for reimbursement of the principal plus accumulated interest. The CSLP then paid the bank, assumed responsibility for the loan, and attempted to recover the unpaid balance.6
This arrangement changed in 1995, when the CSLP and the participating chartered banks signed an agreement whereby the lending institutions assumed the principal risk of student loan default in return for an up-front payment of 5 percent of the value of each loan. Repayment arrangements were left, at least in principle, to be decided between the student and the bank. Furthermore, if a student had a federal and a provincial loan at the same institution, the two typically were consolidated to the same schedule — with the federal rules generally holding sway. In 2000, that agreement was renewed, but only on an interim basis.
4 The problems with private institutes, whose programs are typically very short, are understood to be a main reason the Canada Millennium Scholarship Foundation Bursary Program is open only to students beyond their first year.
5 The limits described currently apply only to full-time students, who constitute the
overwhelmingly vast majority of CSLP clients. In the February 2001 budget, however, the federal government committed itself to boosting aid to part-time students.
6 Default rates averaged approximately one borrower in five, but with further collection efforts (through private collection agencies), the proportion of unrecoverable borrowing was only about 7 percent (Finnie and Schwartz 1996).
In 1995, the CSLP and the participating chartered banks signed an agreement whereby the lending institutions assumed the principal risk of student loan default.
As of March 1, 2001, the CSLP moved to a direct-lending scheme by which the federal government now directly holds, administers, and collects new CSPL loans through Edulinx, a private company.
Interest and Debt Relief
The interest rates charged on student loans were, in the pre-1995 period, based on the prevailing return to long-term government bonds and, therefore, relatively favorable. Since then, students have faced two repayment options: prime plus 2.5 percent floating or prime plus 5 percent fixed. This choice will continue in the new direct-lending scheme. A six-month post-schooling grace period, which existed in earlier years, was dropped for all CSLP loans negotiated after July 31, 1994, but most provinces continue to offer this initial respite.
Interest-rate relief was originally available for unemployed borrowers for periods of 3 months at a time, up to a maximum of 18 months. This assistance has been extended in recent years to those who cannot work due to temporary
disability or illness and those in jobs with low earnings (depending on their debt-to-income ratio). Furthermore, individuals with long-term repayment problems (that is, those who have received at least 36 months of interest relief) can now obtain limited reduction of the principal due. The federal government continues to assume responsibility for loans to borrowers who die, who are disabled, or who otherwise cannot make their repayments without undue hardship.
Why Are Governments in
the Student Loans Business?
Why are governments in the student loans business anyway? The fundamental reason is that private institutions are reluctant to lend to students because they generally cannot provide sufficient collateral up front, and at the time the loan decision must be made, their capacity to pay back in the post-schooling period is uncertain. Without government participation, lending to students would be very limited. The result would be a general underinvestment in postsecondary education, with particularly restricted access for individuals from lower-income families. From the perspectives of both economic efficiency and equity, then, it is important for governments to participate in student loans systems — as is the case around the world. (See Mankiw 1986 for a more detailed discussion of these issues.)
In making the system work this way, the CSLP and its provincial counterparts are marked by two fundamental characteristics. First, governments control
eligibility to ensure that loans are available to all students deemed to be needy, without regard to family background, future earnings potential, or other
considerations related to individuals’ creditworthiness. Second, governments have ensured a fair rate of return to lending institutions through loan guarantees
provided up to 1995 and, from 1995 to 2001, through the provision of an up-front premium to cover the higher-than-average default rates on student loans.
Canadian governments do more, however. Historically, they have used several methods of subsidizing the costs of borrowing: assuming interest payments on loans until students leave school; absorbing the costs of various interest- and
debt-Private institutions are reluctant to lend to students because they generally cannot provide sufficient collateral up front and their capacity to pay back in the post-schooling period is uncertain.
relief programs; paying the debts of disabled and certain other students; and absorbing the costs of defaulted loans (either directly or through paying banks the up-front premiums for the risk of bad loans mentioned above). These subsidies have been substantial, averaging about 30 to 40 cents on each dollar lent.
A government student loans system need not include such subsidies. It could, for example, make sufficient funds available to students in need but allow interest to accumulate while individuals were in school, or it could provide nothing in the way of interest or debt relief. Proponents of such reduced-subsidy borrowing programs typically back up their case with the following arguments.
• Postsecondary education is generally a good investment for individuals and provides significantly higher lifetime earnings out of which full-cost borrowing could usually be fully financed.7
• College and university educations are already heavily subsidized (tuition fees cover only a portion of the actual costs), and these subsidies represent
regressive transfers from the general taxpaying population to individuals who are from higher-income families or who are likely to have greater-than-average lifetime earnings in the future, largely as a result of their studies.8
• Assistance could be more precisely targeted on individuals who are truly in need or for whom financial considerations represent a particular disincentive to going to college or university.
• There would be less unnecessary borrowing if students no longer had access to the “free money” that results from government’s payment of the interest on loans while they are in school.
• Loan eligibility could be widened and borrowing rules relaxed if students themselves were paying the loan’s full costs.
Most of these efficiency and equity considerations (as well as various
intergenerational equity arguments) typically crop up in any broad discussion of the appropriate division of the costs of postsecondary schooling between students and government and how various assistance programs — loans and grants — can ensure fair and efficient access to the system. The Commentary returns to these themes throughout, particularly in the policy discussions in the latter part of the study.
Borrowings, Burdens, and Paybacks
We now turn to an empirical analysis of student borrowing in the 1980s and 1990s, which provides the basis for the policy discussions that follow.9Such a factual grounding is especially important because, despite all the attention given to rising debt burdens among students, the findings indicate that the evidence typically
7 For discussion of the returns to higher education in Canada, see Cohn (1997); Côté and Sweetman (1997); Dodge and Stager (1972); Mehnet (1977); Stager (1989; 1996); Vaillancourt (1995);
Vaillancourt and Henriques (1986); and Vaillancourt and Bourdeau-Primeau (forthcoming). 8 See Butlin (1999); Lemelin (1992); Levin (1990); Mehmet (1977); and Stager (1996).
9 The material in this section and the next is covered in more detail in Finnie (forthcoming a), which also includes other results, such as outcomes by province. See also Finnie (forthcoming b).
A government student loans system need not include subsidies. It could, for example, make sufficient funds available to students in need but allow interest to accumulate while individuals were in school, or it could provide nothing in the way of interest or debt relief.
cited — debt levels of up to $60,000, students forced into poverty on a widening scale, the carrying of loans for many years — greatly exaggerates the actual situation for most graduates.
More specifically, despite steady increases in borrowing levels and debt burdens over this period, fewer than half of 1995 graduates (the most recent cohort for which data are available) held student loans at graduation, and their average accumulated (final) debt was in the arguably moderate $10,000 to $14,000 range. Furthermore, a large portion of these loans had been paid off by two years following graduation, and only a very small minority of the borrowers reported difficulties with their loans. In short, although borrowing has undoubtedly grown in recent years, it has been less extensive and less burdensome than many people think. Associated policy discussions need to be based on an accurate
understanding of the actual situation.
The following findings are based on analysis of the National Graduates Survey (NGS) databases, which represent individuals who had successfully completed programs at Canadian universities and colleges in 1982, 1986, 1990, and 1995. The data used here were collected two years after the graduation of each cohort. (For more information on the NGS data, see Box 1.)
Levels of Borrowing
Figure 1 presents the levels of accumulated borrowing from student loans programs at graduation in two ways: the proportion of graduates with loans (“incidence”), and the mean amount owed by those who borrowed.10As these amounts are based on the information given in the NGS databases, they reflect total borrowing from governments, including the provinces, not just through the CSLP. (All dollar amounts reported here and elsewhere in the study are in constant 1997 dollars.)
For both college and bachelors graduates, borrowing generally grew across the four cohorts. At the college and Quebec CEGEP level,11the incidence rose from 1982 to 1986 and then remained approximately stable, finishing at rates of 41 percent and 44 percent for men and women, respectively, of the class of 1995. The mean levels of loans rose much more significantly, from just under $4,000 for the 1982 cohort to about $9,500 for the class of 1995. Among bachelors graduates, the incidence of borrowing rose more moderately, especially for men, to finish at rates of 47 percent and 45 percent (versus 45 percent and 39 percent for the earliest cohort), but the mean amounts again increased sharply, growing from about $6,000 for the 1982 cohort to $13,390 and $13,840, respectively, for the most recent group of men and women.
For graduate students, the incidence of finishing with a student loan at the masters level increased moderately over the years, from rates of 32 percent (men) and 31 percent (women) in 1982 to 37 percent and 35 percent in 1995. The mean
10 See Finnie and Schwartz (1996) and Schwartz and Finnie (forthcoming) for econometric analyses of the various outcomes for the pre-1995 cohorts. And see Finnie (forthcoming a; forthcoming b) for tables of the findings presented graphically here along with other results.
11 For brevity, college and CEGEP are generally conflated to college in the work reported here. None of the statistics reported includes graduates of vocational schools.
Despite steady increases in
borrowing levels and debt burdens, fewer than half of 1995 graduates held student loans at graduation.
amounts borrowed rose more sharply, from about $6,500 to $13,250 and $14,040 for men and women, respectively. Male PhD graduates were an exception to the other groups in that their incidence of borrowing dropped significantly between 1982 and 1995, finishing at just 23 percent, by far the lowest rate of all sex/education groups. For their female counterparts, the borrowing rate rose from 22 percent, a very low level, to 29 percent over this period. The average amounts borrowed rose
Box 1: The Data
The research reported in this Commentary employs four waves of the National Graduates Survey (NGS) databases, which represent individuals who successfully completed their programs at Canadian universities and colleges in 1982, 1986, 1990, and 1995. For each cohort, information was gathered from interviews held two and five years after graduation. The analysis presented here is based on each cohort’s first surveys, which included the pertinent information on student loans. (This
information was not gathered during the second interviews.)
These databases, developed by Statistics Canada in partnership with Human Resources Development Canada, are well suited to the analysis for several reasons. First, the large size of the NGS files (approximately 30,000 university and college graduates per survey) facilitates detailed analysis (including the breakdown of results by sex, degree level, and, for bachelors-level graduates, by discipline), while their representative nature allows the results to be generalized to the population of graduates at large. To ensure samples of sufficient size, the NGS employs a stratified sampling scheme (by province, level of education, and field of study). The results reported here reflect the appropriate sample weights. Second, the availability of data for four different cohorts permits the more enduring patterns to be separated from those which have been shifting over time. Third, the timing of the interviews
provides a view of the relevant outcomes that is precisely located at a particular point in time relative to graduation — for example, the amount owed at graduation and then paid down two years later — lending the results a structural interpretation and permitting fair comparisons across surveys. (A survey of, for example, all graduates regardless of when they completed their schooling would not have these desirable properties.) Finally, the information related to student loans — including the amounts borrowed, the debt remaining two years after graduation, and self-identified
problems with making loan repayments — in combination with the educational, labor market, and sociodemographic information available on the files, makes for a rich and detailed analysis.
To allow for an analysis of total accumulated borrowing by the end of the individual’s schooling and of payback rates in the post-schooling period, sample restrictions were imposed to eliminate graduates who had not finished their education at the time they completed the programs that were the basis of their inclusion in the NGS databases. Dropped from the analysis, therefore, were graduates with the following characteristics: those who had obtained an additional
postsecondary diploma between graduation and the first interview; those who were (as of the first interview) enrolled in a study program;athose who were not currently looking for work due to school attendance; and part-time workers who cited school as the reason for their only partial involvement in the labor market. The key loan variables were then verified for consistency and a small number of records were either dropped or corrected. Finally, information required for specific tables was occasionally missing, resulting in another small number of deletions.
a The current enrollment information was not available for the 1982 graduates. Instead, those enrolled full-time in either January or October 1983 were deleted.
Figure 1: Incidence of Borrowing and Mean Amounts,
by Degree and Sex, 1982, 1986, 1990, and 1995
College Bachelors Masters Doctorate per cent 5 1982 1986 1990 1995 Incidence 4 3 2 1 0 per cent 5 4 3 2 1 0 1982 1986 1990 1995 1982 1986 1990 1995 5 4 3 2 1 0 per cent 1982 1986 1990 1995 5 4 3 2 1 0 per cent
Mean Amount Borrowed male female 1997 $ 15,000 10,000 5,000 0 1982 1986 1990 1995 1997 $ 15,000 10,000 5,000 0 1982 1986 1990 1995 1997 $ 15,000 10,000 5,000 0 1982 1986 1990 1995 1997 $ 15,000 10,000 5,000 0 1982 1986 1990 1995
substantially for both groups, from just over $5,000 in 1982 to $12,450 and
$13,130 for men and women, respectively, in 1995.
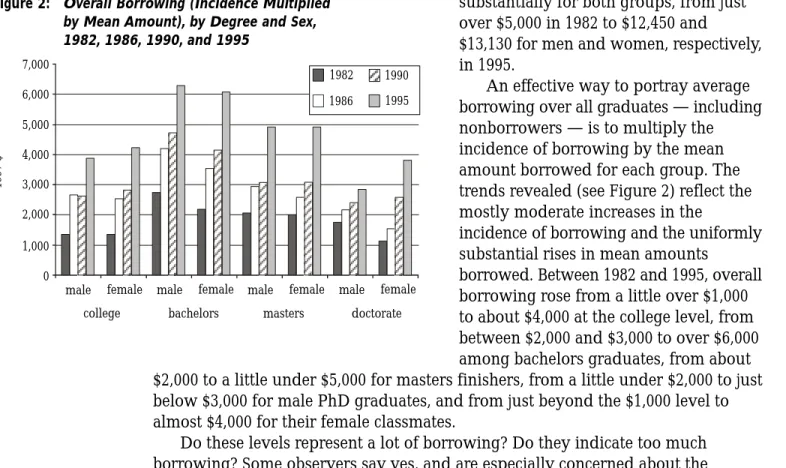
An effective way to portray average borrowing over all graduates — including nonborrowers — is to multiply the incidence of borrowing by the mean amount borrowed for each group. The trends revealed (see Figure 2) reflect the mostly moderate increases in the
incidence of borrowing and the uniformly substantial rises in mean amounts
borrowed. Between 1982 and 1995, overall borrowing rose from a little over $1,000 to about $4,000 at the college level, from between $2,000 and $3,000 to over $6,000 among bachelors graduates, from about $2,000 to a little under $5,000 for masters finishers, from a little under $2,000 to just below $3,000 for male PhD graduates, and from just beyond the $1,000 level to almost $4,000 for their female classmates.
Do these levels represent a lot of borrowing? Do they indicate too much borrowing? Some observers say yes, and are especially concerned about the increases over time. Focusing on individuals with above-average debt loads,12 these critics question how such burdens may be deterring qualified Canadians from pursuing postsecondary studies and are particularly concerned about how these dynamics have been affecting individuals from lower-income families.
Other observers, however, think that average debt around the $13,000 level (lower for college graduates) for a quarter to just under half of postsecondary graduates is not excessive. The amount equals, for example, the price of some of the least expensive new cars available for sale (which auto companies spend a good deal of energy marketing to such recent graduates) in the case of those holding loans, and it is obviously less than half this value when averaged over all graduates taken together (including those without loans). Such debt levels, these commentators say, seem especially reasonable when one considers that
postsecondary education has a high rate of return and that lifetime earnings are much higher as a result of the investments these loans facilitate.
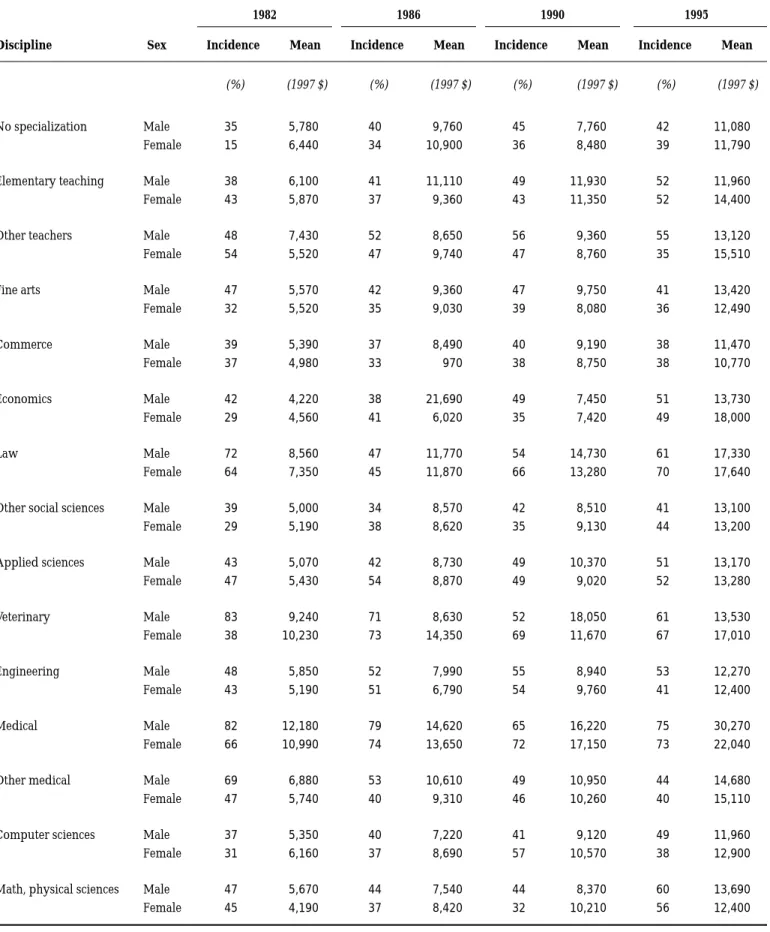
Table 1 sets out borrowing by major field of study (discipline) at the bachelors level. Interestingly, apart from the anticipated higher levels for graduates of certain professional schools (law and medicine), no obvious patterns appear across the various fields. In particular, borrowing does not seem to be related to future earnings patterns (Finnie 2001). Similarly, levels of borrowing by male and female graduates within a given discipline are generally alike. These findings suggest that student debt levels cannot be explained by a standard life-cycle model whereby those with higher expected earnings (for example, graduates in engineering,
12 For the detailed distribution of graduates’ debt levels, see Finnie (forthcoming a; forthcoming b).
Figure 2: Overall Borrowing (Incidence Multiplied
by Mean Amount), by Degree and Sex, 1982, 1986, 1990, and 1995 7,000 1997 $ 6,000 5,000 4,000 3,000 2,000 1,000 0
male female male female male female male female college bachelors masters doctorate
1995 1990 1986
Table 1: Borrowing by Field, Bachelor’s Graduates, 1982, 1986, 1990, and 1995
1982 1986 1990 1995 Discipline Sex Incidence Mean Incidence Mean Incidence Mean Incidence Mean
(%) (1997 $) (%) (1997 $) (%) (1997 $) (%) (1997 $)
No specialization Male 35 5,780 40 9,760 45 7,760 42 11,080
Female 15 6,440 34 10,900 36 8,480 39 11,790
Elementary teaching Male 38 6,100 41 11,110 49 11,930 52 11,960
Female 43 5,870 37 9,360 43 11,350 52 14,400
Other teachers Male 48 7,430 52 8,650 56 9,360 55 13,120
Female 54 5,520 47 9,740 47 8,760 35 15,510
Fine arts Male 47 5,570 42 9,360 47 9,750 41 13,420
Female 32 5,520 35 9,030 39 8,080 36 12,490 Commerce Male 39 5,390 37 8,490 40 9,190 38 11,470 Female 37 4,980 33 970 38 8,750 38 10,770 Economics Male 42 4,220 38 21,690 49 7,450 51 13,730 Female 29 4,560 41 6,020 35 7,420 49 18,000 Law Male 72 8,560 47 11,770 54 14,730 61 17,330 Female 64 7,350 45 11,870 66 13,280 70 17,640
Other social sciences Male 39 5,000 34 8,570 42 8,510 41 13,100
Female 29 5,190 38 8,620 35 9,130 44 13,200
Applied sciences Male 43 5,070 42 8,730 49 10,370 51 13,170
Female 47 5,430 54 8,870 49 9,020 52 13,280 Veterinary Male 83 9,240 71 8,630 52 18,050 61 13,530 Female 38 10,230 73 14,350 69 11,670 67 17,010 Engineering Male 48 5,850 52 7,990 55 8,940 53 12,270 Female 43 5,190 51 6,790 54 9,760 41 12,400 Medical Male 82 12,180 79 14,620 65 16,220 75 30,270 Female 66 10,990 74 13,650 72 17,150 73 22,040
Other medical Male 69 6,880 53 10,610 49 10,950 44 14,680
Female 47 5,740 40 9,310 46 10,260 40 15,110
Computer sciences Male 37 5,350 40 7,220 41 9,120 49 11,960
Female 31 6,160 37 8,690 57 10,570 38 12,900
Math, physical sciences Male 47 5,670 44 7,540 44 8,370 60 13,690
computer sciences, commerce, and mathematics and physical sciences, as well as men in general relative to women) borrow greater amounts to be paid back out of subsequent earnings. An alternative explanation is that borrowing has been largely supply constrained and that individuals typically have borrowed up to the limits permitted, a result with important policy implications regarding those limits.13
The Burden of Student Loans
A simple measure of the burden that this borrowing represents is to calculate individuals’ debt-to-earnings ratios, defined here as the amount owed to student loans programs at graduation divided by the annual rate of pay in the job held at the first interview (for those employed at that time).14As illustrated in Figure 3, the median debt burdens among university graduates have generally been lower at the higher degree levels, especially for women, primarily due to the underlying earnings patterns (Finnie 1999). The burdens of college graduates have been roughly similar to those of masters graduates, the former characterized by less borrowing but also substantially lower earnings.
For all groups, debt burdens generally rose over time, driven almost entirely by the increases in borrowing levels for the later cohorts (reported above), since
average earnings were relatively steady over this period, at least over the first three cohorts. Unfortunately, comparisons through the 1995 cohort are confounded by a change in the NGS earnings measure for the latest group — a change that appears to have affected women’s measured earnings more than men’s.15
As for differences by sex, debt-to-earnings ratios have generally been higher for women than for men because of the former’s generally lower earnings levels (recall that borrowing levels have been roughly similar), except at the PhD level, where the male-female earnings gap is much smaller.
13 See Finnie and Schwartz (1996) and Schwartz and Finnie (forthcoming) for further discussion of borrowing in a demand-supply analytical framework.
14 Earnings at the two-year point are obviously an imperfect indicator of longer-run profiles. More specifically, since earnings generally rise and unemployment rates decline sharply early in individuals’ careers (Finnie 1999; 2000), the burden measures reported here generally overestimate the true hardship of loans over time.
15 In the earlier cohorts, individuals were asked to report their earnings in terms of what they would receive were the job to last the full year, whether or not that was the case. Members of the 1995 cohort were asked to give their rate of pay in the manner they preferred (hourly, weekly, monthly, annually); Statistics Canada then translated these amounts into annual values based on usual hours and weeks of work.
Figure 3: Median Debt-to-Earnings Ratios,
by Degree and Sex, 1982, 1986, 1990, and 1995 60 per cent 50 40 30 20 10 0
male female male female male female male female college bachelors masters doctorate
Note: Due to a change in the earnings measure in the NGS, the 1995 figures are not directly comparable to those of the previous cohorts.
1982 1986
1990 1995
Measured debt burdens vary in a predictable pattern by field of study (Table 2). As we have seen, borrowing levels have been fairly similar across disciplines. Thus, the calculated ratios principally reflect the associated earnings patterns (Finnie 2001). For example, for men of the 1995 cohort, the ratios ranged from lows around 30 percent (commerce, engineering, computer science, and no specialization) to a high of 60 percent (other teachers). The ratios were generally higher for women than men for each field but followed roughly the same pattern. Of perhaps some surprise are the rather high debt-to-earnings ratios among medical school graduates. As already noted, this group had very high debt levels; these ratios reflect the fact that their starting earnings levels were not commensurately elevated. Recall, however, the timing of the data collection: only two years after graduation. It would be interesting to see what happened in the longer run, after the individuals
Table 2: Debt-to-Earnings Ratios by Discipline,
Bachelors Graduates, 1982, 1986, 1990, and 1995
Discipline Sex 1982 1986 1990 1995
(percent)
No specialization Male — 25 22 29
Female — 40 35 53
Elementary teaching Male 17 26 37 43
Female 19 31 36 53
Other teachers Male 18 28 33 60
Female 17 32 30 59
Fine arts Male 18 30 34 43
Female 21 36 33 56 Commerce Male 13 26 29 34 Female 17 25 36 40 Economics Male 11 28 25 37 Female — — — — Law Male 23 33 39 45 Female 19 36 34 52
Other social sciences Male 16 29 32 46
Female 20 34 36 62
Applied sciences Male 13 27 36 44
Female 18 28 29 47 Veterinary Male 21 21 — — Female — — 28 44 Engineering Male 12 19 21 29 Female — 12 25 27 Medical Male 14 18 31 63 Female 23 21 29 73
Other medical Male 14 20 26 37
Female 15 22 29 42
Computer sciences Male 14 22 21 30
Female 19 27 27 42
Math, physical sciences Male 14 20 22 36
in this group completed their internships and residencies and their salaries better reflected their longer-run earnings levels.
In general, the debt-to-earnings ratios were considerably more equal by sex within a given field of study than for all graduates taken together (at least for the bachelors graduates shown) and were actually lower for women than men in certain disciplines (for example, engineering and mathematics and the physical sciences in the 1995 cohort). A substantial part of the higher overall average debt burdens of female graduates, therefore, appears to be due to their being overrepresented in generally low-income fields, rather than having lower earnings in a given area.
Payback Rates
How quickly have graduates been paying back their loans? If everyone followed the standard ten-year payback period, an average of 20 percent of the original debt would have been reimbursed by two years after graduation.16 The data shown in Figure 4 indicate, however, that graduates have been paying their loans back much more quickly than this. When surveyed, college and bachelors graduates had paid back an average of about two-fifths of the debt they had at graduation, the masters group had repaid a little over half, and PhD graduates slightly greater amounts. That these repayment rates were so surprisingly rapid seems to point to student loans’ not typically having been a particularly heavy burden for graduates, especially given the preferential interest rates discussed above.17
In virtually all cases, the percentage paid back two years after graduation fell for each succeeding cohort. Most of these declines were greater for women than for men, and in some cases the changes were quite substantial (for example, from 56 percent to 38 percent for college women and from 72 percent to 57 percent for female PhDs between the 1986 and 1995 groups). If we assume that taking longer to pay indicates greater difficulty in doing so, these findings suggest that the more recent graduates were experiencing greater hardship with their student loans in more recent years.
The observed payback rates also reflect the nature of the increased borrowing over this period, suggesting that the greater amounts reported above were
generally “real” — that students in fact spent the money and did not just hold it 16 Actually, less than this proportion of the principle would be paid because interest would be a
relatively large portion of the payments in earlier years.
17 That is, if students had competing demands on their disposable incomes (such as car loan payments or credit card balances), they presumably would have delayed payment on lower-interest debts such student loans.
Figure 4: Proportion of Debt Repaid Two Years after
Graduation, by Degree and Sex, 1986, 1990, and 1995
60 per cent 50 40 30 20 10 0
male female male female male female male female college bachelors masters doctorate 80
70
1986 1990 1995
Note: Results are not shown for the 1982 cohort because the relevant information was not gathered.
for the investment opportunities represented by the absence of any interest charges while in school and make prompt repayment immediately after graduation.
Interestingly, the repayment rate differences between men and women do not generally correspond to their relative ability to pay, as measured above. For the 1995 cohort, for example, female graduates’ payback rates were either slightly greater than males’ (at the PhD level), equal (masters), or at most 4 percentage points lower (college and bachelors); yet, as we saw earlier, women’s debt-to-earnings ratios were mostly about 10 percent higher (the exception being the case of PhD graduates, for whom the women’s ratios were slightly lower).18
Differences in payback rates by discipline (Table 3) were inversely correlated with the debt-to-earnings ratios seen previously, and graduates in disciplines with higher debt burdens tended to pay back their loans more slowly. These patterns are not particularly strong, however, and there are numerous clear exceptions (for example, the extraordinarily low payback rates of lawyers). As in the aggregate figures just seen, women’s payback rates within most given fields were not nearly as low relative to men’s as one might predict from the debt-to-earnings ratios observed above.
Difficulties with Repayment
The NGS databases do not include any information on loan default, but, for the 1990 and 1995 cohorts, they include the responses to a simple question put to individuals who still had outstanding loans as of the first interview: Had they been encountering “difficulties” with repayment?19Among the latest college, bachelors, and masters graduates, 29 to 33 percent reported such problems, while the rates were 21 percent and 23 percent for male and female graduates at the PhD level (see Figure 5). In each group except women who graduated with PhDs, these rates were higher than those that obtained in 1990 — in many cases, rather significantly so.
These rates of difficulty are substantial — and rising. They should, however, be placed in a broader context. Given that only a quarter to just under a half of all of these graduates had loans on graduation and 20 to 40 percent of those borrowers had repaid their debt entirely by the first interview (Finnie forthcoming, a; forthcoming, b), the proportion of all postsecondary graduates who reported repayment difficulties was 14 percent and 15 percent at the college level (for males and females, respectively), 12 percent and 14 percent at both the bachelors and masters levels, and 11 percent and 10 percent at the PhD level. These rates are considerably higher than those of the 1990 cohort, but they are still fairly low — and probably much lower than many readers would have guessed.
18 Payback rates weighted by initial loan level ranged from 2 to 10 percentage points lower than the unweighted rates reported here (Finnie forthcoming a; forthcoming b); the implication is that graduates with more debt paid back their loans more slowly than those with less.
19 The obvious problem with this self-reported measure is that two individuals in similar situations might have described their experiences differently. Yet we have no obvious reason to expect responses to vary categorically from one group of graduates to another (for example, by sex, degree level, or cohort), so the measure should at least be a useful indicator of relative repayment problems. Moreover, its simple construction, based on a relatively straightforward question, should also make it at least somewhat meaningful in an absolute sense. The results are interpreted, cautiously, in this perspective.
Women’s payback rates within most given fields were not nearly as low relative to men’s as one might predict.
Women have generally reported greater incidences of difficulty with repayment than men. This overall result is consistent with their higher debt-to-earnings ratios (due to their lower earnings levels) seen earlier, but, as with the repayment rates themselves, the male-female differences are not as great as the measured debt burdens might suggest. Taken together, these findings seem to point to male-female differences in behavior or attitudes regarding student debt, with some potentially important implications. The fact that women report more difficulties overall may, for example, imply that they are less willing to borrow for their studies, an outlook that may affect their participation in the postsecondary system at various levels. Conversely, the fact that the “difficulties gap” is not as large as the “measured burden gap” seems to suggest that women either do a better job of
Table 3: Proportion of Debt Repaid by Discipline, Bachelors Graduates, 1986, 1990, and 1995
Discipline Sex 1986 1990 1995
(percent)
No specialization Male 49 57 34
Female 35 56 33
Elementary teaching Male 49 46 45
Female 49 45 42
Other teachers Male 49 42 46
Female 52 43 33
Fine arts Male 39 48 36
Female 48 50 43 Commerce Male 50 52 46 Female 49 55 53 Economics Male 49 52 48 Female — — — Law Male 31 31 24 Female 49 30 14
Other social sciences Male 46 50 41
Female 54 43 37
Applied sciences Male 50 50 42
Female 55 51 41 Veterinary Male 70 — — Female — 51 32 Engineering Male 61 53 51 Female 55 59 53 Medical Male 47 44 40 Female 52 41 29
Other medical Male 54 59 61
Female 60 57 51
Computer sciences Male 49 50 53
Female 50 58 53
Math, physical sciences Male 58 51 52
managing their student debt or have other reasons for being less worried than men by a given level of borrowing.20
The rates of reported difficulties are roughly similar for graduates at the college, bachelors, and masters levels, despite the differences in earnings levels and debt-to-earnings levels across these groups. And the lower rates at the PhD level are hardly surprising, given these individuals’ higher earnings and lower debt levels.
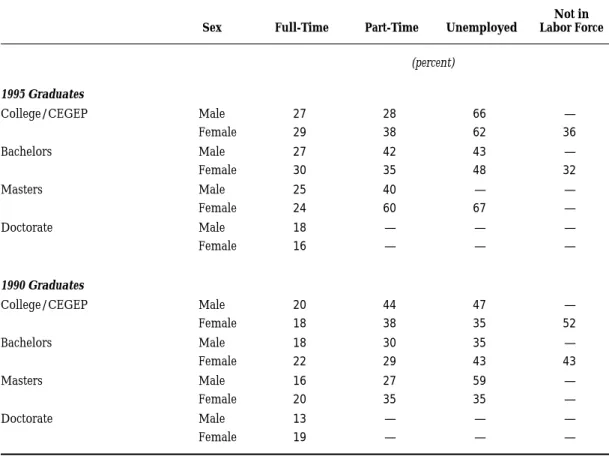
The characteristics of graduates who encountered difficulties with the repayment of their loans is particularly important information for policymakers; with it, they can target assistance more precisely. The percentage of borrowers from the most recent cohort who had full-time jobs but experienced repayment problems varied from 16 percent to 30 percent (Table 4) — fairly low, but by no means negligible and substantially higher than for the 1990 group. For part-time workers, the rates were higher, sometimes very much so (as high as 60 percent for masters-level females). These results suggest that relief for graduates who have jobs but are stuck at low earnings levels should probably accompany assistance targeted on the unemployed. And, in fact, recent changes in the CSLP have done precisely this.
The incidence of repayment problems by income level (Table 5) is also interesting. As expected, problems were less prevalent at the upper ranges. Moreover, compared with the 1990 graduates, the most recent cohort displays fewer clear cut-points at which problems were much more common for each sex/education group, and those that can be identified vary by education level. Thus, the precise design of loan assistance programs based on income levels appears to offer policymakers something of a challenge, and anyone evaluating such initiatives may have to accept that the resulting benefits are not as precisely targeted as one might wish. Alternatively, the earnings measure available in the pre-1995 data (see above) may have been better than the more recent one at capturing the underlying ability to pay; if so, something of its type could be used for directing assistance.
Given the differences in debt-to-earnings ratios by field of study reported in Table 2, one would expect a corresponding pattern for reported repayment
difficulties. This is indeed the case. Table 6 shows the incidence of problems for the 1995 cohort was as high as 51 percent (males) and 41 percent (females) for fine arts and humanities graduates and as low as 18 percent and 27 percent for their
engineering counterparts. Notably, the surprisingly high debt-to-earnings ratios for medical graduates seen earlier did not translate into inordinately high rates of
Figure 5: Incidence of Difficulty with Repayment,
by Degree and Sex, 1990 and 1995
per
cent
0
male female male female male female male female college bachelors masters doctorate 5 10 15 20 25 30 35 40 1990 1995
20 These issues should be placed in the context of the fact that women now participate in the postsecondary system, at least at the college and bachelors degree levels, at significantly greater rates than men. This shift has occurred partly because career opportunities for women with lower levels of education are especially stunted and, more recently, because of girls’ rising performance and lower dropout rates in high school.
repayment difficulties, a finding consistent with the earlier speculation that their earnings levels two years after graduation are not good indicators of their true ability to pay.21
Summary of the Findings and Some Caveats
The major empirical findings of this study may be summarized as follows.
• Borrowing by postsecondary students generally rose over the successive cohorts covered by the data (1982, 1986, 1990, and 1995 graduates). A quarter to just under a half of the last group of graduates held student loans at graduation (varying by sex and discipline). The accumulated debt averaged about $9,500 for college graduates and $12,500 to $14,000 (in 1997 dollars) at the bachelors, masters, and PhD levels.
Table 4: Incidence of Repayment Difficulty by Labor Force Status, 1990 and 1995 Graduates
Sex Full-Time Part-Time Unemployed
Not in Labor Force (percent) 1995 Graduates College/CEGEP Male 27 28 66 — Female 29 38 62 36 Bachelors Male 27 42 43 — Female 30 35 48 32 Masters Male 25 40 — — Female 24 60 67 — Doctorate Male 18 — — — Female 16 — — — 1990 Graduates College/CEGEP Male 20 44 47 — Female 18 38 35 52 Bachelors Male 18 30 35 — Female 22 29 43 43 Masters Male 16 27 59 — Female 20 35 35 — Doctorate Male 13 — — — Female 19 — — —
21 The circumstances for medical students have become increasingly aberrant in a number of ways. Their tuition levels at some institutions have skyrocketed to $10,000 and beyond, yet the CSLP offers no special accommodation for students in medical programs (or for those in any other particular discipline). This situation has raised concerns about, among other things, access to medical school and the tendency of graduates to take training for specializations rather than to practice general medicine. Similar developments characterize other professional programs (that is, law, business, and even engineering) in certain provinces.
• Average debt-to-earnings ratios declined with degree level (bachelors, masters, PhD) among university graduates, while college graduates were in the middle range. All these ratios rose over time.
• Consistent with the increasing levels of borrowing and debt-to-earnings ratios, average payback rates as of two years following graduation declined across cohorts but were still at a relatively high 40 to 55 percent for 1995 graduates. • The incidence of self-reported loan difficulties increased over time. For the 1995
cohort, it varied between 21 and 33 percent of those who still owed money two years following graduation, with the rates generally (but not uniformly) lower at the higher degree levels. However, taking into account the number of graduates with no loans at all and those who had paid their loans off entirely by this time reveals that just 10 to 15 percent of all postsecondary graduates in the most recent cohort reported difficulties with the repayment of their student loans — a perhaps surprisingly low number.
• Repayment difficulties were greatest among unemployed graduates but were also reported in significant numbers among those who had part-time and even full-time jobs. Generally, problems were related to income levels.
• The differences in borrowing levels by sex were relatively small at graduation. The differences in debt-to-earnings ratios in the postgraduation years were Table 5: Incidence of Repayment Difficulty by Income Class,
1990 and 1995 Graduates Sex Less than $15,000 $15,000 to $20,000 $20,000 to $25,000 $25,000 to $30,000 $30,000 to $35,000 $35,000 to $45,000 $45,000 to $60,000 More than $60,000 (percent) 1995 Graduates College/CEGEP Male 52 32 22 24 22 13 21 — Female 46 26 21 20 28 32 — — Bachelors Male 49 31 26 41 26 11 6 — Female 46 45 27 30 17 22 10 — Masters Male 45 57 47 31 33 14 6 2 Female 61 48 42 41 35 14 16 — Doctorate Male — — — — — 20 13 — Female — — — — — — — — 1990 Graduates College/CEGEP Male 59 34 21 11 9 13 0 — Female 36 22 22 18 11 16 — — Bachelors Male 41 30 26 16 18 13 11 19 Female 45 40 28 22 15 10 30 26 Masters Male 53 50 40 28 20 13 12 8 Female 53 30 21 28 16 22 13 — Doctorate Male — — — — — 22 5 — Female — — — — — — — —
greater because of women’s generally lower earnings levels. The male-female differences in payback rates and reported difficulties with repayment were not, however, as large as the “burden gaps” may have suggested. Two very important caveats need to be attached to these findings. First, the NGS data are limited to students who successfully completed their postsecondary programs. Those who took out loans but then dropped out of school may have quite different profiles. In particular, although their
borrowing levels were probably lower, they generally would not have had the higher earnings that typical postsecondary
graduates enjoy and were thus likely to face greater problems during the payback years.
Second, the situation has unquestionably changed — perhaps significantly — since the last cohort of graduates covered in this analysis. For example, the 1994 increase in the lending limit from $105 to $165 per week surely pushed up borrowing levels. If we assume a proportional increase in mean borrowing levels, bachelors-level graduates who encountered the higher limit over their entire four years probably averaged
cumulative totals of about $19,300,22rather than the approximately $13,500 reported above. Applying the new estimated averages to the previously observed incidences (again at the bachelors level) results in estimates of just under $9,000 when averaged across all graduates — still not a huge amount, but significantly higher than reported above and suggesting the continuation of longer-term upward trends.
Furthermore, provincial grant programs were largely replaced with loans in the 1990s, presumably further driving up borrowing levels. Conversely, the Canada Millennium Scholarship Foundation Bursary Program now provides up to approximately $3,000 of support for individuals in their second or third year of Table 6: Incidence of Repayment Difficulty by Discipline,
Bachelors Graduates, 1990 and 1995
Discipline Sex 1990 1995 No specialization Male 46 9
Female 36 47
Elementary teaching Male 23 33
Female 27 30
Other teachers Male 11 25
Female 21 44
Fine arts Male 30 51
Female 38 41 Commerce Male 18 19 Female 14 15 Economics Male 17 25 Female — 33 Law Male 18 24 Female 29 31
Other social sciences Male 27 51
Female 30 36
Applied sciences Male 30 44
Female 33 43 Veterinary Male 18 — Female 16 27 Engineering Male 18 18 Female 20 27 Medical Male 12 24 Female 13 25
Other medical Male 7 28
Female 8 23
Computer sciences Male 8 10
Female 18 34
Math, physical science Male 24 14
Female 24 29
22 This number was calculated by multiplying $13,500 (the approximate average amount 1995 graduates borrowed) by 1.57 (the proportional increase in the lending limit) and then taking 75 percent of the result (because the 1995 graduates would have encountered the higher limit for only one of their four years). This estimate seems to agree with other numbers in circulation, including the $19,000 arrived at by the Canadian Undergraduate Survey Consortium for those graduating in spring 2000. (The author is grateful to Herb O’Heron of the Association of Universities and Colleges of Canada for supplying this number.)
study, with these funds largely intended to reduce students’ borrowing. And some provinces have introduced or expanded debt-remission plans, thereby also easing the pressures on borrowing.
Other changes have been related to payback. Under the 1995 agreement between the federal government and participating financial institutions, the latter assumed the primary risk of default (which had not previously been the case) in return for a 5 percent risk premium paid up front as each student loan was
consolidated (that is, at the beginning of the repayment period). This arrangement may have changed the banks’ treatment of student loans, perhaps making them more diligent in their management and more flexible in the repayment arrangements offered. There is, unfortunately, no direct empirical evidence on these results.
At the same time, the CSLP has been expanding its assistance programs for borrowers who experience problems with their loans. Since 1995, interest relief has been available not only for the unemployed, sick, and disabled, who were
previously eligible, but also for those with low earnings. As well, the CSLP has introduced debt reduction on a limited scale.
Finally, the economic boom of the later 1990s boosted employment rates and drove earnings levels up across the board, while various continuing structural shifts have almost surely made things easier for many graduates (especially those with the “right” diplomas), although perhaps more difficult for others.
In summary, borrowing levels have probably increased, but it is not clear by how much. Debt-to-earnings ratios likely have risen to the degree that borrowing has, in fact, increased, but have probably declined as graduates’ labor market outcomes have improved. In addition, at least some individuals experiencing difficulties with the management of their student loans undoubtedly have benefited from any increased bank flexibility in repayment terms and from
government interest-relief and debt-reduction programs. These statements are only conjectures, however, and it will be important to see what the actual data reveal as they become available.
Policy Implications
The analysis of the NGS data suggests that the CSLP and its provincial counterparts have been doing a reasonable job in assisting Canadian postsecondary students without undue financial stress. But it also has some policy implications that, if followed up, could lead to an improved and expanded loans system. This section of the Commentary explores some of these.
More Help for Those with Difficulty
We should applaud, at least in principle, the CSLP’s mid-1990s’ expansion of the existing interest-relief program (Finnie and Schwartz 1996) to help job holders who are stuck at low earnings levels. Further extensions are probably worth
considering. However, these programs need to be analyzed to see whether they are fairly and efficiently delivering assistance where it is needed and to fine-tune them.
The CSLP and its provincial counterparts have been doing a reasonable job in assisting Canadian postsecondary students without undue financial stress.
A still more recent policy development has been the introduction of debt reduction. Since 1998, individuals who have been receiving interest-rate assistance for at least 30 months and who finished their studies at least five years previously have been eligible to apply for debt reduction of 50 cents on the dollar, up to a maximum of $10,000. The relief may be fairly substantial, even as these conditions reduce the moral hazard problem (that is, that the benefits are not large enough to tempt individuals to adjust their work behavior to obtain them). It seems likely, therefore, that this program is providing important levels of support to chronically debt-burdened individuals in a well-targeted manner, and further extensions of this kind of assistance should be considered. Again, however, analysis is needed to make sure that the program is, in fact, doing a good job of delivering assistance to worthy candidates.
A particularly interesting point about these loan-relief programs is that because they provide some insurance against excessive debt loads, they help not only individuals who qualify for the assistance, but all those who borrow from
government loan programs — or who ought to do so in the future. This aid should provide the most benefit to students from lower-income families, since such
individuals presumably face the greatest hardship from excessive debt burdens and, because of the reduced levels of family support available, have the greatest worries about financing their studies through borrowing.23
These interest-relief and debt-reduction programs thus possess some desirable properties in terms of both efficiency and equity. They provide short-run help to individuals facing hardship with their debt burdens at any particular point in the post-schooling years. They offer additional support for those with longer-standing problems. And they should encourage qualified individuals to rely on borrowing if necessary to pursue their postsecondary studies, in the knowledge that help is available if they wind up facing excessive debt burdens. Furthermore, all of these benefits should be felt most by those from lower-income families, for whom borrowing is generally thought to be a particular deterrent to pursuing post-secondary studies.
The usual hypothesis is that students from lower-income families may be uncomfortable with the concept of borrowing to finance investments because they lack family-based experience of this type of borrowing. They may thus be
intimidated by the idea of investing in their own human capital. They would also be unable to count on the same level of family support if they later encountered loan-related financial problems, even though the plan envisioned here would be generous in its provisions in this regard. Unfortunately, analysts’ understanding of the underlying attitudes is very limited.24
23 These debt-relief programs may be contrasted with the various loan-remission programs that the provinces have instituted in recent years. Although the latter take various forms, they possess a common attribute that differentiates them from the CSLP’s debt-relief programs: the provincial programs are not based on individuals’ measured debt-related hardship in the payback period. Thus, they may be thought of as providing grants that offset individuals’ loan accumulation either year by year or at the final borrowing level.
24 See the discussion below about the need for further research on this and related topics.
Because loan-relief programs provide some insurance against excessive debt loads, they help not only individuals who qualify for the assistance, but all those who borrow from government loan programs.
Interestingly, basing loan relief and debt reduction on the actual hardship individuals face in the post-schooling years is taking the Canadian system a significant step toward an income-contingent repayment (ICR) model, whereby payments are geared to individuals’ ability to pay. But it does so without the need to re-engineer the entire loans system, with all of the associated challenges,
disruptions, and mistakes that inevitably would result along the way. Moreover, these provisions could be adjusted further to take the Canadian loans system yet closer to an ICR model, making payments even more directly related to students’ debt levels and post-schooling incomes.25
By reducing the effective burden of a given amount of debt, an enhanced loan-relief system could also provide students with the means to shoulder higher costs for their postsecondary education — either having them pay a greater portion of the existing costs, as some would advocate, or raising additional cash for what has become a severely financially strained system. One related application of this principle is discussed below.26
Higher Loan Limits and Expanded Eligibility
Another implication of the findings reported in this Commentary is that loan limits should be raised. In some sense, this suggestion is perfectly obvious. The current limits were set in 1994, and education costs have risen significantly since then. Tuition rates alone have approximately doubled — increasing by something like $1,500 — since the early 1990s for the benchmark arts and letters programs. If the current limits were appropriate then, they must be too low now.
Furthermore, the evidence presented here shows that, as limits were raised in the past, borrowing by students did increase, indicating that it had been supply constrained and that students were glad to take out more loans when they could get them. In addition, the payback rates shown suggest that this additional borrowing was generally used to meet real needs. While students were in school, they generally did not, as is sometimes thought, use the interest-free funds to make investments. If they had, they would have paid the loans back immediately after graduation, rather than making payments more slowly and thus incurring financing costs.
Again, raising limits should provide the greatest benefit to individuals from lower-income families due to their heavier dependence on government loans programs to finance their studies. Higher loan limits should, therefore, give an increased number of qualified candidates the chance to pursue their studies while providing the greatest support for those from relatively disadvantaged backgrounds.
Extending eligibility for loans is another option that should be considered. In particular, the system probably should make money available to more middle-income families. Of course, this issue comes down to an empirical one on which there is relatively little hard evidence: do individuals from such circumstances actually need this assistance?
25 See Finnie and Schwartz (1996) for a discussion of ICR systems and the ways in which the Canadian system has implicitly been evolving toward them in recent years. See also Krueger and Bowen (1993).
26 Finnie and Schwartz (1996, especially appendix B) discuss the arguments for and against higher tuition fees.
Raising loan limits should provide the greatest benefit to individuals from lower-income families due to their heavier dependence on government loans programs to finance their studies.
Loans: Mostly Better than Grants
The provinces largely eliminated grants for postsecondary students in the early 1990s and replaced them with expanded loan programs.27Many commentators have, however, called for the reinstatement and expansion of grants, typically on the grounds that such programs are the best way to ensure access to the
postsecondary system, especially for individuals from lower-income families. The federal government’s launch of the Canada Millennium Scholarship Foundation Bursary Program was basically a response to this clamor. Grants are, however, probably not the best way of providing financial assistance to students, except perhaps for a very specific and rather limited segment of the population.
Grants obviously provide direct assistance to the students who receive them, helping such individuals attend college or university at a time when higher
education is becoming increasingly important to individuals’ career success and to the country’s economic performance.28
So how can a grants system not be good public policy? First, simple arithmetic demonstrates that a given amount of government spending on student financial assistance will go much further when put into a loans system than into grants, precisely because the money is paid back in most cases and can thus effectively be recycled. In short, for any given amount of government spending, a loans system can provide a greater number of individuals with more money and thus have a greater effect on improving access to postsecondary schools.
Second, grants provide pure transfers (the entire value of the awards) to individuals who are not necessarily “needy,” especially in a long-term sense. Since no selection criteria are perfect, some awards inevitably go to individuals who do not really depend on them in the first place (because, for example, they come from higher-income families or have access to other resources to pay for their education). More important, though, other awards go to individuals who move on to successful careers with significantly above-average earnings levels and who could, therefore, afford to pay back at least part of a loan that was issued in lieu of a grant. In brief, many grant recipients could pay for loans out of their post-schooling earnings and
should do so because they are not poor from this longer-term perspective.29 Contrast such a grants system with a loans system that includes generous provisions for borrowers who face difficulties with their debts in the post-schooling period. Those provisions could be an expansion of the sort of interest-relief and debt-reduction programs that the CSLP has been moving toward in recent years, or they could link payback more even closely to individuals’
post-27 See Finnie and Schwartz (1996, appendix A) for details. But because the various loan-remission programs many provinces adopted even more recently are best thought of as grant programs (as mentioned in note 24), grants have not actually been cut as much as may appear on the surface. 28 This discussion focuses on grants based on need, not merit; the latter raise a separate set of issues. 29 Recall the various arguments against subsidizing student financial assistance mentioned above.
These include that subsidies for postsecondary students generally represent a regressive transfer from taxpayers in general to those in the upper reaches of the income distribution, especially when considered across the borrower’s entire lifetime. And those higher lifetime earnings largely stem precisely from the higher education the system provides individuals, education that is already supported significantly by the general support governments provide the system.
Grants are probably not the best way of providing financial assistance to students, except perhaps for a very specific and rather limited segment of the population.