Evolutionary Gradient Search Revisited
Dirk V. Arnold and Ralf Salomon
Abstract—Evolutionary gradient search (EGS) is an approach to optimization that combines features of gradient strategies with ideas from evolutionary computation. Recently, several modifica-tions to the algorithm have been proposed with the goal of im-proving its robustness in the presence of noise and its suitability for implementation on parallel computers. In this paper, the value of the proposed modifications is studied analytically. A scaling law is derived that describes the performance of the algorithm on the noisy sphere model and allows comparing it with competing strate-gies. The comparisons yield insights into the interplay of mutation, multirecombination, and selection. Then, the covariance matrix adaptation mechanism originally formulated for evolution strate-gies is adapted for use with EGS in order to make the algorithm competitive on objective functions with large condition numbers of their Hessians. The resulting strategy is evaluated experimen-tally on a number of convex quadratic test functions.
Index Terms—Covariance matrix adaptation (CMA), evolution strategies, evolutionary gradient search (EGS), noise, quality gain analysis.
I. INTRODUCTION
E
VOLUTION strategies [1]–[4] and gradient search algo-rithms [5] are approaches to numerical optimization that differ fundamentally in several important aspects. Salomon’s evolutionary gradient search (EGS) [6] attempts to blend fea-tures of the two in order to combine the efficiency of gradient search strategies with the relative robustness of evolutionary ap-proaches. The contributions of the present paper are twofold. First, the basic iterative steps of EGS are studied in order to learn about the influence of the strategy’s parameters on opti-mization performance and to be able to draw comparisons with related evolution strategies. Recommendations with regard to the setting of strategy parameters are also given. Second, in an effort to achieve competitive performance on functions with different eigenvalue spectra of their Hessians, the covariance matrix adaptation (CMA) mechanism devised by Hansen and Ostermeier [7] is adapted for use in EGS. The resulting strategy could be called CMA-EGS. Numerical experiments on several objective functions show that the insights gained in the anal-ysis of the basic iterative steps are indeed useful under much more general conditions than those that they have been obtained under.Manuscript received July 18, 2005; revised May 9, 2006. This work was sup-ported in part by the Natural Sciences and Engineering Research Council of Canada (NSERC).
D. V. Arnold is with the Faculty of Computer Science, Dalhousie University, Halifax, NS, Canada B3H 1W5 (e-mail: [email protected]).
R. Salomon is with the Institute of Applied Microelectronics and Computer Science, University of Rostock, 18051 Rostock, Germany.
Digital Object Identifier 10.1109/TEVC.2006.882427
A. Basic Iterative Steps
The most basic gradient-based optimization strategy for the minimization of functions is the method of steepest descent. It iteratively updates a search point by step-ping in the direction of the negative of the gradient of the objec-tive function at the current location in search space. Steps made by the search point from one iteration to the next are referred to as search steps. If gradient information cannot be obtained directly, gradient strategies compute a finite-difference approx-imation to the gradient [8]. That approxapprox-imation is obtained by evaluating the objective function at a number of trial points close to the current search point, typically by stepping in direction of the coordinate axes. Steps made in order to determine a descent direction are referred to as trial steps. Depending on whether forward differences or central differences are employed, eval-uation of the objective function at either or points is required to obtain a gradient estimate, where is the search space dimensionality. Provided that the objective function is lo-cally smooth, the gradient estimate can be made to match the gradient with any degree of accuracy by making the trial steps sufficiently small.
Evolution strategies differ from gradient search algorithms both in their use of a population of search points and in the fact that rather than employing a regular pattern of trial steps, trial points (often referred to as offspring) are generated randomly. A search direction is inferred implicitly by the selection of fa-vorable trial points. Those trial points that are selected form the population of search points in the next time step. Typically, se-lection is based on rank within the set of offspring, and objective function values are used only to establish a ranking. Another fact that distinguishes evolution strategies from gradient search algorithms is that for the former, the number of trial points gen-erated per time step is flexible. There is no requirement that the number of offspring be or . Indeed, in the con-text of local optimization, evolution strategies often rely on far fewer than trial points per time step. As a consequence, the direction in which the population of search points moves may differ substantially from the (negative of the) gradient direc-tion. However, many “cheap” steps computed on the basis of a relatively small number of objective function evaluations may well be more effective in their sum than a few expensive ones. While Rechenberg [1] characterizes the resulting search process as a form of “stochastic gradient descent,” Beyer [9] points out that the search behavior of evolution strategies can be qualita-tively different from gradient descent in that it is much more exploratory in nature.
The EGS procedure introduced by Salomon [6] is a hybrid strategy that combines features of gradient-based algorithms and evolution strategies. As evolution strategies, EGS generates trial points by random mutations, and the number of trial points
generated per time step is flexible. As gradient strategies, it oper-ates with a single search point rather than with a population, and it uses objective function values rather than merely ordinal in-formation for inferring search directions. Provided that the vari-ance of the probability distribution used to generate trial points is sufficiently small, the gradient direction is approached with increasing accuracy as the number of trial points generated per time step increases. In an experimental evaluation presented in [6], the performance of EGS was superior to several variants of evolution strategies on a number of test functions.
In [10], a close connection between EGS and the -ES, an evolution strategy that is popular both for its amenability to theoretical analysis and for its good perfor-mance, was pointed out. See [4] for a taxonomy of evolution strategies. The form of recombination used by the -ES leads to the population effectively being contracted to a single search point that new trial points are generated from in every time step. The basic iterative steps that EGS and the -ES perform differ only in the way that the information gained from evaluating the trial points is used. The -ES uses objective function values only in order to obtain a ranking of the trial points generated. It then discards all but the best of them, and it applies global intermediate recombination—a simple, unweighted averaging—to the remaining ones. EGS, on the other hand, uses aweightedaverage ofall trial points in order to derive a new search point. The weight of a trial point is determined by the difference between its objective function value and the objective function value of the search point it was generated from, and it can be negative if the trial point is inferior to the search point.
The similarity between EGS and the -ES makes it possible to use the tools developed for the analysis of evolution strategies when studying properties of EGS. In [10], the perfor-mance of the basic EGS steps with isotropic mutations was an-alyzed on the infinite-dimensional sphere model and compared with that of the -ES. It was seen that while EGS can offer a significant performance advantage compared with the -ES, it does have deficiencies when implemented on parallel computers, as well as in the presence of noise. In par-ticular, while the serial efficiency of the -ES increases with increasing population size (see [3]), that of EGS peaks at and decreases for larger numbers of trial points gener-ated per time step. The potential speedup resulting from evalu-ating trial solutions in parallel is sublinear for EGS, while it is (slightly) superlinear for the -ES. For finite , it can be seen in experiments that the parallel performance advantage of the -ES for large numbers of trial points generated per time step is not as pronounced as for , but it is nonethe-less present.
Moreover, it was seen in [10] that the performance of EGS degrades with increasing amounts of noise present. The reason for the better search capabilities in the presence of noise of the -ES was found not to be that strategy’s reliance on ordinal information rather than function values, but instead its better use of the genetic repair effect. As seen in [1], [3], and [11], the -ES benefits from multirecombination on the sphere model in that the averaging of candidate solutions implicit in the recombination procedure reduces the “harmful”
components of mutation vectors. As a consequence, the search steps made by the strategy are shorter than its trial steps, and the strategy is able to operate with mutation strengths larger than those of a comparable strategy that does not use multire-combination. In [12], it was seen that in the presence of noise, increased mutation strengths have the additional benefit of re-ducing the noise-to-signal ratio that the strategy operates under. EGS as introduced in [6] explicitly ensures that trial steps and search steps are of the same length. As a result, it is not ca-pable of operating with mutation strengths as large as those of a comparable -ES, and it thus suffers from a higher noise-to-signal ratio.
In light of these deficiencies, in a recent paper, Salomon [13] has proposed two important modifications to the EGS proce-dure. Recognizing that the inferior parallel performance of EGS is due to a negative bias resulting from the fact that typically, the majority of trial points are inferior to the search point they orig-inate from, Salomon suggests the use of “inverse mutations.” That is, for every trial step, a symmetric trial step is made in the opposite direction. In the subsequent averaging, the weight associated with the step is chosen proportional to the difference between the function values of the two trial points and is thus independent of the function value of the search point. This pro-cedure is reminiscent of the use of central differencing instead of forward differencing in gradient strategies and has proven to be valuable in experiments reported in [13]. The second mod-ification consists in the introduction of a second step size pa-rameter. One parameter is used to control the length of the trial steps, the other parameter controls the search steps. Thus, it be-comes possible to imitate the result of the genetic repair effect observed in evolution strategies, and to reap the resulting bene-fits in the presence of noise. Interestingly, it will be seen below that the use of a second step length is closely akin to the idea of using rescaled mutations in evolution strategies, as proposed by Ostermeier in [1] and analyzed by Beyer [14], [15].
B. Step Length Control and Nonisotropic Mutations
Of course, the basic iterative steps discussed thus far are but one part of a numerical optimization strategy. A further impor-tant issue to be addressed is that of step length control. Gra-dient algorithms, EGS, and evolution strategies each have their own mechanisms for that purpose. When using the method of steepest descent, a locally optimal step length is usually deter-mined by conducting a one-dimensional line search along the di-rection of the (negative of the) gradient. In the presence of noise, experiments reported in [16] have shown that rapidly decreasing step lengths and convergence to a nonoptimal point may result on functions as simple as the sphere model. The original EGS strategy described in [6] tries out two steps, one slightly longer than the previous search step, the other one slightly shorter, and settles for the better of the two. The situation is complicated by the introduction of a second step length, as proposed in [13] and discussed above. One possibility inspired by the effects of genetic repair in evolution strategies as well as by the idea of using rescaled mutations is to choose the length of the search steps to be a constant fraction of the length of the trial steps, thus leaving only the former to be controlled. In the realm of evolu-tion strategies, step length adaptaevolu-tion mechanisms including the
1/5 success rule [17], mutative self-adaptation [17], [18], and cumulative step length adaptation [19] are commonly used. In the experiments described in [16], cumulative step length adap-tation has proven relatively robust with respect to the effects of noise. Analytical results regarding the properties of cumulative step length adaptation on the sphere model can be found in [20] and [21].
Finally, it is well known that while using isotropic mutations (i.e., using a mutation covariance matrix that is a scalar multiple of the unity matrix) is appropriate for the sphere model, the per-formance of isotropic evolution strategies rapidly declines with the increasing condition number of the Hessian matrix of the objective function. As discussed by Whitleyet al.[22], in order to achieve good performance on functions that contain long val-leys or ridges that need to be followed, it is necessary to adapt the shape of the mutation distribution to the local characteristics of the problem at hand. Interestingly, even though EGS uses a weighted sum of all its trial steps to determine a search step where the weights can vary widely, the same can be observed to hold true for EGS. Salomon [23] proposes to use individual step sizes for the dimensions, and thus to operate with a muta-tion covariance matrix in which all off-diagonal entries are zero. Much improved performance on ellipsoidal objective functions the axes of which are aligned with the axes of the coordinate system can be achieved. However, the resulting algorithm’s per-formance is not invariant with respect to the orientation of the coordinate system. Progress along valleys or ridges that are not parallel to one of the main axes is still very slow. Salomon [6] also suggests using a momentum term in order to improve the ridge following capabilities of EGS. However, as pointed out by Poland and Zell [24], while the use of a momentum term is useful for ridge functions, it is of limited use if the eigenvalues of the Hessian of the objective function are widely spread and not dominated by a single value that is much smaller than all of the others. For multirecombination evolution strategies, Hansen and Ostermeier [7] have introduced a covariance adaptation mech-anism that has been found in experiments to reliably transform any convex quadratic function into the simple sphere function. In the present paper, that algorithm is adapted for use in EGS.
C. Overview
The remainder of this paper is organized as follows. In Section II, the EGS procedure with the modifications described in [13] is outlined and the sphere model is introduced as an important model for studying local search properties of op-timization algorithms. In Section III, the performance of the modified EGS strategy with isotropic mutations is investigated on the sphere model. A number of simplifications are made in the calculations that hold in the limit , but that are seen to provide good approximations for moderately large values of . Section IV generalizes the results from Section III by con-sidering the effects of noise present in the observed objective function values. In Section V, the performance of the modi-fied EGS strategy is compared with that of the original EGS procedure as studied in [10], as well as with several variants of evolution strategies. Both the cases of fitness-proportionate and uniform noise strength are considered for . In Section VI, the CMA mechanism is formulated for EGS and
tested on a number of objective functions. It is seen that while CMA largely works for EGS as well as it does for evolution strategies, there are some problems with step length adaptation in low-dimensional search spaces. It is then seen that in the presence of noise, the flexibility of EGS that is due to its use of a rescaling parameter and that had been found for isotropic muta-tions on the sphere model can be observed for the CMA variant on other objective functions as well. Section VII concludes with a brief summary and suggestions for future research.
II. PRELIMINARIES
This section outlines the modified EGS procedure for the minimization of functions as described in [13] and motivates the changes that have been made to the original algorithm proposed in [6]. It then briefly summarizes some no-tational conventions and basic results for the sphere model.
A. Modified Evolutionary Gradient Search (EGS)
An iteration of the modified EGS procedure with isotropic mutations updates the search point of the strategy in three steps.
1) Generate trial points ,
where mutation strength determines the step length and the are vectors consisting of independent, stan-dard normally distributed components.
2) Determine the objective function values of the trial points and compute the weighted sum
(1) of the vectors.
3) Replace the search point by , where
(2) is referred to as the EGS progress vector.
The use of nonisotropic mutations as well as the discussion of step length adaptation is deferred until Section VI. Notice that an iteration of the strategy thus described differs from one of the original EGS procedure in two important aspects. First, the modified EGS strategy generatestwotrial solutions for every mutation vector: one in direction of that vector, and a second one by taking a step of the same length in the opposite direction. The difference of the function values of the two points generated is used to weight the respective mutation vector in (1). The dif-ference between this procedure and that of the original EGS al-gorithm is reminiscent of the difference between central differ-encing and forward differdiffer-encing when using gradient strategies. It will be seen in Section III that for EGS, the use of central dif-ferencing has the desirable effect of eliminating a performance hampering bias term in the computation of . Second, the introduction of the factor in (2) allows for making search steps that differ in length from the trial steps. While the length of the trial steps is roughly for large , that of the search steps is . The modification is akin to the use of rescaled
mutations in evolution strategies as suggested by Ostermeier and Rechenberg [1]. According to Beyer [14], [15], for evolu-tion strategies, the use of rescaled mutaevolu-tions can lead to greatly improved performance in the presence of noise. The investiga-tions below confirm that the same holds true for EGS.
B. The Sphere Model
Since the early work of Rechenberg [17], the local perfor-mance of evolution strategies has commonly been studied on the quadratic sphere
where the task is minimization and where is the optimal solution. The sphere serves as a model for objective functions in the vicinity of well behaved local optima. See [16] for a justification of the usefulness of such considerations. Using appropriate normalizations, most results arrived at for the quadratic sphere can be extended to general spherically
symmetric functions , where and
where is strictly monotonic.
In order to quantify the local performance of point-based search strategies, consider the effect of adding a vector to the current search point . The EGS strategy does so both when generating trial points and when replacing the current search point at the end of an iteration. Denoting the respective dis-tances of and from the optimal solution by and , the difference between objective func-tion values and can be used to determine both the quality of trial points and the rate at which the strategy approaches the optimum. Keeping with the terminology estab-lished in connection with evolution strategies, is referred to as the fitness advantage associated with vector .1
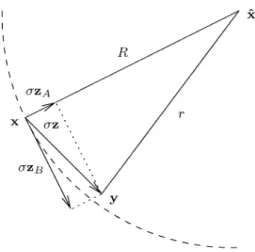
The commonly used approach to determining on the sphere model relies on a decomposition of vector that is il-lustrated in Fig. 1. A vector originating at search space lo-cation can be written as the sum of two vectors and , where is parallel to and is in the -dimen-sional hyperplane perpendicular to that. The vectors and are referred to as the central and lateral components of vector
, respectively. The signed length of the central component of vector is defined to equal if points towards the optimal solution and to equal if it points away from it. Using elementary geometry, it can easily be seen from the figure that
and therefore, rearranging terms and realizing that , that
(3)
1While the notation adopted here is deliberately brief and does not reflect that explicitly, it is important to keep in mind that the fitness advantage(z) depends not only on vectorz, but also on the mutation strengthand, in case
zis a progress vector, on the rescaling factor.
Fig. 1. Decomposition of a vectorzinto central componentz and lateral componentz . Vectorz is parallel to^x 0 x, vectorz is in the hyperplane perpendicular to that. The starting and end pointsxandy = x + zof vector
zare at distancesRandrfrom the optimal solution^x, respectively.
Writing this in terms of normalized quantities
(4) it follows:
(5) for the normalized fitness advantage associated with vector . Equations (3) and (5) are used in two contexts. First, by con-sidering mutation vectors they allow computing the fitness dif-ferences that occur in the definition of in (1). Second, by considering progress vectors they help quantify the speed with which the strategy approaches the optimum.
In case is a mutation vector, the signed length of the central component of is standard normally distributed as the distribution of is isotropic. Moreover, for large , the influ-ence of the central component on the overall squared length of becomes negligible, and thus and are asymptotically in-dependent. Since is the sum of squares of independent, standard normally distributed random variables, it has expecta-tion and variance . For increasing is thus in-creasingly well approximated by unity, and using (5), it follows by considering both and that
(6) Letting denote the distances from the optimal solution to
, respectively, and letting
(7) it follows immediately that:
and therefore, using (4) and (6), that
(8) This result will be used below to determine the weights of the mutation vectors in the summation in (1).
In case is a progress vector, the expected normal-ized associated fitness advantage
(9) quantifies the EGS quality gain, a commonly used performance measure, as motivated in [3].2In order to determine the quality
gain of EGS on the sphere model using (5) and (9), expected values of the signed length of the central component and of the overall squared length of the EGS progress vector need to be computed. The computation of the quality gain in the ab-sence of noise is the subject of Section III; the noisy case is considered in Section IV.
III. PERFORMANCE OF THEMODIFIEDEGS STRATEGY ON THESPHEREMODEL
Due to the definition of the EGS progress vector in (2) it is clear that its squared length is , and therefore that
(11) In order to compute , notice that enters the def-inition of normalized to unit length, and that thus any vector parallel to can be substituted instead provided that it is normalized as well. In particular, writing for the distance from the search point to the optimal solution and defining
(12) it follows from (2) that:
(13)
2Auger and Hansen [25] consider the progress rate (another popular perfor-mance measure) of evolution strategies and point out that a negative progress rate does not necessarily imply divergence. For a simple example, they show that almost sure convergence and divergence in mean can go hand in hand. Sim-ilarly, negative quality gain as defined in (9) does not necessarily imply that the strategy fails. In analogy to a suggestion in [25], a more useful definition of the quality gain on the sphere model is
1 =N
2E log R
r (10)
whereR = kxkandr = kx + z kdenote consecutive distances of the search point from the optimal solution. That definition has previously been used in [16] and [20], and will be employed for all empirical measurements of the quality gain on the sphere model in this paper. The theoretical considerations can nonetheless use the definition in (9) as they hold only in the limitN ! 1, in which case it can be seen by Taylor expanding the logarithm in (10) that the two definitions agree.
According to (1), (4), (7), and (8)
Considering the signed length of the central component yields
(14) For the overall squared length of it follows from (1) using (7) that:
where of course the components of are independently standard normally distributed and where
is a crosstalk term. Mean and variance of that term can be shown to tend to zero as the search space dimensionality increases, and the term thus vanishes in the limit . Furthermore, making use of the fact as , it follows from the definition of using (8) that:
(15) Combining the results from (14) and (15), it follows using (13) that:
(16)
Recall that the are simply standard normally distributed random variables, and that the radicand thus is -distributed with degrees of freedom. Also, notice that in contrast to the corresponding result derived in [10] for the original EGS pro-cedure, but similar to evolution strategies, the signed length of the central component of the progress vector of the modified EGS algorithm (and indeed the progress vector itself) is inde-pendent of the length of the trial steps. The dependence of that quantity on the mutation strength in the original EGS procedure
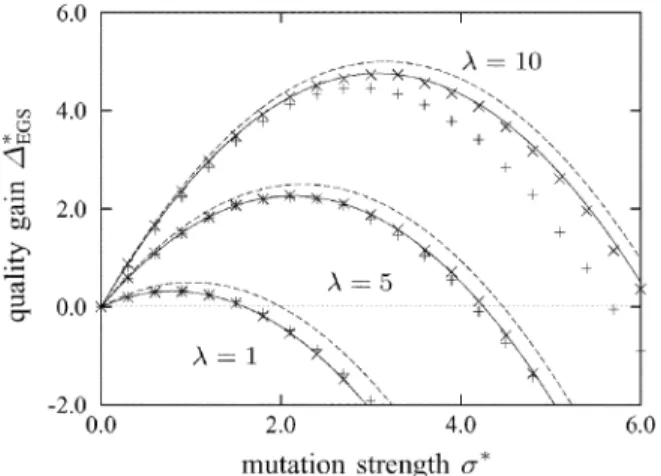
Fig. 2. EGS quality gain 1 plotted against the normalized mutation strength for 2 f1; 5; 10gand = 1. The points represent measurements from EGS runs on spheres withN = 40(+)andN = 400(2). The solid lines represent asymptotically exact results from (17), the dashed lines those from the approximation (18).
was a consequence of a negative bias of that strategy that results from the fact that the fitness advantage associated with muta-tion vectors is more often negative than it is positive. This is reflected in (5) by the negative term quadratic in . The mod-ified EGS procedure eliminates that bias by evaluating mutation along with , and computing the difference between the corresponding objective function values in order to weight vector in (1). It will be seen below that removing that bias has a beneficial effect on the performance of the strategy.
Writing for it follows from (11) and (16) that the quality gain of the modified EGS procedure on the sphere model in the limit is
(17) Due to the properties of the -distribution, is well approx-imated by (the error is below 5% for and below 1% for ). Substituting for yields approximation
(18) for the quality gain of the modified EGS procedure on the high-dimensional sphere model. Fig. 2 compares quality gain predic-tions made using (17) and (18) with measurements from EGS runs on the sphere model. It can be seen that while the analyt-ical results were derived under the assumption of infinite search space dimensionality, the agreement with the measurements is good for as small as 40 if is not too large. For , the discrepancy between predictions and measurements is consider-able for , but tolerable for most purposes for . The result from (18) is to be compared with the corresponding approximation
(19) for the original EGS procedure derived in [10]. Disregarding the parameter (that can without loss of performance be set to 1 in the noise-free case), the negative term that is quadratic
Fig. 3. Serial efficienciesof strategies on the sphere model in the limitN !
1plotted against the parameterthat determines the number of trial points generated per time step. The data points for the(=; )-ES with optimally chosenand for the original EGS procedure have been computed, as described in [3] and [10], respectively. The curve for the(=; )-ES is not smooth as can take on integer values only. The data points for the modified EGS procedure have been obtained from (17) with = 1.
in is unaffected. However, the switch from forward differ-encing to central differdiffer-encing in the weighting of mutation vec-tors has led to the disappearance of the term quadratic in the mutation strength in the denominator of the positive term that hampered progress towards the optimum and limited the size of useful mutation strengths in the original EGS procedure. For any nonzero mutation strength, the term that contributes positively to the quality gain is larger for the modified EGS procedure than it is for the original algorithm.
Computing the derivative of (17) with respect to and finding the positive zero yields optimal mutation strength
(20) Reinserting this result into (17) results in maximum quality gain (21) With increasing , the optimal quality gain of the modified EGS procedure thus approaches , independent of . In contrast to the original EGS procedure, but like the -ES, the modi-fied EGS strategy thus exhibits a linear speedup when increasing the number of trial directions generated per time step.
In order to have a fair comparison that accounts for the differing computational costs of the various strategies, it is common to define the serial efficiency of a strategy as the quality gain per evaluation of the objective function for opti-mally set mutation strength. Clearly, the number of objective function evaluations per time step is for the -ES, it is for the original EGS procedure, and it is for the modified EGS strategy. Fig. 3 contrasts the respective serial efficiencies of the various strategies. While the serial efficiency of the -ES approaches a value of 0.202 as increases and that of the original EGS procedure decreases once ex-ceeds five, that of the modified EGS strategy asymptotically approaches a value of 0.25. The modified EGS procedure is superior to the -ES for any value of . However, notice that for small values of the original EGS procedure is
somewhat more efficient than the modified one as it requires fewer objective function evaluations per time step.
IV. PERFORMANCE IN THEPRESENCE OFNOISE
The assumption that the objective function value of a can-didate solution can be determined exactly is usually an ide-alization. Real-world optimization problems often suffer from noise that can stem from sources as different as—and not re-stricted to—measurement limitations, the use of Monte Carlo methods, and human computer interaction. Understanding how noise impacts the performance of optimization strategies is im-portant for choosing appropriate strategy variants, for the sizing of strategy parameters, and for the design of new, more noise resistant algorithms.
The most commonly employed noise model assumes additive Gaussian noise. That is, it is assumed that when evaluating the objective function at some search space location , the value obtained is normally distributed with mean and with some standard deviation . In [10], it had been seen that the original EGS procedure is generally inferior to the -ES on the noisy sphere model. The -ES is able to make use of what has been termed the genetic repair effect by Beyer [3], [11]: the averaging of mutation vectors that is implicit in the multirecombination procedure together with the selection mechanism of the strategy leads to the lateral component of the -progress vector being shorter (by a factor of ) than that of the mutation vectors. The length of the central component is not affected significantly. As a consequence, the -ES is able to use larger mutation strengths than those useful for evolution strategies that do not employ multirecombination. As discussed in [12], in the presence of noise, larger mutation strengths have the advantage of reducing the noise-to-signal ratio that the strategy operates under. In the limit of infinite search space dimensionality, increasing the population size parameters and makes it possible to increase the mutation strength to a degree that all but eliminates the noise. In finite-dimensional search spaces, the potential benefits of genetic repair are more limited, but as seen in [26] still considerable.
It was seen in [10] that the original EGS procedure is not able to benefit from genetic repair to the degree that the -ES does for two reasons. First, the negative bias that leads to the oc-currence of the mutation strength in the denominator in (19) puts a limit on useful mutation strengths. This has been addressed in Section III, where it was seen that the use of the central dif-ferencing-like weighting of mutation vectors in (1) leads to the elimination of the bias and the disappearance of the performance hampering term from the quality gain law. Second, the ability of the original EGS procedure to use large mutation strengths is severely limited by the fact that it uses progress vectors that are of the same length as its mutation vectors. It is for this reason that the modified strategy introduced above uses the rescaling factor in (2). That factor decouples the length of the progress vector from that of the mutation vectors, making it possible to emulate the effect that the -ES benefits from due to its use of multirecombination. The same idea has been suggested for the -ES by Ostermeier and Rechenberg [1] and ana-lyzed by Beyer [14], [15]. The remainder of this section studies
the potential benefits that result from the use of the rescaling factor in EGS.
As the weighting factors depend on objective function mea-surements, the presence of noise affects the weighting of the mutation vectors in (1). Assuming that the evaluation of all trial points in a time step is subject to the same noise strength and introducing normalized noise strength
(22) equation (8) is to be replaced by
(23) in order to reflect themeasuredfitness difference, where is a standard normally distributed random variable that reflects the effects of noise. The factor in the second term on the right-hand side is a result of the fact that the modified EGS procedure evaluates two candidate solutions rather than a single one when weighting a mutation vector, and that the variance of the sum of the two noise terms equals the sum of the two variances.
Using (23) in the definition of vector according to (12), it follows that in the presence of noise:
Considering the signed length of the central component yields (24)
As the and the are independently drawn from a stan-dardized normal distribution, the expected values of the terms on the right-hand side are and zero, respectively. For the overall squared length of in the presence of noise it follows in close analogy to (14), but using (23) instead of (8), that:
(25) The expected values of the terms on the right-hand side are
, zero, and , respectively.
In order to compute the quality gain of the modified EGS pro-cedure on the noisy sphere using (11) and (13),
needs to be computed. Unfortunately, according to (24) and (25), the quantities involved have distributions that make it im-possible to compute the expectation in closed form. Instead, as done in [10] for the original EGS strategy, we make two simpli-fications. First, we ignore the terms in (24) and (25) that have zero mean. The error introduced by this simplification is most
Fig. 4. Quality gain1 plotted against normalized mutation strength for = 10; = 1, and normalized noise strengths 2 f0:0; 4:0; 8:0g. The points represent measurements from EGS runs on spheres withN = 40(+) andN = 400(2). The solid and dashed lines represent the approximations (26) and (27), respectively.
noticeable for small values of as for larger numbers of search directions, the other terms in (24) and (25) solidly dominate those with mean zero. Second, we assume that
. Notice that the two terms are identically distributed but independent. For increasing , due to the properties of the -distribution, the sums are dominated by their expectations, and the error introduced by the assumption of them being equal becomes less severe. Experiments show that for as small as ten, the resulting error is insignificant for most practical pur-poses. From the simplifications, it follows:
as an approximation for the expected signed length of the central component of the EGS progress vector. Using this approxima-tion in (11) and writing for the noise-to-signal ratio that the strategy operates under yields approximations
(26)
(27) for the quality gain of the modified EGS strategy on the noisy sphere model. Fig. 4 compares predictions made using (26) and (27) with measurements from EGS runs with . It can be seen that the quality of the approximation is good provided that is not too small. The absolute error is smaller in the presence of noise than in its absence, thus providing a justification for the simplifications made in the derivation of the quality gain laws. Fig. 5 illustrates the quality of approximations (26) and (27) for varying values of . It can be seen that the accuracy of the pre-dictions is best for small values of . Larger values of as well as of generally require higher search space dimensionalities in
Fig. 5. Quality gain1 plotted against normalized mutation strength for = 10; = 4:0, and 2 f0:5; 1:0; 2:0g. The points represent measure-ments from EGS runs on spheres withN = 40(+)andN = 400 (2). The solid and dashed lines represent the approximations (26) and (27), respectively.
TABLE I
QUALITYGAINLAWS ON THENOISY, INFINITE-DIMENSIONALSPHERE
order for the approximations to be good. The same holds true for the corresponding quality gain approximation for the -ES with rescaled mutations derived by Beyer [14].
V. EVOLUTIONSTRATEGIESVERSUSEVOLUTIONARY
GRADIENTSEARCH(EGS)
Using the results thus derived, the performance of the mod-ified EGS procedure can now be compared with that of the original EGS strategy, the -ES, and the -ES with rescaled mutations. Comparisons are presented first by consid-ering single time steps only, and then for the cases of fitness-pro-portionate and uniform noise strengths.
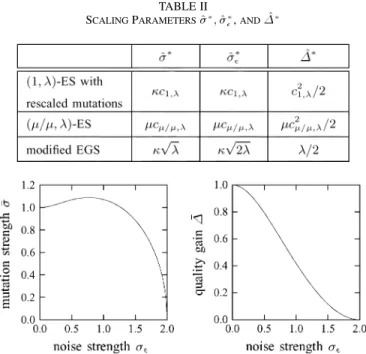
Table I compares the quality gain approximation (27) for the modified EGS procedure with those for the original EGS strategy derived in [10], the -ES with rescaled mutations analyzed in [14], and the -ES investigated in [12]. Common to all of the quality gain laws is the appearance of two terms: a term that contributes positively and that is due to the central components of the progress vectors, and a negative term that is due to the progress vectors’ lateral components. The dependence of those terms on strategy and problem param-eters differs from strategy to strategy. However, introducing standardized quantities
TABLE II
SCALINGPARAMETERS^ ; ^ ,AND1^
Fig. 6. Optimal standardized mutation strengthand corresponding standard-ized quality gain1of strategies on the noisy sphere model plotted against stan-dardized noise strength. The curves describe the behavior of the(1; )-ES with rescaled mutations, the(=; )-ES and the modified EGS procedure, and have been obtained from (28).
where the scaling parameters , and for the various strategies are given in Table II, the quality gain laws of the -ES with rescaled mutations, the -ES, and the modified EGS procedure can all be written as
(28) The original EGS strategy does not fit into this pattern due to its negative bias discussed in Section III. For the other strate-gies, the dependence of optimal standardized mutation strength and corresponding standardized quality gain on the standardized noise strength is illustrated in Fig. 6. Clearly, is the optimal normalized noise strength in the absence of noise, and is the corresponding quality gain. The scaling parameter for the noise strength determines the normalized noise strength up to which positive quality gain is possible. Altogether, the fol-lowing conclusions can be drawn from Tables I and II and Fig. 6. • The effect of the rescaling achieved by the inclusion of the factor in the definition of the strategy takes the same functional form for the modified EGS procedure as it does for the -ES with rescaled mutations. For the -ES, a similar effect is achieved implicitly by virtue of multirecombination as witnessed by the appear-ance of the factor in the denominator of the negative term in the respective quality gain law.
• As the strategies differ in how they combine the informa-tion obtained by evaluating their offspring, so do the posi-tive terms in the respecposi-tive quality gain laws. The effects of comma selection (and, for the -ES, multirecombi-nation) are captured by the progress coefficients and . The corresponding term for EGS is and results from the weighted summation of mutation vectors, where
Fig. 7. Serial efficiencyplotted against normalized noise strength for sev-eral evolution and EGS strategies. The strategies considered are the(1; )-ES with rescaled mutations( = 10; 2 f1; 4g), the(=; )-ES( = 10; =
3), the original EGS strategy( = 9), and the modified EGS procedure( =
5; 2 f1; 4g).
weights are determined by differences between objective function values.
• The influence of the noise-to-signal ratio is similar for all of the strategies considered. It appears in the form of the term in the denominator of the posi-tive contribution to the quality gain for the evolution strate-gies. For the original EGS procedure, additionally, the mu-tation strength enters this term due to the negative bias of mutations discussed above. The modified EGS strategy fixes that bias by using central differences, and it divides the square of the noise-to-signal ratio by two as it relies on two objective function evaluations per mutation vector rather than on a single one.
• The -ES with rescaled mutations as well as the mod-ified EGS procedure can achieve the respective maximal quality gains that they can attain in the absence of noise even if noise is present. Increasing allows the strategies to operate with larger mutation strengths and thus to reduce the noise-to-signal ratio to zero. Notice that this rescaling is possible for any value of . The -ES is capable of operating with large mutation strengths by choosing and large. The original EGS procedure is not able to benefit from the rescaling of mutation vectors, and is thus gener-ally inferior in the presence of noise.
• Of the strategies considered, the -ES and the mod-ified EGS procedure exhibit a linear increase in quality gain when increasing (and, for the -ES, ). Both the -ES and the original EGS strategy scale sublinearly. Fig. 7 visualizes the serial efficiencies of several evolution and EGS strategies on the noisy sphere model. All of the strate-gies considered perform ten objective function evaluations per time step. It can be seen from the figure that the -ES ex-hibits relatively low performance in the absence of noise, but that its robustness with regard to the effects of noise can be in-creased by increasing . The -ES is more efficient than the -ES in the absence of noise, but does not offer the same flexibility in its rescaling of mutation vectors. An increase in population size is necessary in order for better performance in
Fig. 8. Serial efficiencyof the modified EGS strategy with = 5and 2
f1; 4; 10gplotted against normalized noise strength . The points represent measurements from EGS runs on spheres withN = 4( 1); N = 40(+)and
N = 400(2). The solid lines have been obtained from (26).
the presence of noise to be achieved. However, as seen in [26], choosing and large can lead to a loss in serial efficiency in low-dimensional search spaces. The original EGS procedure is more efficient than both types of evolution strategy in the ab-sence of noise, and, for the case considered, also in its preab-sence. However, it does not benefit from an increase in to the de-gree that the -ES does, and it does not offer the pos-sibility of rescaling in the presence of noise. For values of larger than those considered here, the -ES would be a better strategy in the absence of noise, and potentially both the -ES and the -ES with rescaled mutations would be better in its presence. Finally, the modified EGS procedure combines the advantages of the two kinds of evolution strategy, while at the same time being nearly as efficient as the original EGS strategy in the absence of noise.
Fig. 8 compares predictions from (26) with measurements of EGS runs in search spaces with . It can be seen that even though infinite search space dimensionality had been assumed in the derivation of (26) and the accuracy of the approximation decreases with decreasing , the benefits of increasing in the presence of noise can be observed for as small as 4. It is important to keep in mind, however, that the analysis only applies to the quadratic sphere model, and that other fitness functions are likely to limit useful values of . In Section VI, it will be seen that after successful CMA, some of the benefits of increasing can be observed for convex quadratic functions other than the sphere. The implications of the choice of for fitness functions that are not convex quadratic remain to be studied in future work.
Finally, approximations like (26) describe the behavior of search strategies in single time steps. Different global behaviors of the algorithms can be observed depending on how the noise strength varies with the location in search space. Provided that the mutation strength is adapted successfully, without noise present EGS (like evolution strategies) exhibits stochastic linear convergence, as illustrated in Fig. 9. The decrease in logarithmic function values of the search point is a random variable with a stationary distribution. When plotted against time, logarithmic objective function values fluctuate around a straight regression
Fig. 9. Objective function valuef(x)of the search point on the sphere model plotted against timet. The curves represent measurements from typical EGS runs on the sphere model for the cases of no noise, fitness-proportionate noise, and noise of uniform strength. In all cases, the step length is controlled using cumulative step length adaptation as described in Section VI. The parameters used for the measurements areN = 10; = 10; = 1, and =p10and
= 0:001for the cases of fitness-proportionate and uniform noise strengths, respectively.
line the slope of which determines the speed of convergence. The frequently considered case of fitness-proportionate noise
strength (i.e., , and therefore )
leads to the same type of global behavior, but with a lower speed of convergence. Qualitatively different behavior results if the noise strength is independent of , and thus uni-form throughout the search space. In that case, the strategy is not able to approach the optimum indefinitely but instead re-mains at a certain distance from it. As a consequence, objective function values of the search point approach a nonoptimal limit value as indicated in Fig. 9. For the -ES, according to Beyer [3] that limit value is
(29) For the modified EGS procedure, the corresponding result can be derived by using (27) to determine the point at which nonzero quality gain ceases to be possible. Assuming , letting the mutation strength tend to zero, and using (22) yields
(30) for the limit objective function value. Clearly, that value can be minimized by increasing or , where increasing has the stronger effect and the additional advantage of not increasing computational costs. The same effect can be achieved for the -ES by increasing and in equal proportions, albeit at the cost of a linear increase in computational effort.
Finally, it is important to note that while (29) and (30) have been derived in the limit , the simplifications made in Sections II and III introduce inaccuracies mainly for large values of the mutation strength. As the limit objective function value of EGS is achieved with small mutation strengths, the inverse pro-portionality of limit objective function values to holds even
for small values of . This will be seen in Section VI in exper-iments involving EGS with CMA on several convex quadratic objective functions. The potential benefits from the choice of for fitness functions that are not convex quadratic are likely to be more limited and will be subject of future work.
VI. BEYOND THESPHERE
In the realm of evolution strategies, the sphere model derives part of its significance from the existence of powerful mutation CMA algorithms. Using a mutation covariance matrix that is adapted to the problem at hand can speed up the convergence of evolution strategies by several orders of magnitude. As rec-ognized by Rudolph [27], ideally, the covariance matrix is the inverse of the Hessian matrix of the objective function at the cur-rent search point. In that case, the local performance of the evo-lution strategy is identical to that of an isotropic strategy on the sphere model. The CMA algorithm of Hansen and Ostermeier [7], in particular, has been found to successfully adapt the muta-tion covariance matrix for arbitrary convex quadratic objective functions. This section first briefly outlines that mechanism and describes the small modifications necessary to make it useful in connection with EGS. It then evaluates experimentally the per-formance of the resulting CMA-EGS strategy on a number of convex quadratic objective functions with greatly varying eigen-value spectra.
A. Covariance Matrix Adaptation (CMA)
The CMA-ES described in [7] accumulates consecutive search steps in order to provide information on the basis of which adaptation of the mutation covariance matrix is per-formed. Realizing that it may be advantageous to adapt the overall step length on a time scale shorter than that used for adapting the shape of the distribution, trial points are generated with covariance matrix , where step length parameter is adapted separately from symmetric, positive definite matrix . Adaptation of the former uses the idea of cumulative step length adaptation introduced by Ostermeier
et al. [19]. Adaptation of the latter is done with the implicit goal of maximizing the probability of replicating successful steps. Somewhat inaccurately, is referred to as the mutation covariance matrix. As the CMA-ES, CMA-EGS utilizes two -dimensional vectors and referred to as search paths that hold exponentially fading records of the most recently taken steps. An iteration of CMA-EGS updates the search paths along with the search point , the mutation strength , and matrix using the following six steps (using “ ” to denote the assignment operator).
1) Compute an eigendecomposition of the mutation covariance matrix such that the columns of matrix are the normalized eigenvectors of and is a diagonal matrix the diagonal elements of which are the square roots of the eigenvalues of .
2) Generate trial points
where the are mutation vectors consisting of inde-pendent, standard normally distributed components. 3) Determine the objective function values of the trial
points and compute the weighted sum
of the vectors.
4) Compute the EGS progress vector
and update the search point according to
5) Update the search paths according to
and
where as recommended in [7].
6) Update covariance matrix and step length according to
and
where and , as
recom-mended in [7].
Notice that steps 2)–4) closely parallel steps 1)–3) in Section II-A, except that there, mutations are isotropic. The adaptation procedure in steps 5) and 6) differs from that of the CMA-ES described in [7] only in two details: First, as in [20] and [21], adaptation of the step length is performed on the basis of the squared length of the search path rather than based on its length. The change simplifies the formulas involved without significantly impacting performance. Second, the coefficients in the update rules for the search paths in step 5) have been modified in order to account for the difference between the lengths of the progress vectors of evolution strategies and EGS. It is important to point out, however, that the settings of the cumulation and damping parameters have not been altered from the -CMA-ES, and that potentially better performance could be achieved if they were optimized for CMA-EGS.
Finally, realizing that the eigendecomposition in step 1) is ex-pensive and that its cost may for large outweigh the cost of evaluating the trial points, Hansen and Ostermeier [7] suggest to perform it only every steps, and to use slightly outdated matrices and in between. We have followed that sugges-tion for without observing a significant loss in search performance. Furthermore, in rare cases, the covariance matrix may lose positive definiteness due to numerical inaccuracies.
Such cases are easily detected (as eigendecompositions are per-formed) and fixed (by negating the sign of negative eigenvalues).
B. Experimental Evaluation
In order to evaluate the performance of CMA-EGS and to compare it with that of the -CMA-ES, experiments have been run for a range of search space dimensionalities and noise levels on the sphere model, as well as on the following three convex quadratic test functions:
Note that while the functions are separable and their respective optima are at the origin of the coordinate system, CMA-EGS (as the -CMA-ES) does not make use of these facts. Its behavior is invariant with regard to rigid transformations of the coordinate system, and the experiments could have been carried out using arbitrarily rigidly transformed coordinates without changing the results. The sphere was included in the comparison as it is the easiest of all convex quadratic test functions. On the sphere, there is no need for adapting the mutation covariance matrix (provided that it is initialized to the identity matrix). The behavior of CMA-EGS on the sphere is generally well described by the results derived for the isotropic strategy in Sections III–V. The remaining three test functions do require adaptation of the mutation covariance matrix in order for CMA-EGS to achieve good performance. After adaptation is complete, CMA-EGS achieves the same rate of convergence on any of the convex quadratic test functions as it does on the sphere. The length of the adaptation phase depends on the eigenvalue spectrum of the objective function. All three of the functions considered have condition number , but they differ in their respective eigenvalue spectra. The cigar has one eigenvalue much smaller than all of the others and resembles a sphere that is stretched by a factor of 1000 in one dimension. Similarly, the discus has one eigenvalue that is much larger than all of the others and resembles a sphere that is squashed by a factor of 1000 in one dimension. The ellipsoid has an eigenvalue spectrum that is not dominated by any one value.
For all experiments reported below, the initial search point is . The strategies’ initial step length and muta-tion covariance matrix are and , respectively. Search paths and are zero initially. The experimental con-ditions are thus the same as in [7].
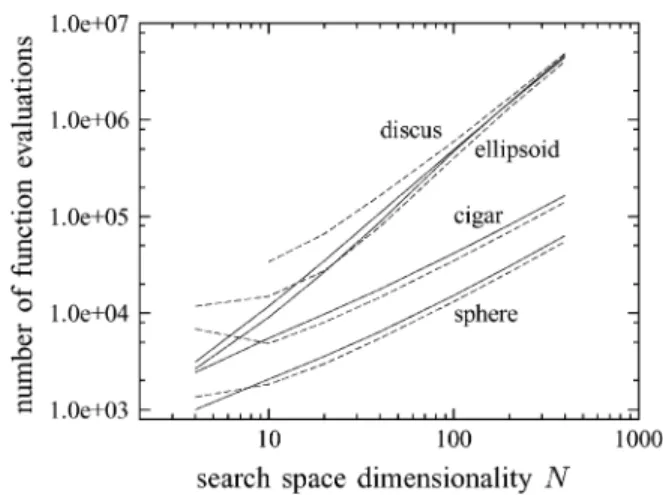
Fig. 10 compares the performance of the CMA-EGS strategy with and with that of the -CMA-ES in the absence of noise. Notice that both strategies generate and evaluate ten trial points per time step and are, therefore, im-mediately comparable. In the absence of noise, the choice of is optimal for the evolution strategy, and the perfor-mance of EGS is best for small values of . The experiments serve as a test of the general ability of the CMA mechanism
Fig. 10. Number of function evaluations required to reachf = 10 plotted against the search space dimensionalityN. Solid lines represent results measured for the(3=3; 10)-ES, dashed ones those for the modified EGS strategy with = 5and = 1.
to generate good mutation distributions for EGS. As a perfor-mance measure, the number of function evaluations required to reach an objective function value of has been used. Tests have been conducted for search space
dimensional-ities and results have been
averaged over a number of test runs that ranges from 20 for to five for . The standard deviation of the measurements (not shown) is negligible except for . It can be seen that on the sphere, the performance advantage of CMA-EGS for amounts to the strategy reaching using roughly 15%–20% fewer function evaluations than the -CMA-ES. The speedup is thus somewhat below the theoretical predictions derived for isotropic mutations and in Section V but nonetheless significant. However, this does not hold true for where the evolution strategy is the more efficient algorithm. Experiments with isotropic mutations and cumulative step length adaptation confirm that the reason for the inferior performance of EGS in low-dimensional search spaces is the step length adaptation component of the algorithm in connection with values of that are large relative to the search space dimensionality. The performance of CMA-EGS in low-dimensional search spaces is much better when is small, and even divergence can result if is chosen too large com-pared with . Unfortunately, the analysis in Section III is not helpful for understanding the source of the imperfect step length adaptation in low-dimensional search spaces. It appears likely that an experimental approach will need to be used to shed light on the bad performance of cumulative step length adaptation when used in conjunction with EGS in low-dimensional search spaces. For the other test functions, the deficiency of cumula-tive step length adaptation when using EGS in low-dimensional search spaces is even more pronounced. For the cigar, the per-formance advantage of CMA-EGS is about the same as for the sphere for , but the strategy requires more function evaluations for than it does for . For the el-lipsoid, it is not until that CMA-EGS is more efficient than the -CMA-ES. Finally, for the discus, while the curves suggest that this may change for larger values of , the
Fig. 11. Objective function valuef(x)of the search point plotted against time
tfor typical runs of CMA-EGS with = 5and = 1on the cigar with
N = 40and uniform noise strengths 2 f0; 10 ; 10 g.
-ES is faster than CMA-EGS even for . For , CMA-EGS on the discus fails to reach altogether. In order to compare the performance of CMA-EGS with that of the -CMA-ES in the presence of noise, it is impor-tant to consider a range of noise strengths. As can be seen from Fig. 11 for the special case of the cigar, in the absence of noise, a run of CMA-EGS on functions other than the sphere con-sists of three distinct phases. Initially, the strategy converges linearly in spite of a badly adapted mutation distribution. At some point, progress begins to stall and the strategy spends a considerable amount of time “learning” a better mutation dis-tribution. In the third phase, the mutation covariance matrix is roughly proportional to the inverse of the Hessian of the ob-jective function and the strategy again progresses as fast as it would on the sphere model.3In the presence of noise of
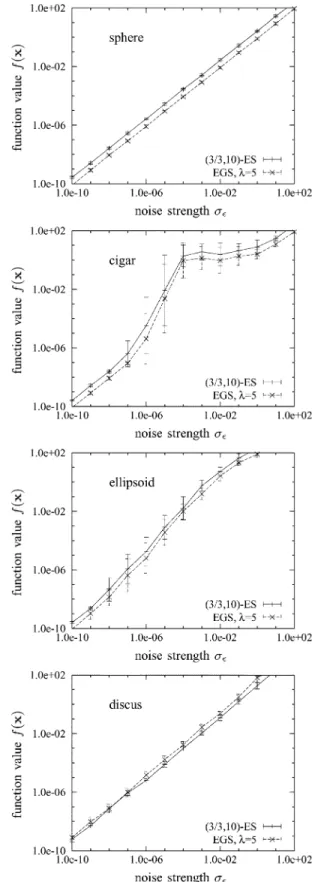
uni-form strength, however, progress comes to a halt, as illustrated in Fig. 11. In that case, objective function values of the search point fluctuate around a limit value that can serve as a perfor-mance measure for the strategies, where lower function values reflect better performance.
Fig. 12 examines the dependence of the performance of -CMA-ES and CMA-EGS on the noise strength. It shows measured limit objective function values of the search point for and both the -CMA-ES and the CMA-EGS strategy with and . The choice of ensures that both strategies have the same computational costs per time step. Choosing is optimal for the evolution strategy if the goal is to minimize the limit function value. The choice of has been made to achieve a rescaling of EGS mutation vectors that is similar in magnitude to the implicit rescaling that the -ES performs. Data points have been generated by averaging measurements from twenty independent runs. Measurements have been conducted for uniform noise strength and have been made after twice as many time steps as
3This can be confirmed by examining the eigenvalue spectrum ofC 1 H, whereHdenotes the Hessian matrix of the objective function. In experiments on convex quadratic functions, it can be observed that the square root of the condition number ofC 1 H(which represents the ratio of the longest to the shortest axis of the corresponding ellipsoid, and thus the degree of asphericity) decreases to values sufficiently close to unity in order to allow for progress as fast as on the sphere model.
Fig. 12. Limit function valuef(x)of the search point of CMA-EGS and
(=; )-CMA-ES plotted against noise strength for the four test functions withN = 40. Both mean values and standard deviations of the measurements are shown.
are required by the -ES to reach in the absence of noise for the respective objective function. For all cases considered, this is sufficient to reach the state in which
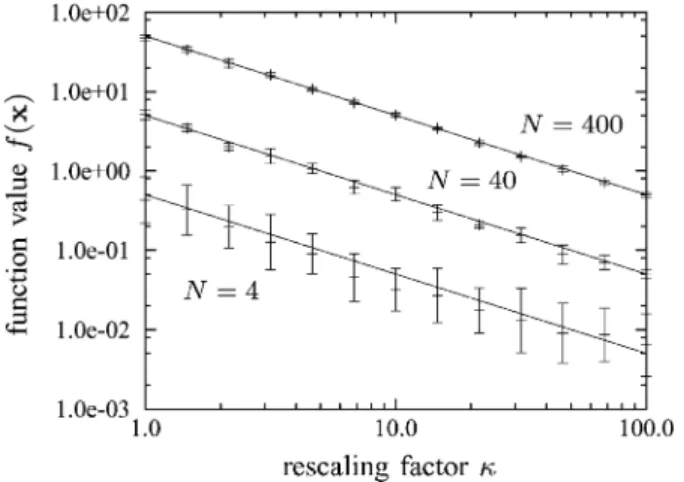
Fig. 13. Limit function valuef(x)of the search point of CMA-EGS with =
2plotted against the rescaling parameterfor the sphere function with =
1:0andN 2 f4; 40; 400g. Both mean values and standard deviations of the measurements are shown. The solid lines represent predictions from (30).
objective function values fluctuate around a stationary limit value.
For the parameter settings considered, from (29) and (30), it can be expected that limit function values on the sphere should be smaller roughly by a factor of 2.7 for EGS than for the -ES. It can be seen from the figure that the observed limit function values indeed closely reflect those predictions. Results for the cigar and the ellipsoid are similar in that limit function values are smaller by a factor between two and three for the EGS strategy across the entire range of noise strengths. However, the standard deviation of the measurements is much larger for noise strengths that affect the strategies in the phase where adaptation of the covariance matrix takes place. The situation is different for the discus where it is the evolution strategy that achieves smaller limit objective function values. This confirms the findings represented in Fig. 10 that had been made in the absence of noise. At the same time, that figure sug-gests that for larger values of , the situation may be reversed. Finally, Fig. 13 shows limit objective function values of the search point of the CMA-EGS strategy with for the sphere function with search space dimensionalities
and with . The choice of results in only four trial points being evaluated per time step and has been made in order to achieve stable performance for small values of . As has been seen above, choosing to generate more trial steps per time step may result in divergent behavior in low-dimensional search spaces. Measurements for have been averaged over 20 independent runs, those for over ten, and those for over five. Both mean values and standard deviations are shown. Also, included in the figure are predictions from (30). It can be seen from the figure that the theoretical predictions for the strategy that employs isotropically distributed mutations match the measurements made for the CMA-EGS strategy well, even for as small as 4, and that cumulative step length adap-tation succeeds in adapting the muadap-tation strength such that the limit function value is reached. The good agreement of the re-sults that have been derived in the limit with experi-ments in low-dimensional search spaces is a result of the limit objective function value being attained with very small muta-tion strengths. As a consequence of the inverse propormuta-tionality
of limit function values to the rescaling factor , the limit func-tion value achieved by CMA-EGS on the sphere funcfunc-tion can be reduced by some factor by multiplying with that factor. That reduction in limit function value comes at no additional compu-tational costs as the choice of does not influence the number of objective function evaluations per time step. Finally, not shown here, the graphs that are obtained for other convex quadratic ob-jective functions are identical to that obtained for the sphere pro-vided that the adaptation of the covariance matrix is complete by the time that noise starts to affect the strategy’s behavior. If noise affects the strategy before the adaptation phase is com-plete, or if the objective function is not convex quadratic, the inverse proportionality of limit function values to the rescaling parameter does not hold and more research is needed in order to study the consequences of rescaling.
VII. SUMMARY ANDCONCLUSION
To conclude, this paper has presented an analysis of the behavior on the infinite-dimensional sphere model of the EGS strategy with the modifications proposed in [13]. The analysis suggests that the modifications are useful in that they both allow for an efficient parallelization of the strategy and for the possibility of improved performance in the presence of noise. In the absence of noise, the use of function values in the weighted summation of mutation vectors that EGS performs ideally leads to a 25% increase in efficiency compared with the -ES. Moreover, on the noisy sphere, the use of the rescaling pa-rameter that has been gleaned from evolution strategies with rescaled mutation vectors helps make the strategy more robust against the effects of noise without increasing computational costs per time step. Choosing large makes it possible to em-ulate the benefits of genetic repair without the need to operate with a large number of trial points generated per time step.
Practically, the value of the predictions needs to be confirmed in finite-dimensional search spaces and on objective functions other than the sphere. For that purpose, the CMA mechanism originally proposed by Hansen and Ostermeier [7] for the -ES has been adapted for use in EGS. Numerical experiments have shown that on several objective functions in the absence of noise, a substantial part of the predicted perfor-mance advantage over the -ES can indeed be observed over a wide range of search space dimensionalities. However, it has also been seen that on other test functions (the discus, and to a lesser extent, the ellipsoid), the evolution strategy exhibits superior performance unless the search space dimensionality is very high. At least part of the reason that EGS does not always realize its potential is that step length adaptation does not al-ways work satisfactorily in low-dimensional search spaces and for large values of . Those deficiencies are more pronounced on some objective functions than they are on others, and more work will be required in order to understand their sources. It has then been seen that the observations made in the absence of noise largely hold in the presence of uniform noise as well, irrespective of the noise strength. Finally, the inverse propor-tionality of limit objective function values to the rescaling parameter that has been predicted on the infinite-dimensional sphere has been observed in finite-dimensional search spaces and on other convex quadratic objective functions, provided
that the adaptation of the covariance matrix is complete by the time that noise starts to affect the strategy’s performance.
Several questions remain to be addressed in future research. First, work needs to be done with the goal of understanding the reasons for the imperfect step length adaptation of EGS in low-dimensional search spaces. It also remains to be seen whether there are further reasons for the inferior performance of EGS when is large and is small. Second, the experi-mental evaluation of CMA-EGS and its comparison with the -CMA-ES should be extended beyond the convex quadratic test functions considered here. Hansen and Kern [28] have experimentally investigated global search properties of the latter strategy. It could be expected that the often better local search properties of EGS come at the cost of inferior global search capabilities, and it remains to be seen if and to what degree the flexibility in the choice of can compensate. Third, Hansenet al. [29] have proposed a modification to the CMA mechanism that enables much faster adaptation if the number of trial solutions generated per time step is large and if candidate solutions can be evaluated in parallel. It remains to be seen whether those modifications have the same beneficial effects in EGS as they have for evolution strategies. Fourth, evolution strategies have been used with different forms of weighted recombination. Those strategies differ from EGS in that they assign weights to mutation vectors based on the rank of the respective candidate solutions in the set of all offspring. Both Hansen and Ostermeier [7] and Rudolph [30] report improved performance compared with unweighted recombination. Recent work [31] has shown that on the infinite-dimensional sphere, the performance of the -ES can be exceeded by a factor of nearly two and a half, surpassing that of EGS by a factor of two. No results for other functions or in finite-dimensional search spaces have been published, and a detailed comparison of the capabilities of weighted multirecombination evolution strategies and EGS remains to be undertaken. Finally, while in the absence of noise, EGS operates best with small values of , the rescaling factor needs to be increased if noise impacts the strategy’s search performance. In [32], a mechanism has been proposed for the adaptation of the rescaling factor in isotropic weighted multirecombination evolution strategies. It is of great interest to see whether that mechanism is useful in connection with CMA-EGS as well.
ACKNOWLEDGMENT
The authors would like to thank the Associate Editor in charge and the anonymous reviewers for constructive criticism and for pointing out several errors in the original manuscript.
REFERENCES
[1] I. Rechenberg, Evolutionsstrategie’94. Stuttgart, Germany: From-mann-Holzboog Verlag, 1994.
[2] H.-P. Schwefel, Evolution and Optimum Seeking. New York: Wiley, 1995.
[3] H.-G. Beyer, The Theory of Evolution Strategies. Heidelberg, Ger-many: Springer-Verlag, 2001.
[4] H.-G. Beyer and H.-P. Schwefel, “Evolution strategies—A comprehen-sive introduction,”Natural Comput., vol. 1, no. 1, pp. 3–52, 2002. [5] J. Nocedal and S. J. Wright, Numerical Optimization. Heidelberg,
Germany: Springer-Verlag, 2000.
[6] R. Salomon, “Evolutionary algorithms and gradient search: Similarities and differences,”IEEE Trans. Evol. Comput., vol. 2, no. 2, pp. 45–55, Jul. 1998.
[7] N. Hansen and A. Ostermeier, “Completely derandomized self-adapta-tion in evoluself-adapta-tion strategies,”Evol. Comput., vol. 9, no. 2, pp. 159–195, 2001.
[8] C. T. Kelley, Iterative Methods for Optimization. Philadelphia, PA: SIAM, 1999.
[9] H.-G. Beyer, “On the “explorative power” of ES/EP-like algorithms,” inEvolutionary Programming VII, A. E. Eiben, Ed. Heidelberg, Ger-many: Springer-Verlag, 1998, pp. 323–334.
[10] D. V. Arnold, “An analysis of evolutionary gradient search,” inProc. IEEE Congr. Evol. Comput., 2004, pp. 47–54.
[11] H.-G. Beyer, “Toward a theory of evolution strategies: On the benefit of sex—The(=; )-theory,”Evol. Comput., vol. 3, no. 1, pp. 81–111, 1995.
[12] D. V. Arnold and H.-G. Beyer, “Local performance of the(=; )-ES in a noisy environment,” inFoundations of Genetic Algorithms 6, W. N. Martin and W. M. Spears, Eds. San Mateo, CA: Morgan Kaufmann, 2001, pp. 127–141.
[13] R. Salomon, “Inverse mutations: Making the evolutionary-gra-dient-search procedure noise robust,” in Proceedings of Artificial Intelligence and Applications—AIA 2005, M. H. Hamza, Ed. Cal-gary, AB, Canada: Acta Press, 2005.
[14] H.-G. Beyer, “Mutate large, but inherit small! On the analysis of rescaled mutations in(~1; ~)-ES with noisy fitness data,” inParallel Problem Solving from Nature—PPSN V, A. E. Eiben, Ed. Heidel-berg, Germany: Springer-Verlag, 1998, pp. 109–118.
[15] ——, “Evolutionary algorithms in noisy environments: Theoretical is-sues and guidelines for practice,”Comput. Methods Mech. Appl. Eng., vol. 186, pp. 239–267, 2000.
[16] D. V. Arnold and H.-G. Beyer, “A comparison of evolution strategies with other direct search methods in the presence of noise,”Comput. Opt. Appl., vol. 24, no. 1, pp. 135–159, 2003.
[17] I. Rechenberg, Evolutionsstrategie—Optimierung technischer Systeme nach Prinzipien der biologischen Evolution. Stuttgart, Germany: Friedrich Frommann Verlag, 1973.
[18] H.-P. Schwefel, Numerische Optimierung von Computer-Modellen mittels der Evolutionsstrategie. Basel, Germany: Birkhäuser Verlag, 1977.
[19] A. Ostermeier, A. Gawelczyk, and N. Hansen, “Step-size adaptation based on non-local use of selection information,” inParallel Problem Solving from Nature—PPSN III, Y. Davidor, Ed. Heidelberg, Ger-many: Springer-Verlag, 1994, pp. 189–198.
[20] D. V. Arnold, Noisy Optimization with Evolution Strategies. Nor-well, MA: Kluwer, 2002.
[21] D. V. Arnold and H.-G. Beyer, “Performance analysis of evolutionary optimization with cumulative step length adaptation,”IEEE Trans. Autom. Control, vol. 49, no. 4, pp. 617–622, Apr. 2004.
[22] L. D. Whitley, M. Lunacek, and J. Knight, “Ruffled by ridges: How evolutionary algorithms can fail,” inProc. Genetic and Evol. Comput. Conf., K. Deb, Ed., 2004, pp. 294–306.
[23] R. Salomon, “Accelerating the evolutionary-gradient-search proce-dure: Individual step sizes,” inParallel Problem Solving from Na-ture—PPSN V, T. Bäck, Ed. Heidelberg, Germany: Springer-Verlag, 1998, pp. 408–417.
[24] J. Poland and A. Zell, “Main vector adaptation: A CMA variant with linear time and space complexity,” inProc. Genetic Evol. Comput. Conf., L. Spector, Ed., 2001, pp. 1050–1055.
[25] A. Auger and N. Hansen, “Reconsidering the progress rate theory for evolution strategies in finite dimensions,” inProc. Genetic Evol. Comput. Conf., M. Keijzer, Ed., 2006, pp. 445–452.
[26] D. V. Arnold and H.-G. Beyer, “Performance analysis of evolution strategies with multi-recombination in high-dimensionalIR -search spaces disturbed by noise,”Theoretical Comput. Sci., vol. 289, no. 1, pp. 629–647, 2002.
[27] G. Rudolph, “On correlated mutations in evolution strategies,” in
Parallel Problem Solving from Nature—PPSN II, R. Männer and B. Manderick, Eds. Amsterdam, The Netherlands: Elsevier, 1992, pp. 105–114.
[28] N. Hansen and S. Kern, “Evaluating the CMA evolution strategy on multimodal test functions,” in Parallel Problem Solving from Nature—PPSN VIII, X. Yao, Ed. Heidelberg, Germany: Springer-Verlag, 2004, pp. 282–291.
[29] N. Hansen, S. D. Müller, and P. Koumoutsakos, “Reducing the time complexity of the derandomized evolution strategy with covariance matrix adaptation (CMA-ES),”Evol. Comput., vol. 11, no. 1, pp. 1–18, 2003.