E c o n o m i c &
WORLD POPULATION TO 2300
United Nations
S o c i a l
A f f a i r
s
ST/ESA/SER.A/236
Department of Economic and Social Affairs Population Division
WORLD POPULATION TO 2300
United Nations New York, 2004
NOTE
The designations employed and the presentation of the material in this publication do not imply the ex-pression of any opinion on the part of the Secretariat of the United Nations concerning the legal status of any country, territory, city or area or of its authorities, or concerning the delimitation of its frontiers or boundaries.
The designations of “more developed regions” and “less developed regions” are intended for statistical convenience and do not necessarily express a judgment about the stage reached by a particular country or area in the development process.
The term “country” as used in the text of this publication also refers, as appropriate, to territories or areas.
The present report has been reproduced without formal editing.
ST/ESA/SER.A/236
UNITED NATIONS PUBLICATION Sales No. ____________ ISBN_______________
Copyright © United Nations 2004 All rights reserved Printed in United Nations, New York
The Department of Economic and Social Affairs of the United Nations Secretariat is a vi-tal interface between global policies in the economic, social and environmenvi-tal spheres and na-tional action. The Department works in three main interlinked areas: (i) it compiles, generates and analyses a wide range of economic, social and environmental data and information on which States Members of the United Nations draw to review common problems and take stock of policy options; (ii) it facilitates the negotiations of Member States in many intergovernmental bodies on joint courses of action to address ongoing or emerging global challenges; and (iii) it advises interested Governments on the ways and means of translating policy frameworks developed in United Nations conferences and summits into programmes at the country level and, through technical assistance, helps build national capacities.
PREFACE
Every two years the United Nations Department of Economic and Social Affairs’ Population Di-vision prepares the official United Nations estimates and projections of world, regional and national popu-lation size and growth, and demographic indicators. The results from the most recent set of estimates and projections were published in World Population Prospects: The 2002 Revision, a three-volume set issued over the period 2003-2004. The estimates and projections in the 2002 Revision cover the period 1950-2050.
The United Nations also prepares supplementary world population projections covering a much longer period, referred to as long-range projections. The United Nations previously published long-range projections on six occasions, each being consistent with the population projections of the following revi-sions of the World Population Prospects: 1968, 1978, 1980, 1990, 1996 and 1998. These publications pre-sented long-range projections for the world and its major areas, and since the 1990 set of projections, the long-range time horizon was until 2150.
The Population Division has adopted two major innovations for this new set of long-range popula-tion projecpopula-tions based on the 2002 Revision. For the first time, the long-range projecpopula-tions are made at the national level, that is, for each of the 228 units constituting the world. In addition, the time horizon for the projections is extended to 2300, so as to allow for the eventual stabilization of the population in at least one scenario. In order to address the technical and substantive challenges posed by the preparation of long-range projections at the national level, the Population Division convened two meetings of the Tech-nical Working Group on Long-Range Population Projections at United Nations Headquarters in New York. The purpose of the meetings was to discuss the assumptions, methodology and preliminary results of the national population projections to 2300.
This volume presents the results of the long-range projections, World Population to 2300, and in-cludes a detailed analysis. A series of essays on the issue of long-range projections have also been incor-porated in this report, enriching the debate on this important topic. Experts from outside the United Na-tions, many of whom took part in the technical working group meetings, authored these essays.
The United Nations Population Division is grateful to the National Institute on Aging of the United States of America (NIA) whose grant help support this study. Acknowledgement is also due to Rodolfo A. Bulatao, who assisted the Population Division in the preparation of this report. The Population Division extends its appreciation to all the experts for their suggestions and contributions to the prepara-tion of the long-range projecprepara-tions.
This publication, as well as other population information, may also be accessed on the Population Division world wide web site at www.unpopulation.org. For further information about the long-range projections, please contact the office of Mr. Joseph Chamie, Director, Population Division, United Na-tions, New York, NY 10017, USA, tel: 212-963-3179 and fax: 212-963-2147.
CONTENTS
Page
PREFACE... iii
EXPLANATORY NOTES... x
PART ONE. REPORT
EXECUTIVE SUMMARY... 1INTRODUCTION... 3
Chapter I. PROJECTIONS TO 2050... 4
A. World population... 4
B. Major areas.. ... 4
C. Assumptions ... 7
D. Long-range possibilities ... 9
II. PROJECTIONS AFTER 2050: LONG-RANGE GROWTH AND DECLINE... 10
A. Scenarios ... 10
B. World population... 12
C. More developed and less developed regions ... 17
D. Major areas... 22
E. Africa... 28
F. Asia ... 31
G. Latin America and the Caribbean... 33
H. Oceania... 34
I. Northern America... 36
J. Europe ... 37
III. COUNTRY RANKINGS... 41
A. Size ... 41
B. Growth... 41
C. Fertility ... 50
D. Mortality... 56
IV. POPULATION DENSITY... 62
V. AGEING POPULATIONS... 66
A. Major areas... 66
B. Historical periods ... 70
C. Dependency thresholds... 73
D. Countries ... 76
VI. CONCLUSION... 82
A. Consequences ... 82
B. Limitations ... 82
C. The long view... 83
No. Page
PART TWO. ESSAYS
I. TOWARDS AN UNDERSTANDING OF THE EMOTIONS IN THE POPULAITON OF 2300
Alaka Basu... 89 II. AN INTERGENERATIONAL RATIONALE FOR FERTILITY ASSUMPTIONS IN LONG-RANGE WORLD POPULATION
PROJECTIONS
Herwig Birg... 99 III. THE IMPLICATIONS OF THE UNITED NATIONS LONG-RANGE POPULATION PROJECTIONS
John Caldwell... 112 IV. COMPARING LONG-RANGE GLOBAL POPULATION PROJECTIONS WITH HISTORICAL EXPERIENCE
Joel Cohen... 123 V. WORLD POPULATION IN 2300: A CENTURY TOO FAR?
David Coleman... 127 VI. POPULATION FUTURES FOR THE NEXT THREE HUNDRED YEARS: SOFT LANDING OR SURPRISES TO COME?
Paul Demeny ... 137 VII. WHY THE WORLD’S POPULATION WILL PROBABLY BE LESS THAN 9 BILLION IN 2300
Timothy Dyson... 145 VIII. REFLECTIONS ON THE NEXT FEW CENTURIES
François Héran ... 151 IX. THE FUTURE OF HUMAN LIFE EXPECTANCY
S. Jay Olshansky... 159 X. PROJECTING THE UNKNOWABLE: A PROFESSIONAL EFFORT SURE TO BE MISINTERPRETED
Michael Teitelbaum... 165 XI. THE IMPLICATIONS OF THE UNITED NATIONS LONG-RANGE POPULATION PROJECTIONS:CONTINUING
RAPID POPULATION GROWTH
Charles F. Westoff ... 169 XII. FORETELLING THE FUTURE
John R. Wilmoth ... 174
TABLES
No. Page
1. Population and average annual rate of change of the world and development groups, estimates and three
scenarios: 1950-2300... 14 2. Population, average annual rate of change, and distribution of world population, by major area, estimates
and medium scenario: 1950-2300... 22 3. Population by major area and region, estimates and medium scenario: 1950-2300 ... 27 4. Average annual rate of change for 50 year-year periods, by major area and region, estimates and medium
No. Page
5. Twenty largest countries and their populations, selected years ... 42
6. Countries with the highest and lowest average annual rate of change over 50-year periods... 43
7. Countries with the largest increases and decreases over 50-year periods... 45
8. Population in 2000 and 2100, minimum and maximum size up to 2300, and percentage change to these points from 2000, by country ... 46
9. Highest and lowest average annual rate of population change in any five-year period, by country: 2000-2300... 51
10. Countries with the highest and lowest total fertility, estimates and medium scenario, selected periods ... 56
11. Countries with the lowest and highest life expectancy at birth, selected periods ... 58
12. Countries with the smallest and largest gap between female and male life expectancies, selected periods .. 61
13. Density in persons per square kilometer of land, by major area and region: 1950-2300... 64
14. Population in broad age groups and percentage change over long periods, major areas ... 68
15. Percentage in different age groups, by major area: 1950-2300 ... 70
16. Start and end of the demographic window phase and corresponding dependency ratio, by major area and region, estimates and medium scenario ... 74
17. Dependency threshold ages and post-retirement duration, by major area and region, selected years ... 75
18. Countries with the lowest and highest median ages, selected years ... 77
19. Starting date for entering the demographic window phase by country, classified by major area... 79
FIGURES 1. Estimated world population, 1950-2000, and projections: 2000-2050 ... 5
2. Average annual rate of population change, major areas: 1950-2050... 6
3. Total fertility, major areas: 1950-2050 ... 6
4. World total fertility and life expectancy at birth: 1995-2050 ... 8
5. Maximum and minimum country values in each period for net reproduction rate and average annual rate of population change: 2050-2300 ... 12
6. Estimated world population: 1950-2000, and projections: 2000-2300... 13
7. Change in world population over 50-year periods, estimates and three scenarios: 1950-2300 ... 13
8. Average annual rate of change of the world population and total fertility, estimates and three scenarios: 1950-2300... 15
9. Comparison of world population and net reproduction rate with previous long-range projections, estimates and medium scenario: 1950-2150... 16
10. Crude birth and death rate and rate of natural increase for the world, estimates and medium scenario: 1950-2300... 17
11. Significant world demographic events between 2000 and 2300... 18
12. Total population, more developed and less developed regions, estimates and medium scenario: 1950-2300... 19
13. Average annual rate of population change, more developed and less developed regions, estimates and three scenarios: 1950-2300... 19
14. Total fertility, more developed and less developed regions, estimates and three scenarios: 1950-2300 ... 20
15. Crude birth and death rate, more developed and less developed regions, estimates and three scenarios: 1950-2300... 20
16. Male and female life expectancy at birth, more developed and less developed regions: 1950-2300 ... 21
17. Population in major areas, estimates and medium scenario: 1950-2300 ... 23
18. Average annual rate of population change, major areas, estimates and medium scenario: 1950-2300 ... 23
19. Total fertility, major areas, estimates and medium scenario: 1950-2175 ... 24
20. Periods when net reproduction rate is below 1, major areas, estimates and medium scenario: 1950-2200... 25
21. Crude death rate and points of intersection with crude birth rate, major areas, estimates and medium scenario: 1950-2300 ... 26
22. Difference between life expectancy at birth in each major area and in Latin America and the Caribbean: 1950-2300... 26
No. Page
23. Total population, African regions: 1950-2300 ... 29
24. Average annual rate of population change, African regions: 1950-2300 ... 30
25. Total fertility, African regions: 1950-2175... 30
26. Life expectancy at birth, African regions: 1950-2300 ... 31
27. Total population, Asian regions: 1950-2300 ... 32
28. Average annual rate of population change, Asian regions: 1950-2300 ... 32
29. Total fertility, Asian regions: 1950-2175 ... 33
30. Life expectancy at birth, Asian regions: 1950-2300... 34
31. Total population, Latin American and Caribbean regions: 1950-2300... 35
32. Life expectancy at birth, Latin America and the Caribbean: 1950-2300 ... 35
33. Average annual rate of population change, with and without migration, Northern America: 1950-2175... 36
34. Life expectancy at birth, United Sates of America compared to Japan and Western Europe: 1950-2300... 37
35. Total population, European regions: 1950-2300 ... 38
36. Average annual rate of population change, European regions: 1950-2300 ... 38
37. Total fertility, European regions: 1950-2175 ... 39
38. Life expectancy at birth, European regions: 1950-2300 ... 40
39. Population trends in selected high-growth and low-growth countries: 1950-2300 ... 44
40. Percentage distribution of countries by total fertility level: 1950-2150 ... 55
41. Total fertility in Niger and Latvia, estimates and three scenarios: 1950-2300 ... 57
42. Life expectancy at birth by sex in Botswana, Japan, Sierra Leone and Suriname: 1950-2300 ... 59
43. Gap between female and male life expectancies at birth, selected major areas and regions: 1950-2300 ... 60
44. Density, major areas: 1950-2300... 63
45. Density in relation to land area by region and for selected countries: 2100 ... 63
46. Density in relation to land area, 192 countries: 2100 ... 65
47. Median age, major areas: 1950-2300... 66
48. Distribution of population by age, more developed and less developed regions: 1950-2300... 68
49. Distribution of the population in three broad age groups, major areas: 1950-2100... 69
50. Dependency ratio during the demographic window phase, major areas... 72
51. Dependency ratio during the demographic window phase, regions of Oceania and Northern American countries ... 72
52. Dependency thresholds, life expectancy at birth, and expected working life, more developed and less developed regions: 1950-2050... 76
53. Percentage of population at older ages, Japan and Liberia: 1950-2300... 79
54. World population, estimates and three scenarios: 1700-2300 ... 84
55. Average annual rate of change of the world population, estimates and three scenarios: 1700-2300... 84
ANNEX TABLES A1. Population of the world by development group and scenario: 1950-2300 ... 179
A2. Average annual rate of change of the population of the world by development group and scenario: 1950-2300... 181
A3. Total fertility of the world by development group and scenario: 1950-2300 ... 183
A4. Life expectancy at birth of the world by development group and sex: 1950-2300... 185
A5. Total population by major area, estimates and medium scenario: 1950-2300... 187
A6. Average annual rate of population change by major area, estimates and medium scenario: 1950-2300... 189
A7. Total fertility by major area, estimates and medium scenario: 1950-2300... 191
A8. Life expectancy at birth by major area and sex: 1950-2300 ... 193
A9. Total fertility of the world by development group, major area and region, estimates and medium scenario: selected periods ... 195
A10. Life expectancy at birth of the world by development group, major area, region and sex: selected periods ... 196
No. Page
A12. Average annual rate of population change by country, estimates and medium scenario: 1950-2300 ... 203
A13. Total fertility by country, estimates and medium scenario: selected periods ... 208
A14. Male life expectancy at birth by country: selected periods... 213
A15. Female life expectancy at birth by country: selected periods ... 218
A16. Population density by country, estimates and medium scenario: selected years ... 223
A17. Median age by country, estimates and medium scenario: 1950-2300 ... 228
A18. Proportion of broad age groups of the world by development group, major area and region, estimates and medium scenario: 1950-2300 ... 233
A19. Start and end of the demographic window phase and corresponding dependency ratio, by country, estimates and medium scenario ... 236
Explanatory notes
Tables presented in this volume make use of the following symbols:
Two dots (..) indicate that data are not available or are not separately reported. An em dash (—) indicates that the amount is nil or negligible.
A hyphen (-) indicates that the item is not applicable. A minus sign (-) before a figure indicates a decrease. A full stop (.) is used to indicate decimals.
Years given start on 1 July.
Use of a hyphen (-) between years, for example, 1995-2000, signifies the full period in-volved, from 1 July of the first year to 1 July of the second year.
Numbers and percentages in tables do not necessarily add to totals because of rounding.
Countries and areas are grouped geographically into six major areas: Africa; Asia; Europe; Latin America and the Caribbean; Northern America; and Oceania. These major areas are further di-vided into 21 geographical regions. In addition, for statistical convenience, the regions are classified as belonging to either of two categories: more developed or less developed. The less developed regions in-clude all the regions of Africa, Asia (excluding Japan), and Latin America and the Caribbean, as well as Melanesia, Micronesia and Polynesia. The more developed regions comprise Australia/New Zealand, Europe, Northern America and Japan.
EXECUTIVE SUMMARY
Long-range population projections are reported to 2300, covering twice as long a period as ever covered in previous United Nations projections. These projections are not done by major area and for selected large countries (China and India), as was the previous practice, but for all countries of the world, providing greater detail.
In these projections, world population peaks at 9.22 billion in 2075. Population therefore grows slightly beyond the level of 8.92 billion projected for 2050 in the 2002 Revision, on which these pro-jections are based. However, after reaching its maximum, world population declines slightly and then resumes increasing, slowly, to reach a level of 8.97 billion by 2300, not much different from the projected 2050 figure.
This pattern of rise, decline, and rise again re-sults from assumptions about future trends in vital rates: that, country by country, fertility will fall below replacement level—though in some cases not for decades—and eventually return to re-placement; and that, country by country, life ex-pectancy will eventually follow a path of uninter-rupted but slowing increase. With alternative as-sumptions about fertility, long-range trends could be quite different. With long-range total fertility 0.3 children above replacement, projected world population in 2300 is four times as large as the main projection; with total fertility 0.2 children below replacement, world population in 2300 is one-quarter of the main projection.
Regions and countries will follow similar demographic paths in the long run, given similar assumptions for different countries about long-range vital rate trends. However, because initial assumptions differ, and because this gives rise to slight variations in trends, countries and regions will not be exactly alike, even by 2300. In fact, what are today considered more developed and less developed regions will still be demographi-cally distinguishable, with regard, for instance, to life expectancies and proportions at advanced ages. In addition, regions and countries will go through critical stages of growth—zero growth,
subreplacement fertility, a return to positive growth—at different points in the future, giving rise to a global demographic map with areas that shrink and stretch at different times in the next three centuries.
Europe and Africa will be particularly out of phase. Europe will hit its low point in growth in 2050, Africa not till 80 years later, after all other major areas. From 2000 to 2100, Europe’s share of world population is cut in half, 12.0 to 5.9 per cent, while Africa's almost doubles, from 13.1 to 24.9 per cent. While shares of world population for major areas will rise and fall over the follow-ing two centuries, the distribution by 2300 will resemble that in 2100.
Smaller regions within continents exhibit diver-gent patterns. For instance:
• Three African regions—Eastern Africa,
Middle Africa, and Western Africa—will grow unusually fast in comparison to every other region through 2100, even though total fertility will be close to replacement by 2050.
• Southern Africa is seeing a decline in life expectancy to a lower level than anywhere else, but life expectancy will rebound, rise quite rap-idly, and overtake other African regions.
• Asian regions will grow fastest to the west, slowest to the east, but in every case with growth rates, at least up to 2100, below Eastern, Middle and Western Africa. By 2100, Asia, instead of being four-and-a half times as populous as Africa, will be only 2.2 times as populous.
• Latin America and the Caribbean is the most homogenous major area, with most of its regions following relatively parallel fertility and life expectancy paths.
• Northern America is unusual as the only re-gion that will not experience negative growth, mainly due to projected migration up to 2050. (No migration is incorporated in projections beyond that date.)
• Europe, like Asia, will experience higher growth to the west, lower growth to the east.
East-ern Europe stands out with low life expectancy, and even in the long run does not catch up with other regions.
Growth patterns depend on assumptions about vital rates. Total fertility is assumed to decline, at a varying pace dictated by country circum-stances, to a below-replacement level of 1.85 children per woman. Countries already at this level or below, and other countries when they reach it, eventually return to replacement over a period of a century and stay at replacement in-definitely. All countries are projected to have reached replacement fertility by 2175, but past fertility trends continue to affect population trends for another 50 years.
Life expectancy is assumed to rise continuously, with no upper limit, though at a slowing pace dic-tated by recent country trends. By 2100, life ex-pectancy is expected to vary across countries from 66 to 97 years, and by 2300 from 87 to 106 years. Rising life expectancy will produce small but continuing population growth by the end of the projections ranging from 0.03 to 0.07 per cent annually.
Growth patterns affect the balance between population and land. Density, in people per square kilometer of land, will continue to be espe-cially variable in Oceania, where by 2100 it will range from 504 persons per sq. km. in Micronesia to 3.6 persons per sq. km. in Australia/New Zea-land. Some large countries in South-central Asia will also be unusually dense by 2100, with India having 491 persons per sq. km., Pakistan 530
per-sons per sq. km., and Bangladesh 1,997 perper-sons per sq. km.
These populations pressing on the land will be old by current standards. Where the world median age in 2000 is 26 years, by 2100 it will be 44 years, and by 2300, 48 years. Before they reach the point where those over 40 are half the popula-tion, countries go through a period labelled here the demographic window, when the proportion of children and youth under 15 years falls below 30 per cent and the proportion of people 65 years and older is still below 15 per cent. For a 30-40 year period, the proportion of the population in be-tween, of working age, is particularly prominent in the population. Europe entered the demo-graphic window before 1950 and is now leaving it and entering a third age when older people are particularly prominent in the age distribution. Much of Africa will not enter the demographic window until 2045 or later.
Beyond the demographic window, population ageing becomes a predominant demographic fea-ture. Between 2100 and 2300, the proportion of world population 65 years and older will increase by one-third (from 24 to 32 per cent); the propor-tion 80 years and older will double (from 8.5 to 17 per cent); and the proportion 100 years and older will increase nine times (from 0.2 to 1.8 per cent). Assuming that the retirement age world-wide in 2000 is 65 years, people retire on average only two weeks short of their life expectancy. As-suming that retirement age stays unchanged, by 2300 people will retire 31 years short of their life expectancy.
INTRODUCTION
Projections recently issued by the United Na-tions suggest that world population by 2050 could reach 8.9 billion, but in alternative scenarios could be as high as 10.6 billion or as low as 7.4 billion. What will population trends be like beyond 2050? No one really knows. Any demographic projec-tions, if they go 100, 200, or 300 years into the future, are little more than guesses. Societies change considerably over hundreds of years—as one can readily see if one looks back at where the world was in 1900, or 1800, or 1700. Demo-graphic behaviour over such long time spans, like behaviour in many spheres of life, is largely un-predictable.
Nevertheless, this report presents projections of world population, and even of the populations of individual countries, over the next 300 years. Given the inherent impossibility of such an exer-cise, these projections have a special character. They are not forecasts. They do not say that popu-lation is expected to reach the projected levels. Rather, they are extrapolations of current trends. They give what paths population would follow if, and only if, historical trends and trends previously forecast up to 2050 continue. Of course one can-not expect these trends to continue as is, and cer-tainly not country by country. But the implications of current trends are important and often can only be seen by looking far enough into the future.
These projections are presented, therefore, as a means of drawing out the long-range implications of shorter-run trends that are known or somewhat predictable. Constructing long-range projections such as these is a little like predicting the outcome of a basketball game after the first five minutes. No one can do that reliably. Why should it even be attempted? Probably for the same reason that a coach might call a timeout after five minutes: be-cause the trends may look unfavourable and team play may require adjustment if the game is to be on. Similarly, to see if current population trends
require adjustment, their implications are worked out over a long period. This should not be taken to imply that these trends are actually expected to continue. To some extent, the reverse is true. The projected long-range path for population is re-ported partly to facilitate thinking about how to prepare for it, but also to encourage action to modify this path, to make it more favourable, if that is possible, for collective welfare.
These long-range projections are based on and extend the recent United Nations projections, des-ignated the 2002 Revision (United Nations, 2003b, 2003c, 2004). Long-range projections have been reported before, the most recent having been based on the 1998 Revision (United Nations, 2000a). Unlike earlier long-range projections, these projections go further, not just to 2150 but to 2300. These projections also are constructed not by major area but by country, providing a more detailed picture of long-range prospects.
This report
• reviews briefly some findings from the 2002
Revision and the procedures used
• discusses the methodology used to extend population trends up to 2300
• describes the projected population growth or decline, beginning with the world as a whole and proceeding to major areas, regions, and coun-tries that stand out
• discusses consequences of growth patterns, focusing on population density and changing age structures
• concludes with a brief reference to conse-quences of population change and the limitations of this work
• presents a series of essays produced by a group of experts.
An annex contains detailed tables, giving age structures and vital rates over time.
I. PROJECTIONS TO 2050
Projections to 2050, together with historical population estimates back to 1950, constitute the
2002 Revision of the official United Nations
population projections, the eighteenth and latest such revision. Reviewing these projections pro-vides hints about what to expect in long-range projections and poses questions for them. Some results from the 50-year projections in the 2002
Revision are illustrated; more results and analyses
are available in other publications (United Na-tions, 2003b, 2003c, 2004).
A.WORLD POPULATION
World population is projected to grow from 6.1 billion in 2000 to 8.9 billion in 2050, increasing therefore by 47 per cent. The average annual population growth rate over this half-century will be 0.77 per cent, substantially lower than the 1.76 per cent average growth rate from 1950 to 2000. In addition, growth is projected to slow the further the projections go. For 2000-2005, the annual growth rate is estimated at 1.22 per cent; by 2045-2050, it will be only 0.33 per cent.
Although growth rates will fall, the annual in-crease in world population will remain large: 57 million a year on average between 2000 and 2050. This is smaller than the 71 million people added annually between 1950 and 2000 but still substan-tial. It means that, on average each year for 50 years, world population will expand by about as many people as now live in Italy. The increase, over 50 years, will be more than twice the current population of China, or more than twice the cur-rent population of all more developed regions combined. Although population growth will even-tually subside, and a variety of countries will see little or no population growth, for the world as a whole the next 50 years can hardly be character-ized as demographically tranquil.
How good are these figures? The estimate for the 2000 population, based on a greater number of well-executed national censuses than ever before, may well be more accurate than most estimates of current world population that have been made in
the past. Projected figures for the near term (say up to around 2010) benefit from the accuracy of base data and are unlikely to be off by much. Pro-jected figures for 2050, in contrast, are much less certain. To hedge its bets, the 2002 Revision in-cludes alternative projection scenarios, particu-larly high-growth and low-growth scenarios, ac-cording to which world population would reach 10.6 billion or 7.4 billion by 2050 (figure 1). Be-tween the high and low scenarios, average annual growth rates for 2000-2050 range from 1.12 to 0.40 per cent, and annual increments range from 91.3 to 26.8 million.
B.MAJOR AREAS
Much of the demographic change up to 2050 will take place in the less developed regions. Col-lectively, these regions will grow 58 per cent over 50 years, as opposed to 2 per cent for more devel-oped regions. Less develdevel-oped regions will account for 99 per cent of the expected increment to world population in this period. Nevertheless, population growth in the less developed regions is expected to slow down in the future. The current annual growth rate of 1.6 per cent (for 1995-2000) will be halved in a little over 25 years and will be roughly halved again by mid-century. This will be due to falling fertility. Current total fertility of 3.11 chil-dren per woman (about double the rate in more developed regions) will fall to 2.04 by mid-century—just below replacement level but still above the current rate in more developed regions.
Among the less developed regions, demo-graphic prospects vary. Africa, Asia, and Latin America and the Caribbean are considered less developed; Oceania, which has a relatively small population, is mixed, while Northern America and Europe are considered more developed.2 Popula-tion growth in Asia looks impressively large, at 1.5 billion over 50 years. However, Asia’s share of world population actually dips slightly, from 61 per cent in 2000 to 59 per cent in 2050. Growth will be much faster in Africa, which will add 1.0 billion and rise from 13 to 20 per cent of world population.
Figure 1. Estimated world population, 1950-2000, and projections: 2000-2050
Average annual rates of population change show that Africa has experienced considerably faster growth than any other major area, for most of the 1950-2000 period (figure 2). Growth rates reached a higher peak in Africa (2.86 per cent) than anywhere else—in the early 1980s, at least 15 years after growth had begun to decline in every other major area. The projection for Africa, consequently, shows growth declining belatedly, though nevertheless following a downward path similar to that in other major areas. Europe is at the other end of the spectrum, with growth rates having just turned negative and continuing to fall up to 2050.
Though growth rates are at different levels, their decline is projected to be similar across ma-jor areas. The more developed regions show slightly slower decline in growth rates than the less developed regions, mainly because of interna-tional migration. If net migration were set to zero, the lines would be more nearly parallel. Interna-tional migration is particularly important for Northern America (i.e., the United States and Canada), accounting for 0.5 percentage points of the growth rate for 2000-2050. For Europe,
migration boosts the growth rate by 0.1-0.2 points, and for Oceania by around 0.25 points. (For Aus-tralia alone, migration adds about twice that to the growth rate.)
Growth rate declines are parallel (international migration aside) largely because assumptions about fertility change are similar. Figure 3 shows the substantial gap that currently exists—but is projected to narrow—between total fertility in Africa and total fertility in every other major area. A gap in fertility levels also exists between the other major areas of the world, but by 2050 levels are expected to converge in a narrow band be-tween 1.84 and 1.92 children per woman. Europe will take the longest to enter this band, and will do so through rising fertility, in contrast to falling fertility in other major areas.
Mortality exerts some additional influence on the growth rate. Across major areas, its effect on growth largely counteracts that of fertility, since where fertility is higher, mortality also tends to be higher. Over time, life expectancy is expected to rise fairly smoothly.
10.6
8.9
6.1
2.5
7.4
2 3 4 5 6 7 8 9 10 11
1950 1960 1970 1980 1990 2000 2010 2020 2030 2040 2050
P
o
pu
lati
on
(b
ill
io
n
s
)
High Medium Low
Figure 2. Average annual rate of population change, major areas: 1950-2050
Figure 3. Total fertility, major areas: 1950-2050
-0.5 0.0 0.5 1.0 1.5 2.0 2.5 3.0
1950 1960 1970 1980 1990 2000 2010 2020 2030 2040 2050
A
nnual
pop
ul
at
io
n
gr
ow
th
(per
c
ent
)
Africa Asia
Latin America and the Caribbean Oceania
Northern America Europe
1 2 3 4 5 6 7
To
ta
l f
e
rt
ility
Africa Asia
Latin America and the Caribbean Oceania
Northern America Europe
Africa again stands out, not only because of the much lower level of life expectancy but also be-cause it is the only major area where projections show any decline in life expectancy for any pe-riod. The decline, in the first decade of the projec-tions, involves countries severely affected by HIV/AIDS—37 of 54 in this major area. Though the projected decline looks small—only about a year for the entire major area—it leaves projected life expectancy in Africa even further behind other major areas, all projected to make steady progress. The Africa decline also appears to fol-low a preceding decline of over a year in life ex-pectancy (beginning about the mid-1980s). How-ever, it is important to note that these previous declines were not directly measured. Data on mor-tality and life expectancy are notoriously incom-plete for developing countries, and particularly for sub-Saharan Africa. Mortality parameters may therefore be estimated with the same models used for projection, which is a particular problem for AIDS mortality. More is said about this uncer-tainty later.
By 2045-2050, life expectancy in Africa is pro-jected to be 11 years shorter than in the next low-est case. The other major areas will be bunched, though not too tightly, between 76 and 82 years of life expectancy, with Asia and Latin America and the Caribbean behind the more developed re-gions.
C.ASSUMPTIONS
The 2002 Revision obtains the various scenarios through country by country projections con-structed for successive five-year periods,1 in which estimates of future fertility are manipu-lated. Within the 2002 Revision, fertility at the world level was projected to decline from 2.8 children per woman in 1995-2000 to about 2 chil-dren in 20045-2050 (figure 4). Over the long run, total fertility is projected to settle at 1.85 children per woman in each country—in between the cur-rent rate for Northern America (which is just be-low replacement level) and the rate for Europe (which is currently well below). This figure is somewhat arbitrary; a higher figure would be nec-essary if population were to stabilize, but demog-raphers do not agree about whether stabilization is
inevitable. A lower figure is also possible, given that total fertility for 1995-2000 is between 1.1 and 1.2 in such countries or areas as Spain, the Czech Republic, and Hong Kong SAR.
Because of uncertainty about this long-range level, the high scenario has total fertility levels gradually diverging, eventually reaching a level 0.5 points higher than that in the medium scenario (2.35 vs. 1.85). The low scenario has total fertility settling at 0.5 points below that in the medium scenario, for an eventual level of 1.35, well below replacement. The spread of 0.5 children above or below the medium variant was reached by 2050 at the latest, but not the ultimate levels.
Fertility in developed countries, which is al-ready relatively close to the long-range levels, is assumed to reach them (whether medium, high, or low) by the period 2045-2050, proceeding along a smooth path that takes recent trends into account. This allows for some cases where fertility initially moves away from these levels (e.g., dropping even further below them) for five or ten years. Fertility in developing countries also moves to-ward these levels, but since in some cases it is still well above them, it does not necessarily reach them by 2050. In developing countries with high fertility, the pace of total fertility decline is deter-mined by models that relate decline in one period to the level previously reached. These models as-sume relatively slow decline from the highest fer-tility levels, faster decline (of as much as 0.12 points a year) once total fertility has fallen to 4-5, and slowing decline below that. (Details on the models are contained in United Nations, 2004.)
Mortality is projected by assuming that life ex-pectancy rises according to one of three schedules, reflecting fast, medium, or slow improvements in existing mortality data for the specific country (United Nations, 2004). Each schedule provides for slower gains at higher levels. In the medium schedule, for instance, the annual gain in life ex-pectancy is 0.4 years for males and 0.5 years for females from an initial combined life expectancy level of 60 years (typical of less developed re-gions). But the gain shrinks to 0.1 years for males and 0.2 years for females from an initial life ex-pectancy level of 75 years (typical of more
devel-Figure 4. World total fertility and life expectancy at birth: 1995-2050
oped regions). Depending on their mortality ex-perience, countries may stay on the chosen sched-ule of life expectancy improvement until 2050 or move to the medium schedule by 2025. (The latter was the typical practice in the 2002 Revision.)
However, the impact of the HIV/AIDS epidemic is explicitly accounted for in 53 “highly” affected countries, that is, countries with an HIV/AIDS prevalence level of at least 1.9 per cent or with an important number of HIV/AIDS cases due to their large population. In these cases, non-AIDS mor-tality is projected to decline using similar models as for other countries—but in most cases with slower improvements. AIDS mortality is then added to these no-AIDS country scenarios. AIDS mortality is derived using a model developed by the UNAIDS Reference Group on Estimates, Modeling, and Projections (see United Nations, 2003a), which is fitted to historical estimates of HIV prevalence (also from UNAIDS) to estimate country-specific parameters for the epidemic. These parameters are used in projection, allowing HIV prevalence and subsequent AIDS deaths to follow an initial upward path and eventually reach a peak. The further assumption is added that HIV
transmission gradually declines beginning in 2010. The result is a slower rise in life expectancy in these countries in comparison to others, or an actual decline. Overall, at the world level, life ex-pectancy at birth within the 2002 Revision was projected to increase from 64.6 years in 1995-2000 to 74.3 years in 2045-2050 (figure 4).
Assumptions are also made about international migration, based on past migration estimates and on public policy toward migrants. Migration as-sumptions are specified country by country—not following any standard model—and often assume little change in migration except where current patterns reflect unusual events unlikely to be re-peated, such as the return of refugees to a specific country. Thus the United States, which receives the largest number of immigrants, is estimated as having 6.3 million net migrants in 1995-2000 and is projected to have only slightly fewer—5.5 mil-lion—in 2045-2050. China and Mexico lose the largest net number of net migrants in 1995-2000 and also in 2045-2050. Migration figures are ad-justed where necessary to ensure a balance be-tween immigrants and emigrants across countries. Migration assumptions have minimal effect on
2.0 2.1 2.2 2.3 2.4 2.5 2.6 2.7 2.8 2.9
1995 2005 2015 2025 2035 2045
T
o
ta
l f
e
rt
ilit
y
(T
F
R
)
64 66 68 70 72 74 76
Li
fe
ex
pec
tanc
y
at
bir
th (
E
0)
TFR 2002 Revision E0 2002 Revision
world projections but do affect country and re-gional results. Sudden large migrations have in fact, in the past, been a major source of error in projections (National Research Council, 2000).
Besides the medium, high, and low scenarios, a few other scenarios are provided in the 2002
Revi-sion, not as likely possibilities for the future but to
facilitate analysis of the effects of various as-sumptions. Separate scenarios are provided with (a) country total fertility held constant at 1995-2000 levels, (b) fertility set for the entire projec-tion period at exactly replacement level, (c) life expectancy by sex held constant at 1995-2000 levels, (d) AIDS eliminated from country projec-tions for severely affected countries, or (e) all in-ternational migration eliminated.
D.LONG-RANGE POSSIBILITIES
These results for 50-year projections are only a small part of the results recently reported by the United Nations (2003b, 2003c, 2004). Among other things covered in considerable detail are
smaller regions, individual countries, age struc-tures, and the effect of HIV/AIDS. These results should foreshadow what one finds when projec-tions are extended to 300 years. One can expect world population growth to level off—but when, and at what level, and will population eventually decline? One might expect the vital rates underly-ing the projections to follow parallel trajectories and eventually converge across regions. How long will this take, given the assumptions made in 50-year projections? How widely will coun-tries diverge in the meantime, and how will their relative demographic positions change? Like re-gions, will individual countries also all converge, or will some differences persist? One should ex-pect all populations to age—but how much, and how large can the oldest groups in the population become?
To provide answers to such questions, similar assumptions are needed to those that underlie the 50-year projections but also extend the methodol-ogy in consistent ways. These extensions are de-tailed next.
II. PROJECTIONS AFTER 2050: LONG-RANGE
GROWTH AND DECLINE
A.SCENARIOS
To extend the projections to 2300, additional as-sumptions about the period after 2050 are needed. If fertility levels were projected to continue in-definitely at 1.85 children per woman, as the 50-year projections assume, long-range population decline would be inevitable. Instead, fertility is projected to stay below replacement level con-tinuously for no more than 100 years per country over the period from 1950 forward, and to return to replacement after 100 years, or by the year 2175, whichever comes first. Replacement level, given the low mortality rates expected in the next century, would be around 2.05 children per woman. With this assumption, countries that now have below-replacement fertility return to re-placement earlier than countries with fertility well above replacement, which first progress down-ward to a level of 1.85 in accordance with the models used for 50-year projections, and then take 100 years to return to replacement level.
To provide high and low alternatives to this main, medium scenario, the high and low scenar-ios in the 50-year projections are extended. The high scenario in the 50-year projections assumes that total fertility stays 0.5 children above the level in the medium scenario. Beyond 2050, this gap is initially narrowed to 0.25 children and then increased to approximately 0.3 children once fer-tility in the medium scenario returns to replace-ment. The long-range gap is approximate because fertility in the high scenario is fixed, eventually, at 2.35 children whereas replacement-level fertility in the medium scenario varies slightly across countries. The low scenario in the 50-year projec-tions assumes that total fertility stays 0.5 children below the level in the medium scenario. This gap then narrows to 0.25 children after 2050, and nar-rows further, once replacement level is reached in the medium scenario, to approximately 0.2 chil-dren. Long-range fertility in the low scenario is fixed at 1.85. With these assumptions, fertility levels in the high and low scenarios are some-what asymmetric around the medium scenario,
with the high scenario diverging more. The asymmetric gaps between the ultimate replace-ment fertility level for the medium variant, on one hand, and the high and low variants on the other hand are caused by initially assuming a replace-ment fertility level of, approximately, 2.1 children per women and then adding or subtracting 0.25 children to this level to calculate the high and low variant, respectively. In the actual projec-tion process, however, replacement fertility was calculated exactly as a net reproduction rate of one. This implies fluctuation of the true replace-ment fertility level about the approximate level of 2.1 children per women, and hence the asymme-try.
Besides these three scenarios, two other scenar-ios were developed for analytical purposes. The medium scenario, in the long run, assumes re-placement fertility, or a net reproduction rate of 1. This does not assure zero population growth be-cause mortality continues to decline at older ages, past reproductive age. One can however force zero growth, with births exactly equal to deaths. This requirement, imposed 50 years after a coun-try returns to replacement fertility in the medium scenario, gives an alternative, zero-growth sce-nario.
A fifth scenario is added by simply extending the constant-fertility scenario in the 2002
Revi-sion, therefore holding total fertility indefinitely at
its level in 1995-2000. This scenario produces an unrealistic, and almost unimaginable world popu-lation of 134 trillion by 2300.
Mortality assumptions are similar across all these scenarios, essentially involving an extrapo-lation of mortality patterns projected in the 2002
Revision. Following an approach developed by
Lee and Carter (1992), the matrix of projected age-specific mortality rates for both sexes com-bined in 2000-2050 is decomposed (after taking logs) into additive components representing the mean pattern for mortality by age, the product of the level of mortality (k) at a given time and the
relative speed of change at each age, and a resid-ual. An ARIMA time-series model is fitted for k and used in extrapolating trends beyond 2050 for males and females separately. No limit is set on life expectancy, and life tables are extended for projection purposes (following the Kannisto logis-tic function, Thatcher, Kannisto, Vaupel 1998) up to age 130.
Reasonable assumptions about long-range inter-national migration are difficult to make. Essen-tially as a default, zero net international migration per country is assumed beyond 2050.
The methodology represents substantial depar-tures from the previous United Nations long-range projections, which were based on the 1998
Revi-sion (United Nations, 2000). As already noted, the
50-year projections in the 2002 Revision made important changes to previous methodology, which carry over to the long-range projections. More radical changes are also made.
Projections are run by country, as is implied in the assumptions described, rather than by major area, which was the standard practice in past long-range projections. This change leads to substantial differences in the way vital rate trends are speci-fied. Specific countries will be considered, focus-ing, as has been the practice in shorter projections, mainly on the 192 countries or areas with current populations of at least 100,000. Projections were also made for 36 smaller countries and areas, to be included in aggregates, but specific country re-sults will not be detailed.
The scenarios produced are a different, simpli-fied set relative to the previous long-range projec-tions. Although some comparisons will be drawn with earlier long-range projections, identifying the specific methodological reasons for changes in results is not possible.
These long-range projections are also extended to 2300 rather than stopping at 2150, which was the previous practice. This is meant to provide a longer perspective, to allow assumed demographic trends to entirely work themselves out. How long a projection is really necessary for this purpose depends on how far into the future vital rates are allowed to change. Since the current methodology
allows life expectancy to rise indefinitely, projec-tions could in fact be extended indefinitely.
One can, however, get some idea of how long a projection is needed to see the full effects of some other assumptions. Populations grow for four rea-sons: fertility is above replacement, mortality is falling, net international migration is positive, or the age structure favours growth. The age struc-ture effect, for example, might involve having proportionally more people below, say, age 80, who are at lower risk of dying than older people.
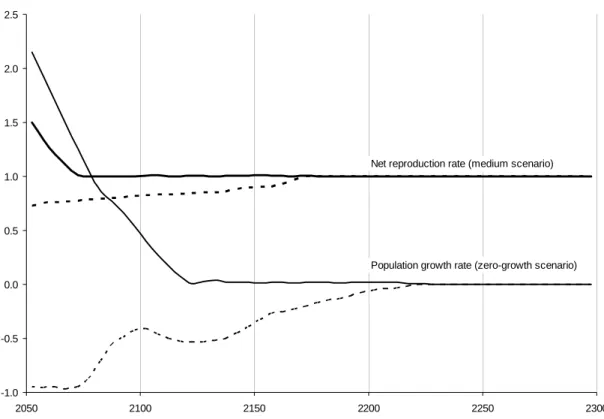
Of these four effects on growth, net migration is eliminated by assuming it is zero after 2050. The effect of fertility should be eliminated once fertil-ity reaches replacement, i.e., when net reproduc-tion settles at 1. Results from the medium scenario indicate that all 192 countries will have reached this point by 2175 (figure 5). The mortality effect will never be eliminated under the assumption of continuously rising life expectancy. This should continue to affect the age structure too, but one can eliminate effects on the age structure from changing fertility. The zero-growth scenario ac-complishes by forcing births to equal deaths be-ginning 50 years after replacement fertility is reached in a given country. Under this scenario, projected population growth is essentially zero in every one of 192 countries beginning in 2225. (It is always smaller than 0.002 per cent, in the abso-lute, for every country, but may not be exactly zero because of rounding errors in the calculations for small countries.)
Beyond 2150, therefore, number of births makes no direct contribution to population growth, and population change beyond that point—and in ear-lier periods too in some but not all countries—can be interpreted as due to mortality change or the age structure. Then, since most age structure ef-fects disappear by 2225, population change be-yond that point must stem mainly from continu-ously rising life expectancies.
Consideration of these vital rate assumptions suggests that the first half of these projections should be the more interesting part—the part where country vital rates vary more, rather than following similar trends. For the first 50 year of the projections, international migration is allowed
Figure 5. Maximum and minimum country values in each period for net reproduction rate and average annual rate of population change: 2050-2300
to vary. For the first 75 years, some countries will have fertility above replacement. For the first 100 years, some countries will not experience negative population growth. Therefore, the first century of the projections should hold the most interest, before countries are forced to follow uniform trends. Nevertheless, the variation in demographic trends over this century or so has effects that linger, requiring some attention to the longer run.
B.WORLD POPULATION
Under the assumptions made in the medium scenario projection, world population will not vary greatly after reaching 8.92 billion in 2050 (figure 6). In another 25 years, by 2075, it is pro-jected to peak at 9.22 billion, only 3.4 per cent above the 2050 estimate. It will then dip slightly to 8.43 billion by 2175 and rise gradually to 8.97 billion, very close to the initial 2050 figure, by 2300. Therefore, world population growth beyond 2050, at least for the following 250 years, is ex-pected to be minimal.
The high and low scenarios are considerably different (table 1). Population will not level off in either case. In the high scenario, it will go from 10.63 billion in 2050 to 36.44 billion in 2300. In only the half century from 2050 to 2100, world population will grow by a third, by 3.39 billion. In the low scenario, over the same span, world popu-lation will be cut by one-fourth, and over the en-tire period to 2300, by two-thirds, from 7.41 bil-lion in 2050 to 2.31 bilbil-lion in 2300. Changes in world population over 50-year periods (figure 7) reinforce the impression that substantial long-range growth or decline is within the realm of possibility, though not necessarily the most likely future path for population.
The growth rates that produce differences among scenarios are shown in figure 8. In the me-dium projection, growth stays close to 0 per cent, falling below zero till around 2175 and then rising slightly above it. Growth rates in the high and low scenarios differ by about half a percentage point from the medium scenario in opposite directions. The differences are close to being symmetrical
-1.0 -0.5 0.0 0.5 1.0 1.5 2.0 2.5
2050 2100 2150 2200 2250 2300 Net reproduction rate (medium scenario)
Figure 6. Estimated world population: 1950-2000, and projections: 2000-2300
Figure 7. Change in world population over 50-year periods, estimates and three scenarios: 1950-2300
9.0 8.8
8.5 8.5
9.1 8.9
6.1 2.5
36.4
27.8
21.2 16.7
14.0 10.6
2.3 2.7
3.2 3.9
5.5 7.4
0 5 10 15 20 25 30 35 40
1950 2000 2050 2100 2150 2200 2250 2300
Pop
u
la
ti
on
(b
ill
ions
)
Medium High Low
-2 0 2 4 6 8 10
2250-2300 2200-2250 2150-2200 2150-2200 2050-2100 2000-2050 1950-2000
50-year population change (billions)
High Medium Low Estimates
TABLE 1.POPULATION AND AVERAGE ANNUAL RATE OF CHANGE OF THE WORLD AND DEVELOPMENT GROUPS, ESTIMATES AND THREE SCENARIOS: 1950-2300
World More developed regions Less developed regions
Year or period Medium High Low Medium High Low Medium High Low
Population (millions)
1950... 2 519 — — 813 — — 1 706 — —
1975... 4 068 — — 1 047 — — 3 021 — —
2000... 6 071 6 071 6 071 1 194 1 194 1 194 4 877 4 877 4 877
2025... 7 851 8 365 7 334 1 241 1 282 1 199 6 610 7 082 6 135
2050... 8 919 10 633 7 409 1 220 1 370 1 084 7 699 9 263 6 325
2075... 9 221 12 494 6 601 1 153 1 467 904 8 068 11 027 5 696
2100... 9 064 14 018 5 491 1 131 1 651 766 7 933 12 367 4 726
2125... 8 734 15 296 4 556 1 137 1 885 679 7 597 13 411 3 877
2150... 8 494 16 722 3 921 1 161 2 152 633 7 333 14 571 3 288
2175... 8 434 18 696 3 481 1 185 2 454 593 7 249 16 242 2 889
2200... 8 499 21 236 3 165 1 207 2 795 554 7 291 18 441 2 612
2225... 8 622 24 301 2 920 1 228 3 179 517 7 395 21 122 2 403
2250... 8 752 27 842 2 704 1 246 3 612 482 7 506 24 230 2 223
2275... 8 868 31 868 2 501 1 263 4 100 448 7 605 27 768 2 053
2300... 8 972 36 444 2 310 1 278 4 650 416 7 694 31 793 1 894
Average annual rate of change (per cent)
1950-1975... 1.92 — — 1.01 — — 2.29 — —
1975-2000... 1.60 — — 0.52 — — 1.92 — —
2000-2025... 1.03 1.28 0.76 0.16 0.29 0.02 1.22 1.49 0.92
2025-2050... 0.51 0.96 0.04 -0.07 0.26 -0.41 0.61 1.07 0.12
2050-2075... 0.13 0.64 -0.46 -0.23 0.27 -0.72 0.19 0.70 -0.42
2075-2100... -0.07 0.46 -0.74 -0.08 0.47 -0.67 -0.07 0.46 -0.75
2100-2125... -0.15 0.35 -0.75 0.02 0.53 -0.48 -0.17 0.32 -0.79
2125-2150... -0.11 0.36 -0.60 0.08 0.53 -0.28 -0.14 0.33 -0.66
2150-2175... -0.03 0.45 -0.48 0.08 0.53 -0.27 -0.05 0.43 -0.52
2175-2200... 0.03 0.51 -0.38 0.07 0.52 -0.27 0.02 0.51 -0.40
2200-2025... 0.06 0.54 -0.32 0.07 0.52 -0.28 0.06 0.54 -0.33
2225-2050... 0.06 0.54 -0.31 0.06 0.51 -0.28 0.06 0.55 -0.31
2050-2075... 0.05 0.54 -0.31 0.05 0.51 -0.29 0.05 0.55 -0.32
2075-2300... 0.05 0.54 -0.32 0.05 0.50 -0.29 0.05 0.54 -0.32
between the high and the low scenarios, but the effect of the divergence is greater for the high scenario, because the population base on which these growth rates operate is larger and expand-ing. In the last century of the high scenario, growth is constant at 0.54 per cent a year, por-tending unending growth. In the low scenario, decline is essentially constant at around -0.32 per
cent a year, similarly implying no limit to decline short of extinction.
The growth rates vary largely because of varia-tion in fertility, which is also shown in the figure. Total fertility, projected at 2.00 children per woman worldwide in 2050, falls to a low point of 1.87 around 2075 (in the medium projection).
Figure 8. Average annual rate of change of the world population and total fertility, estimates and three scenarios: 1950-2300
Forty years later, world population growth reaches its low point of -0.15 per cent. Population growth takes somewhat longer after fertility bottoms out to reach its minimum in the high and low scenar-ios, but the sequence is similar.
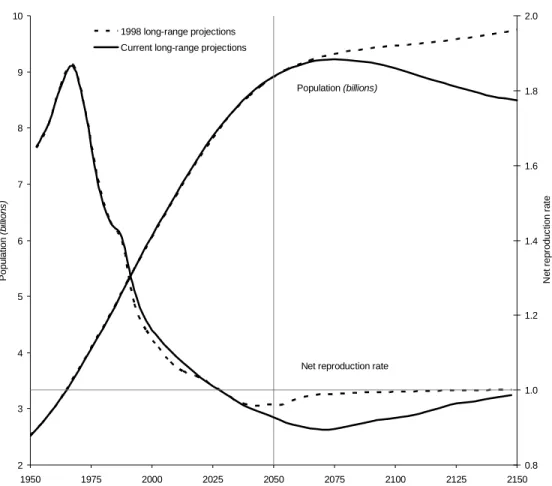
A comparison with the previous long-range pro-jection indicates the importance of fertility as-sumptions. That projection was based on the 1998
Revision and took population up to 2150. World
population growth up to 2050 in the 2002
Revi-sion is strikingly similar to growth in the 1998 Revision, as noted earlier. However, the
long-range projections beyond 2050 are quite different, with that based on the 1998 Revision showing steady growth (figure 9). The reason is fairly straightforward: fertility was assumed, in the ear-lier long-range projections, to stay only briefly below replacement, returning essentially to re-placement a decade beyond 2050 rather than, as in the current projection, staying clearly below for a century after 2050. Many countries in developing regions, in the earlier projection, never fall below replacement fertility, but in the current projection they do. The assumption, therefore, that fertility will fall to low levels for a fairly long period, not
just in more developed but also in less developed regions, is a distinctive characteristic of the cur-rent long-range projections.
Mortality levels play a role in long-range popu-lation growth, helping account for the temporary decline and being responsible for change once fertility has settled at replacement. The role of mortality, however, is not evident from trends in life expectancy. World life expectancy is pro-jected to grow along a smooth path but at a slow-ing pace. It is expected to reach 74.8 years in 2050—after having risen about 20 years in 1950-2000 and rising further about 10 years in 1950- 2000-2050. Gains beyond 2050 diminish: for 2050-2100, 8 years, and then for subsequent 50-year periods 5, 4, 3, and finally 2 years for 2250-2300. By the time rising life expectancy becomes the dominant and indeed the sole influence on growth—in 2225—it will be at 92.8 years and rising slowly, leading to an annual population growth rate over the next half century of only 0.06 per cent.
There is no indication from these trends that mortality change could produce fluctuations in -1
0 1 2 3 4 5
1950 2000 2050 2100 2150 2200 2250 2300
High Medium Low
Population growth rate (percent) Total fertility
Figure 9. Comparison of world population and net reproduction rate with previous long-range projections, estimates and medium scenario: 1950-2150
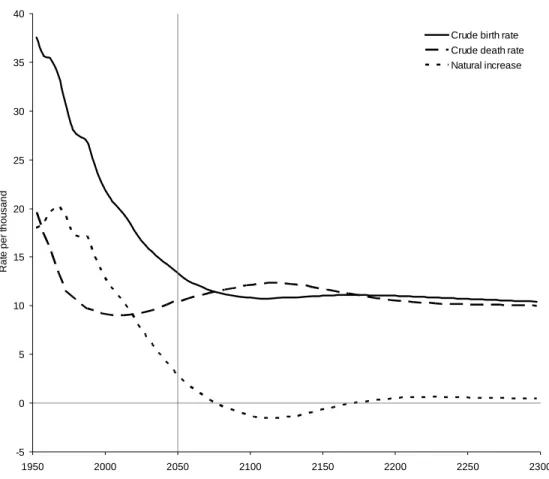
growth. Nevertheless, the crude death rate does in fact fluctuate. As births fall and populations age, the crude death rate rises, intersecting with the crude birth rate in 2075 and not falling below it again until 2170 (figure 10). Within this period, at least, the rise in the crude death rate is more sub-stantial than the fall in the crude birth rate. Should the crude death rate instead stay at its 2050 level, no population decline would occur. Mortality change therefore does make an important contri-bution to growth trends.
The medium scenario implies that the still sub-stantial population growth expected up to 2050 will not continue. If vital rates follow expected trends, world population will level off (though it may still continue to grow fairly slowly) close to the 2050 level. However, small, consistent devia-tions in vital rates from expected paths could have quite substantial effects. Population could instead (in the high scenario) be double its 2050 size
about a century later, or (in the low scenario) be only half as large in 75 years. Is the projected range for future world population too wide? For many planning purposes it probably is, though not many people are in the business of planning cen-turies in advance. This range of possibilities may in fact be a reasonable reflection of the uncer-tainty that attends population projections of sev-eral centuries. A crude way to demonstrate this is to extrapolate the confidence intervals estimated for the 1998 Revision. Doing this would set an upper limit of 37 billion by 2300, essentially the same as the high scenario. (An extrapolation for the lower limit, however, would give negative figures.)
Some patterns visible in the world projection reappear again and again in regional and country projections. Fluctuation in population growth, par-ticularly a long period of decline and an eventual return to positive but minimal growth, are typical
2 3 4 5 6 7 8 9 10
1950 1975 2000 2025 2050 2075 2100 2125 2150
P
o
pu
la
ti
on
(
b
ill
io
ns
)
0.8 1.0 1.2 1.4 1.6 1.8 2.0
N
e
t r
e
pr
o
duc
ti
on
r
a
te
1998 long-range projections Current long-range projections Series5
Series3 Series4 Series6
Population (billions)
Figure 10. Crude birth and death rate and rate of natural increase for the world, estimates and medium scenario: 1950-2300
for most countries. That fluctuations eventuate in little change in the long run, such that population in 2300 is not much different from population in 2050, is also common. That fertility first declines below replacement and then recovers to replace-ment level, and that population growth follows, with turning points about half a century later, is also a general pattern. The steady rise in life ex-pectancy, which paradoxically produces an initial rise in the crude death rate, also appears in many cases. That high and low scenarios provide a wide range around the medium scenario is the usual pattern.
These patterns recur in projections within vari-ous regions and countries. Some things do vary, however: specific levels of demographic parame-ters, as well as the timing of events. Regions and countries differ in how far fertility and growth fall, how high the crude death rate rises, and when exactly these events are projected to happen.
Figure 11 shows the projected time line of demo-graphic milestones for world population. Similar events occur in most countries, but along different time lines. The similarity of patterns might seem to imply that rates of change for regions and coun-tries should eventually converge. Whether this is in fact the case needs to be determined.
C.MORE DEVELOPED AND
LESS DEVELOPED REGIONS
At present and in projections through 2050, more developed and less developed regions are strikingly different in demographic terms. Whether these regions will still be properly dis-tinguished in the following centuries may be unlikely but is ultimately impossible to tell. One can however ask—regardless of what happens to economic, social, and political distinctions— whether these regions will remain demographi-cally distinctive.
-5 0 5 10 15 20 25 30 35 40
1950 2000 2050 2100 2150 2200 2250 2300
R
a
te
per
t
h
ousan
d
Crude birth rate Crude death rate Natural increase
Figure 11. Significant world demographic events between 2000 and 2300
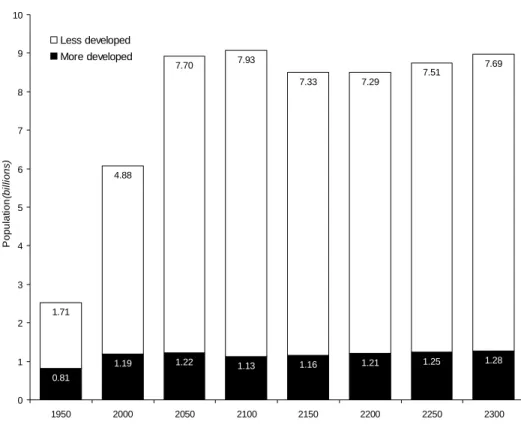
In the projections to 2050, most of the popula-tion growth is in currently less developed regions rather than in currently more developed regions. From 2050 to 2300, in contrast, less developed regions are projected to decline marginally in size, from 7.70 to 7.69 billion, whereas more developed regions actually increase, from 1.22 to 1.28 billion (figure 12). Initially, the population growth rate for less developed regions will fall while the rate in more developed regions rises, the two crossing over around 2090. Then the trends will reverse until the growth rates converge permanently around 2210 (figure 13). High and low scenarios show similar patterns. The projected range be-tween high and low projected populations is pro-portionally similar between more developed and less developed regions—though for less devel-oped regions, with their substantially larger popu-lation, the difference between high and low abso-lute numbers is much greater.
The eventually similar growth between more developed and less developed regions is produced by similar long-range assumptions, especially the
assumptions that fertility will fall in all countries below replacement (in the medium scenario) and rebound to replacement after a period largely similar across countries of a century or so. Start-ing their fertility declines later, less developed regions will reach low fertility levels after more developed regions but also stay at these levels until a later date. Figure 14 shows that total fertil-ity for the two groups crosses over around 2055 and eventually converges, just like the growth rates, with the cross-over and the convergence preceding similar points in the growth rates by roughly 50 years.
The fact that growth converges for more devel-oped and less develdevel-oped regions is not surprising given the assumptions, and in a way less interest-ing than the time required for this convergence. In more developed regions, the crude death rate be-gins rising around 1970 and reaches its peak around 2045 (figure 15). It intersects with the crude birth rate in the course of this rise around 2010, starting a period of negative natural in-crease, and intersects again on a downward path
Year Demographic event
Population (billions)
2005 Crude death rate starts rise (from 9.0 per 1000) 6.45
2025 Fertility falls to replacement (and keeps fallling) 7.85
2075 Crude death and birth rates intersect (at 11.4); 9.22 population reaches maximum
2105 Crude birth rate falls to minimum (at 10.7) 9.00 2115 Crude death rate reaches maximum (at 12.3); 8.86
growth rate at miminum (-.15% in 2105-2120)
2155 Fertility rises to replacem ent (and stays there) 8.47
2175 Crude death and birth rates intersect again (at 11.1) 8.43
Figure 12. Total population, more developed and less developed regions, estimates and medium scenario: 1950-2300
Figure 13. Average annual rate of change of the population of more developed and less developed regions, estimates and three scenarios: 1950-2300
0.81
1.19 1.22 1.13 1.16 1.21 1.25 1.28 1.71
4.88
7.70 7.93
7.33 7.29
7.51 7.69
0 1 2 3 4 5 6 7 8 9 10
1950 2000 2050 2100 2150 2200 2250 2300
P
opu
la
ti
on
(b
illio
n
s
)
Less developed More developed
-1.0 -0.5 0.0 0.5 1.0 1.5 2.0 2.5
1950 2000 2050 2100 2150 2200 2250 2300
A
v
er
age annual
r
a
te
of
c
hange
(p
er
c
ent
)
Less developed High
Medium Low
More developed High
Medium Low