VOLUME 17 ISSUE 2 (2019), Page 225 – 236
PLANNING OF PRIVATE GATED DEVELOPMENT: AN ANALYSIS OF GATED VS NON-GATED NEIGHBOURHOODS, CITY OF
GURUGRAM, INDIA
Ajay Kaushik1
1Faculty of Urban Planning and Architecture
STATE UNIVERSITY OF PERFORMING AND VISUAL ARTS, ROHTAK, HARYANA, INDIA
Abstract
The cities are expanding rapidly all over the world. India has also experienced this phenomenon and has continued the pace of growth. The recent trends in spatial growth of the cities are a new phenomenon in Indian urban landscape. The cities in India are witnessing development with the help of private developers for the last couple of decades. Being private properties these are by nature of exercising control have gates and boundaries. In scholarly literature these are called as Gated Community/Gated Development. Authors have argued them from various perspectives of anthropology, law, management and sociology etc. but very little has been discussed about their planning and morphology. Although, the rise of Gated Development is majorly attributed to the sense of fear and need for security, yet architects and urban designers, and even sociologist stress upon other methods to make the neighbourhoods secured. Hence the security aspects are not made part of the research here. The aspects of how these gated development impacts the perception of neighbourhood by residents is not touched upon. The paper discusses the distinction between the gated and non-gated neighbourhoods and also how residents perceive their neighbourhoods at large. For explaining this phenomenon, three neighbourhoods in the city of Gurugram in Haryana state in India have been identified as case study. These are identified on the basis of different morphological images that are identified. Space syntax and space cognition through sketch mapping is used for the analysis of the three neighbourhoods. The paper suggest that the continuity and connectivity of any spatial configuration is of utmost importance to make neighbourhood environment worthy of living life more socially connected.
Gurugram, India
INTRODUCTION
The liberalisation of economy during 1990s, IT sector steered the economy of the country. The distances were no constraint for ideas to germinate and mitigate. The world came closer, global became local and local became global giving rise to definition of a new term called “Glocal”. Consequently, a new form of residential development emerged i.e. the private developer oriented development that changed the urban landscape of Indian cities. This is the “Gated Development” where development is confined within gates and boundaries and such developments are on private land parcels with no relevance and respect to overall spatial and social imagery. The private developers shaped the spatial growth pattern in Indian cities. In this era of marketing a product with a packaging fascinates many groups of people.
Most scholars have been critical of territorialisation of spaces through gated development. Such gated developments on divided land parcel have been a subject of scholarship globally. Scholars at international level have opined that such developments segregate the social fabric of the society. Some of the problems in the physical morphology of such developments are formation of fragmented & fractured urban communities, non–coherent design at neighbourhood level, shared and unshared privileges, privatization of public space and discontinuity in urban fabric, and introvert closed development. The objective of the paper is to differentiate the gated and non-gated neighbourhood in terms of morphological characteristics and also bring out differences of residents perception living in these areas. For this purpose:
• Three different neighbourhoods have been identified in Gurugram city (refer figure 3).
• There morphological characteristics have been understood. The distinction between the three has been brought out.
• The perception of residents has been identified through cognition survey.
RESEARCH BACKGROUND
Thedefinition of gated communities/development in the literature is not absolute. Various terms like walled city, edge cities, enclosed neighbourhoods, enclaves etc. have been used to justify the physical nature of the development. Gwyther (2005), with reference to planned estates on Sydney fringe, says that the “MPC
This paper is on discontinuity in urban fabric and its impact on human perception. Usually the private developers develop a piece of land with boundaries and well-designed gate at the entrance to attract the prospective customers. On the other hand, gating of a neighbourhood is also a phenomenon in which and any neighbourhood is compounded with gated and boundaries. These gates/boundaries are not part of initial planning of the neighbourhood. These gates/boundaries are erected by the residents’ welfare organisation of the neighbourhood to maintain security of the area.
CONTEXT
The private developers now have a major role in shaping the spatial growth of Indian cities. In fact this is now a major trend across all countries of the world. India adopted new housing policy known as ‘National Urban Housing and Habitat Policy, 2007’ that emphasized on the role of private sector for meeting the deficit in housing. In Haryana (one of the state of India), during the last decade there has been a spurt in private residential development across the state, especially in Gurugram (a district). The kind of residential developments that are taking place in India and in the state of Haryana is similar in other countries. The master plan document enumerates the physical planning norms for a city, but it does not foresee the implication of the resultant spatial development after its implementation. Such developments are very intensive in city of Gurugram.
Gurugram, Haryana
Haryana was part of the composite Punjab state till 1966. This region has witnessed tremendous economic progress over the last 30 years due to the Green Revolution. Haryana has been spearheading the growth trends in the country and is one of the states with high growth rate. According to census 2011 the total population of Haryana was 2,53,53,081 (Government of India, 2011). Physically it is one of the smallest states in India with an area of 44,212 square kilometres. But the state’s GDP growth rate and per-capita income is amongst the highest in the country. State of Haryana encircles the National Capital Delhi on three sides and Uttar Pradesh on one side. Gurugram falls under National Capital Region. On its north, it is bounded by the Jhajjar District of the state & the union territory of Delhi; Faridabad District lies to its east. On south it shares boundaries with Mewat whereas Rewari lies in its west. It is also known as Gurgaon/Gurugram (Biswas, 2002). It is renamed by the present political dispensation as Gurugram in September 2016.
Private Developers & the Process of Urban Development in Gurugram
Gurugram, India
developers to build residences, office parks, and manufacturing facilities that met the demand of India’s booming high-tech sectors during the high-growth period that followed liberalisation of key sectors in the early 1990s.
Today the city of Gurugram is classified as region of hyper potential. The recent master plan of Gurugram has a projected population of 42.50 lacs and with an area of 16021 acres for residential development out of total of 32988 acres of developed land (Government of Haryana, 2012). Gurugram is significant from the gated development point of view because 69% of gated group housings in the state are located in Gurugram region.
With reference to Gurugram, the new sectors that are being developed show a quite different character in terms of private vs public space. As a matter of policy the land is acquired by developers from the land owners and after getting the license to develop a colony or a group housing, developers are able to sell the residential unit in terms of plots of flats. The basic nature of private development gives them the inherent character of gated and guarded residential complex.
Case Study Areas
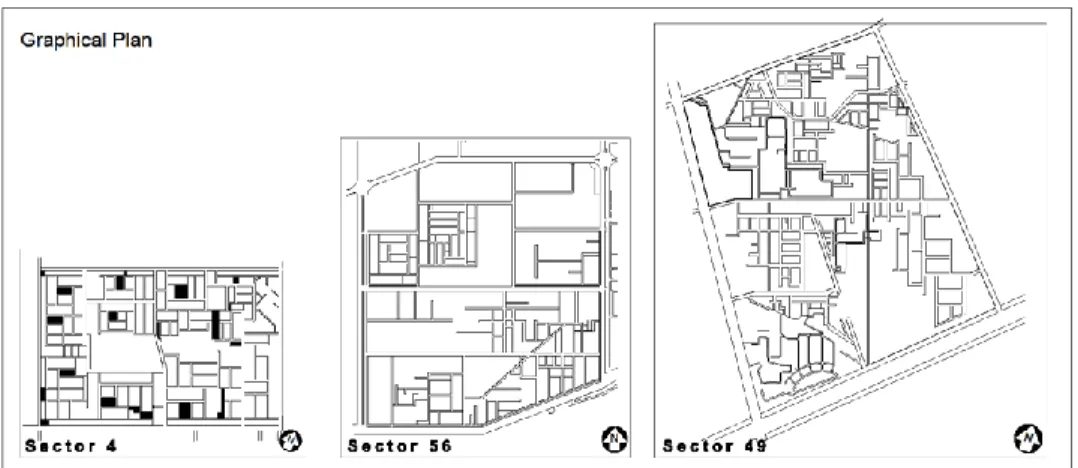
Figure 1 Graphical plan of Sectors 4, 56, 49 respectively on comparative scale
Source: Author
Sector 4
This is one of the earliest developed sectors of the city. The same was developed during 1975-1978 (Mehtani, 2012). This residential sector comprises plotted development with plot sizes that range from 150 square meters to 500 square meters. Sector development is a typical prototype of orthogonal street network system as can be seen in figure 6. A typical housing is as seen in Figure 1.
Sector 56
This sector was developed during the year 2000 (Mehtani, 2012) The residential sector comprises plotted development by HUDA and 83 group housings on plots ranging from half acre to over 15 acres. The gated group housing is spread all over and majority of them located on northern part of the sector.
Sector 49
This sector comprises mixed development and was developed between the year 1995-2000. The sector is a development initiative of private developers. Since it is developed by private developers all the respective development is gated and guarded.
METHODOLOGY
To analyse the morphology of the three distinct sectors developed at different point of time with different policy background following methodology is adopted.
Application of Space Syntax in Spatial Cognition
Gurugram, India
provides an urban morphological representation by looking at only public spaces (open space). These public spaces look like a beady ring system, in which space widens to form irregular beads, and narrows to form strings, while at the same time joining back to itself so that there are always choices of routes from any one space to any other space (Hillier & Hanson, 1984). Space syntax developed by Hillier and his colleagues at University College of London in 1984 is a set of measures for space configuration that have shown a considerable correlation with how people move through and use building and urban spaces. It represents and "measuring the pattern properties of open space in the built environment" (Kim & Penn, 2004).
Spatial Cognition
As a word, cognition originates from Latin. Latin philosophers used the word cognitio as a translation of the Greek gnosis, which the Western philosophical tradition translates as knowledge (French: connaissance, Italian: conoscenza, German: Erkenntniss) (Brandimonte, 2006). For morphological and spatial analysis, syntactical analysis has been used to understand the morphology of the sectors. This is one of the best ways to quantify the unquantifiable and to conduct a quantitative analysis of the area concerned.
Syntactic Measures
The gated development and its spatial composition of neighbourhoods were studied in detail using the space syntax. The study of street pattern comprises overall configuration and syntactical parameters like depth, connectivity, global and local integration, intelligibility and synergy. After having understood the syntactical parameters, axial map was drawn of the three selected neighbourhood namely Sector 4, 56 and 49 of Gurugram City. The axial map was prepared in Depthmap software, which was created by Alasdair Turner from University College of London. It is an application used for visibility analysis of architectural system. Following parameters of space syntax theory have been compared (Kaushik 2016). These are Connectivity, Local Integration (HH R3), Global Integration (HH or Rn), Intelligibility, and Synergy. Table 1 shows the value of the Intelligibility and Synergy when there are no gates and also when gates are identified and located and the syntactical analysis of the axial plan was done on Depthmap.
Table 1 Comparison of intelligibility and synergy of the three sectors
Intelligibility without gates
Intelligibility with gates
Synergy without gates
Synergy with gates
Sector 4 0.372276 0.292842 0.761741 0.70017
Sector 56 0.33582 0.319523 0.636327 0.634923
Sector 49 0.129983 0.129235 0.463968 0.412789
The location of gates was marked on axial plans and after that syntactical analysis was done on Depthmap. The results show that as soon as we put gates in neighbourhood sectors, it impacts the syntactical parameters in all the sectors. Both Intelligibility and Synergy values decrease with gating. It is important signal that emanates from here. What is the factor that is impacted most? And which in turn impact other syntactical properties of sector morphology? The answer lies in understanding the fact that gating affects the continuity of urban fabric. It creates discontinuity in axis and urban morphology. Connectivity is the base of all other important syntactical properties of morphological parameters. Once it is impacted the same has implications on others as well. It means that gating of neighbourhood leads to un-intelligible environment. We are bound to live in private gated residential environment that is less and less intelligible.
CONGNITIVE MAPPING AND ANALYSIS
Sketch Mapping
According to many scholars, the study of cognitive mapping to gather information about physical environment is related to spatial knowledge; as it tells how people are enabled mentally represent the physical environment they observe through their minds (Garling & Evans, 1991). For measuring the cognitive representation, 40 respondents from each sector were asked to draw their neighbourhood sector. They were asked to draw streets and buildings and also label them. Respondents were informed that the idea behind this exercise was to know how they would orient themselves in their sectors with respect to the major streets and buildings. After the respondents finished their sketch map exercise they were asked questions on why they remember to draw certain roads and not others, as well as the features of the streets. The space syntax approach and method were carried forward in further analysis of the sketch mapping exercises of the respondents.
STATISTICAL ANALYSIS
The data so obtained by the sketch map was compared with the data obtained by syntactical analysis of the actual morphological configuration obtained at the start of the exercise. SPSS 20 software was used to statistically analyse the comparison between the two kinds of data, namely; the one obtained on the basis of actual spatial configuration of all the three sectors and the one obtained after the sketch mapping exercise.
Comparative Analysis of the Differences in Mean Values of Syntactical Properties Achieved through Cognitive Sketch Map Survey
Gurugram, India
sectors achieved through cognitive sketch mapping survey. Accordingly, the Connectivity, Global Integration, and Local Integration of the three sectors were taken for comparison. The Connectivity of street network of Sector 4 was compared with that of Sector 56 and Sector 49 and that of Sector 49 was compared with that of Sector 56. Similar method was adopted for comparison between the other two syntactical properties namely Global Integration and Local Integration. Comparison of related variables is carried out by paired tests. In this test we compare the means of two related samples. The paired test compares the mean difference of the values to zero. It depends on the mean difference, the variability of the differences and the number of data.
The results show that as far as the connectivity aspect is concerned the spatial pattern is similar between Sector 4 and Sector 56. As far as the Global Integration aspect is concerned, the spatial pattern is not similar between all sectors. As far as the Local Integration aspect is concerned, the spatial pattern is similar between Sector 4 and Sector 56. The spatial patterns are similar in case of Sector 4 and Sector 56. This can be attributed to the fact that major part of Sector 56 has been planned and implemented by Government initiative and not in isolated bits and pieces. The planned street network binds the entire neighbourhood in uniform street pattern. This is not the case with Sector 49. As Sector 49 was developed in separate parts by private developers’ initiative at different point of time implementing their own disintegrated street pattern and gating system.
Analysis with Respect to Buildings
After the respondents had performed their sketch mapping exercise, they were asked a series of questions. The comparative summary of correlation between building frequency and three syntactical properties pertaining to the building recognition and their marking on the sketch map is reproduced below. One can conclude that Sector 49, which is gated and developed by private initiative at different point of time on the basis of master plans that are independent of the each other, has weak correlation between the building identification frequency and other syntactical properties of the street/axis network.
• In the case of Sector 4, the result shows that there is a weak relationship between Building Frequency as identified by the respondents and Connectivity, Global Integration and Local Integration, with the respective correlational values of r=0.079, r=0.527, r=0.422, indicating a moderate positive relationship other than between building frequency and connectivity.
• In the case of Sector 49, the result shows that there is an extremely weak relationship between Building Frequency and Connectivity, Global Integration and Local Integration, with the respective correlational values of r=0.178, r=0.054, r=0.125, indicating a very weak positive relationship.
On the whole there is a trend of weak correlation between Building Frequency and Connectivity. Whereas the correlation between Global Integration and Building Frequency is higher in the three sectors. Higher Global Integration or we can say the higher global accessibility results in higher building frequency. The Local Integration and Connectivity follow a decreasing trend with the decrease in the frequency of the buildings as identified in the case of Sector 4 and 56. However this association is not found in the case of Sector 49.
Analysis with Respect to Axis/Streets
In the cognitive survey, the respondents were asked to draw the streets/axis that they remember. It was found that the length and the width of axis have strong correlation with the axis frequency, meaning that more respondents remember longer and wider axis. The relation between the axis frequency and the Connectivity and Global Integration and Local Integration is strong in the case of Sector 4. This is attributed to the fact that Sector 4 layout was planned and executed by Government in totality and not in fragmented manner as in the case of Sector 49. Sector 49 has the fragmented layout of the streets executed by different developers at different point of time. These layouts are gated and are inaccessible to non-residents of that development.
CONCLUSION
Gurugram, India
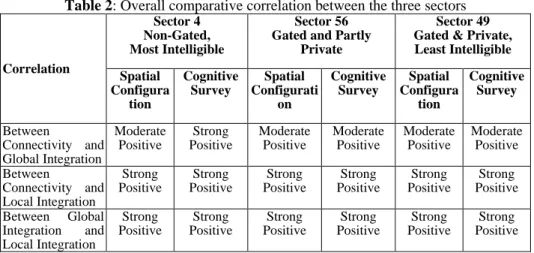
Table 2: Overall comparative correlation between the three sectors
Correlation
Sector 4 Non-Gated, Most Intelligible
Sector 56 Gated and Partly
Private
Sector 49 Gated & Private, Least Intelligible Spatial Configura tion Cognitive Survey Spatial Configurati on Cognitive Survey Spatial Configura tion Cognitive Survey Between
Connectivity and Global Integration Moderate Positive Strong Positive Moderate Positive Moderate Positive Moderate Positive Moderate Positive Between
Connectivity and Local Integration Strong Positive Strong Positive Strong Positive Strong Positive Strong Positive Strong Positive Between Global
Integration and Local Integration Strong Positive Strong Positive Strong Positive Strong Positive Strong Positive Strong Positive Source: Author
The correlation analysis between the three syntactic variables, which are Global Integration, Local Integrations, and Connectivity of all sectors reveals mixed types of relations. The space syntax analysis has shown that layout of Sector 4 is most intelligible, Sector 49 is least intelligible. While comparing the relationship between the three syntactical measures based on actual spatial configuration and that as per cognitive survey, it comes to notice that both these analysis have similar comparative results.
The correlation analysis that was performed on data collected from cognitive survey revealed that the correlations between axis frequency and the three syntactical measures for respondents of Sector 4 are relatively moderate/strong. Global Integration has the highest correlation with axis frequency and the next high correlations are Connectivity and Local Integration. It is, however, worth to mention that in all the three sectors, respondents remember the wider roads more often. As it has already been established that sector layout of Sector 4 (non-gated) is more intelligible as compared to that of Sector 49 which is gated and private. Sector 4 has a better and more legible layout of street network, which is more organised. It is further concluded that travelling/walking and use of particular roads make them easy to remember. The more and more people use the roads more it is likely to become important. The presence of landmarks/ buildings are also important factor that help in memorising the road /axis network.
neighbourhood has resulted in relatively more accurate axis recognition during cognitive survey. Even the buildings in the more intelligible sectors were recognised and remembered more often as compared to those in the unintelligible sector i.e gated one.
While finding out how much different the sectors’ morphological configuration is felt by the respondents as compared to the actual spatial analysis using space syntax, it was found that in all the three sectors the regression analysis results are similar. With Connectivity as the predictor, it was found that it influences the Global Integration and Local Integration, it means that the connectivity in any spatial system influences the other syntactical properties of any spatial layout. Since the connectivity of gated development is poor hence the Global Integration and Local Integration values also decrease in such cases. Finally, the above discussion put forward that in contemporary world when we are moving towards more and more of gated development through the participation of private sector as we are leading towards more un-intelligible neighbourhood environment. The environment has least proximity and access to common citizen. This way we are moving towards a city image that is constituted of private and caged environment. There is a need to look into such practices.
ACKNOWLEDGMENTS
This paper is a part of ongoing research at Deenbandhu Chhotu Ram University of Science and Technology, Murthal, Sonepat, Haryana. I am indebted to my supervisor Dr. Jyoti Pandey Sharma for her timely advice and encouragement.
REFERENCES
Biswas, S. (2002). Gurgaon Mega Corporate Park. Architecture + Design, Nov- Dec 2002, 68-73.
Brandimonte, M. A., Bruno, N., & Collina, S. (2006). Cognition. In P. Pawlik & G. d’Ydewalle (Eds.), Psychological concepts: An international historical perspective (pp 1-22). Hove, UK: Psychology Press.
Government of India (2011). Census of India, New Delhi: Office of the Registrar General and Census Commissioner. Retrieved from http://censusindia.gov.in/ Garling, T., & Evans, G. W. (1991). Environment, cognition and action – An integrated
approach. New York: Oxford University Press.
Government of Haryana (2012). Gurgaon Manesar Urban Complex - GMUC 2031. Haryana: Town and Country Planning Department. Retrieved from https://tcpharyana.gov.in/
Development_Plan/ColouredCopy/GMUC_DDP_2031.pdf
Gwyther, G. (2005). Paradise planned: Community formation and the master planned estate. Urban Policy and Research, 23(1), 57-72.
Hillier, B & Hanson, J. (1984). The social logic of space. Cambridge: Cambridge University Press, UK.
Gurugram, India
Kaushik, A. (2016). Space syntax- A tool for smart and analytical investigation into urban settings. Journal of the Indian Institute of Architects, 81(11), 23-28.
Kim, Y. O. & Penn, A. (2004), Linking the spatial syntax of cognitive maps to the spatial syntax of the environment. Environment and Behavior-B, 36 (4), 483-504. Mathieu, P. (2016). Gated community as a postmodern utopia. Proceedings of 4th Int.
Conf. Res. Netw. Priv. Urban Gov. Gated Communities (pp 1-20).
Mehtani. P. C. (2012). Growth, developmen1t and sustainability of cities: A case study of Gurgaon (Doctoral Dissertation). University of Delhi, India