VOLUME 17 ISSUE 2 (2019), Page 179 – 190
QUANTIFYING THE ABOVEGROUND BIOMASS AND CARBON STORAGE OF URBAN TREE SPECIES IN SOKOTO METROPOLIS,
NORTH-WESTERN NIGERIA
Dangulla Murtala1, Latifah Abd Manaf2, Mohammed Firuz Ramli3,
Mohd Rusli Yacob4, & Ahmad A. Makmom5
1
Department of Geography
USMANU DANFODIYO UNIVERSITY, SOKOTO, NIGERIA 2,3,4
Department of Environmental Science
UNIVERSITI PUTRA MALAYSIA 5
Department of Environmental Management
UNIVERSITI PUTRA MALAYSIA
Abstract
Increases in human activities, land use/cover changes and urbanisation have led to continuous accumulation of carbon dioxide and other greenhouse gases in the atmosphere, thus threatening the efficiency of natural carbon sinks such as urban trees. This paper assessed the aboveground biomass and carbon stock of trees in Sokoto metropolis, North-Western Nigeria, using an allometric equation. The metropolis was stratified into five broad land use/cover types from which 200 sample plots of 30m × 30m were generated. Data on tree species and diameter at breast height were collected from all trees ≥ 5cm in diameter within the plots. A total of 722 trees belonging to 30 species in 17 genera and 14 families were identified. The trees stored 854.73 tonnes of biomass equivalent to 427.37 tonnes of carbon with the highest proportion being stored by Azadirachta indica, Mangifera indica, Adansonia digitata, and Ficus polita. There was a significant difference in tree biomass and carbon stock across the land use/cover types (F = 4.730, p < 0.001). The Green Area recorded the highest carbon density of 96.5t ha-1 while Farmland recorded the least carbon density (7.4t ha-1). Urban areas
have diverse tree species that could contribute significantly to reducing global atmospheric carbon. This potential, which varies with the species, number, and size of trees, as well as land cover, can be successfully estimated using allometric equations.
North-Western Nigeria
INTRODUCTION
Carbon dioxide (CO2) contributes approximately 84% of global radiative forcing
(World Meteorological Organization, 2014) and 60% of observed global warming (Grace, 2004) making it the most important anthropogenic greenhouse gas in the atmosphere. The atmospheric concentration of CO2 rose from about
300 ppm in the pre-industrial 1880s to about 405.58 ppm in 2017 (World Meteorological Organization, 2014). This threatens the efficiency of global natural carbon sinks and accelerates the process of global warming (Canadell et al., 2010). Most of these increases are attributable to human activities such as burning fossil fuels, land use/cover changes (Wang et al., 2014), and urbanisation (Churkina, 2016).
Urban areas are centres of economic and commercial activities, as they accommodate more than half of the global population. These areas require higher amount of fossil fuel for transportation, cooking, heating, cooling, and electricity generation; thus, emitting higher atmospheric carbon (Pataki et al., 2006). According to the United Nations (2018), the rates of urbanisation are higher in Asia and Africa where levels of carbon dioxide emissions are also higher (Clerici, Rubiano, Abd-Elrahman, Posada, & Escobedo, 2016). It was envisaged that Africa would contribute about 21% of the global urban population, with Nigeria expected to contribute an estimated 186 million people by 2050 (United Nations, 2018).
purposes could be generated. The aim of this paper is, therefore, to estimate the biomass and carbon stock of trees in Sokoto metropolis, North-Western Nigeria and highlight the contribution of individual tree species in the region to urban carbon balance (Tang, Chen, & Zhao, 2016), reduction of CO2 emissions in the
global carbon cycle, and climate change mitigation.
MATERIALS AND METHOD
The Study Area
Sokoto is located on latitudes 13°3'5"N and longitudes 5°13’53"E, and covers an area of about 94 km2 (Figure 1). The city has an estimated population of 554,775 people (National Bureau of Statistics, 2016), and lies in a semi-arid region with typical Koppen’s tropical wet and dry (Aw) climate (Belda, Holtanová, Halenka, & Kalvová, 2014). The mean annual temperature in this zone ranges between 21℃ and 33℃ while mean annual rainfall ranges between 508mm in the driest part to 1,016mm in the wettest part (Sanni, Odekunle, & Adesina, 2012). Vegetation comprises the Sudano-Sahelian type of short, feathery grasses, and some spiny woody species (Nsangu, 2009). The soils are generally leached and ferruginous consisting of silt and sand with hydromorphic soils found in riverine areas (Swindell, 1986).
Sampling and Data Collection
North-Western Nigeria
Figure 1 Classified land cover map of Sokoto metropolis and sample points distribution
Tree data were collected from 189 plots, as the remaining 11 plots were not accessible due to privacy issues. We demarcated 30m × 30m (0.09ha) quadrats at each sample point to coincide with the resolution of the Landsat image used in the classification (Ren et al., 2017). All trees with a diameter ≥ 5cm within the quadrats were identified to species level with the aid of a trained botanist. Species provenance (native or exotic) was established with reference to Lely (1925) and Keay, Onochie and Stanfield (1964), while nomenclature followed Hutchinson and Dalziel (1972). Tree diameter at breast height (DBH) was measured 1.3 m from the ground with a diameter tape, while basal area was derived from Equation (1):
BA = (𝑑1
2)
2𝜋 Equation
(1) where,
BA = Basal Area d = Diameter
Data Analysis
Tree species composition, structural characteristics and density were calculated, while aboveground biomass (AGB) and carbon stock (C) were estimated using an allometric equation. Using allometric equations to estimate AGB is a more popular option (Vashum & Jayakumar, 2012) than the expensive and time-consuming, destructive approach (Chave et al., 2014). Many such equations exist in the literature (e.g. Chave et al., 2014; Feldpausch et al., 2011). However, this study adopted the equation provided by Brown, Gillespie and Lugo (1989), which was developed specifically to estimate AGB of trees in dry climates with less than 900mm annual rainfall and successfully used in other studies (e.g. O’Donoghue & Shackleton, 2013; Woldegerima, Yeshitela, & Lindley, 2017). This is given in Equation (2):
Y = exp{-1.996+2.32*ln(D)} Equation
(2)
where,
Y = biomass per tree (kg)
exp = e – (the base of natural logarithms), raised to the power of (…) D = DBH (cm)
The equation uses tree DBH as the predictor variable as this produces the most stable regional AGB estimates (Montagu, Düttmer, Barton, & Cowie, 2005), while also reducing uncertainties (Liu & Li, 2012). The results were multiplied by a conversion factor of 0.8 (Nowak et al., 2013) to account for the variability in biomass and carbon content between open-grown and high-biomass forest trees, which were used to develop most of the AGB estimation equations. This was then multiplied by 0.5 to obtain carbon stock (Liu & Li, 2012).
RESULTS AND DISCUSSION
Tree Species Composition, Biomass and Carbon Stock
The total number of species recorded, their status, nomenclature and corresponding biomass and carbon stock is given in Table 1. A total of 722 stems belonging to 30 species in 17 genera and 14 families were recorded. The native species accounted for 26.8% of the stems while exotic species accounted for 73.2%. Species with a higher number of stems include Azadirachta indica (424),
Mangifera indica (68), Adansonia digitata (37), Ficus polita (37) and Terminalia catappa (24).
North-Western Nigeria
and Ficus polita. These species accounted for 86% of the total biomass and carbon stock recorded (Table 1).
Table 1 Trees Species composition, provenance, biomass and carbon stock in Sokoto metropolis
S/N Species Family Stems Status Y(t) C(t) Mean
C (t)
1 Acacia machrostachya (Reichenb.
ex Benth.) Fabaceae 9 Nt 11.70 5.85 1.30
2 Acacia nilotica (Linn., Willd. ex
Del.) Fabaceae 7 Nt 2.13 1.06 0.30
3 Adansonia digitata (Linn.) Malvaceae 37 Nt 63.98 31.99 1.88 4 Albizia lebbeck (Linn.) Benth. Fabaceae 5 Ex 5.07 2.54 0.85 5 Anacardium occidentale (Linn) Anacardiaceae 1 Nt 0.03 0.02 0.03
6 Anogeissus leiocarpus (DC., Guill.
& Perr) Combretaceae 3 Nt 1.58 0.79 0.39
7 Azadirachta indica (A. Juss) Meliaceae 424 Ex 521.4 260.7 1.24 8 Balanites aegyptiaca (Linn., DeI.) Balanitaceae 16 Nt 16.19 8.10 1.01 9 Borassus aethiopium (Mart.) Palmae 3 Nt 1.64 0.82 0.55
10 Citrus aurantifolia (Christm.,
Swingle) Fruitaceae 1 Ex 0.30 0.15 0.30
11 Cocos nucifera (Linn) Palmae 2 Ex 1.45 0.72 0.72 12 Crescentia cujete (Linn.) Bignoniaceae 1 Ex 0.05 0.02 0.05 13 Delonix regia (Roxb.) Fabaceae 11 Nt 10.41 5.20 1.16
14 Eucalyptus smithi (F. Muell. ex
R.T. Baker) Myrtaceae 14 Ex 5.17 2.58 0.37
15 Ficus polita (Vahl) Moraceae 37 Nt 39.05 19.53 1.03 16 Ficus thonongii (Blume) Moraceae 17 Nt 14.95 7.47 0.88 17 Gmelina arborea (Roxb.) Lamiaceae 6 Ex 6.26 3.13 1.04 18 Khaya senegalensis (Desr.) A. Juss. Meliaceae 1 Nt 1.49 0.74 0.50
19 Lannea microcarpa (Engl. & K.
Krause) Anacardiaceae 2 Nt 0.51 0.26 0.17
20 Mangifera Indica (Linn.) Anacardiaceae 68 Ex 109.92 54.96 1.59 21 Moringa oleifera (Lam.) Moringaceae 1 Nt 0.10 0.05 0.10 22 Parkia biglobosa (Jacq., Benth) Fabaceae 7 Nt 10.85 5.43 1.55 23 Phoenix dactylifera (Linn.) Palmae 1 Nt 1.90 0.95 1.90
24 Piliostigma reticulatum (DC.,
Hochst.) Fabaceae 6 Nt 0.95 0.48 0.19
25 Psidium guajava (Linn.) Myrtaceae 3 Ex 0.04 0.02 0.01
26 Sclerocarya birrea Hochst.) (A. Rich., Pedaliaceae 3 Nt 3.63 1.82 1.21
27 Tamarindus indica (Linn). Fabaceae 2 Nt 4.58 2.29 2.29 28 Terminalia catappa (Linn.) Combretaceae 24 Ex 12.37 6.18 0.49 29 Terminalia ivorensis (A. Chev.) Combretaceae 9 Nt 4.44 2.22 0.44 30 Vitex doniana (Sweet) Verbenaceae 1 Nt 2.2 1.11 1.11
722 854.4 426.1
Nt = Native species; Ex = Exotic species; Y = Biomass; C = Carbon Stock; t = tonne
Tree Species, Biomass and Carbon Stock Distribution
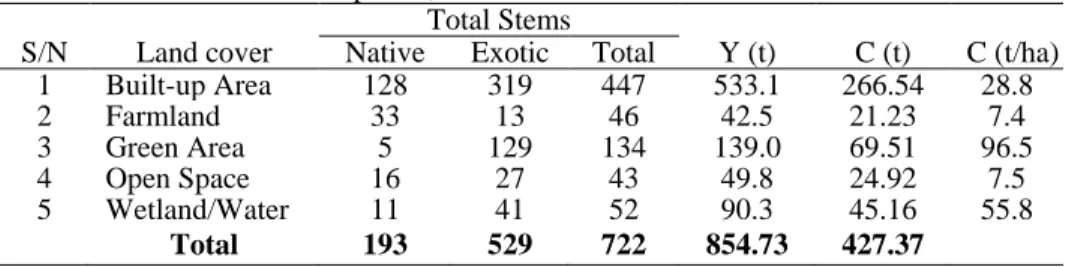
number of stems (43) was recorded in the Open Space. Similarly, the highest stem density was obtained in the Green Area (184ha-1) while the lowest stem density (12.9ha-1) was recorded in the Open Space. The density and distribution of biomass and carbon stock also vary significantly between the different land use/cover types. The total biomass and carbon stock were higher in the Built-up and Green areas, while the lowest values were recorded in the Farmland. However, carbon density per hectare was higher in the Green Area (96.5 tonnes ha-1) and Wetland/Water area (55.8 tonnes ha-1) even though the Built-up Area had higher total biomass and carbon stock (Table 2).
Table 2 Trees species, biomass and carbon stock distribution Total Stems
S/N Land cover Native Exotic Total Y (t) C (t) C (t/ha) 1 Built-up Area 128 319 447 533.1 266.54 28.8 2 Farmland 33 13 46 42.5 21.23 7.4 3 Green Area 5 129 134 139.0 69.51 96.5 4 Open Space 16 27 43 49.8 24.92 7.5 5 Wetland/Water 11 41 52 90.3 45.16 55.8
Total 193 529 722 854.73 427.37 Y = Biomass; C = Carbon stock
DISCUSSION
The composition and distribution of trees species in this study (Table 1) shows that Sokoto metropolis is composed of few native and exotic tree species distributed disproportionately across the different land use/cover types. The exotic species however, have higher stem population, thus dominating the landscape. This has been reported in many studies (e.g. Kuruneri-Chitepo & Shackleton, 2011; Seburanga, Kaplin, Zhang, & Gatesire, 2014), thereby raising the fear that the exotic species may in the long run, outcompete the native species in many cities due to biotic homogenisation (McKinney, 2006). Hence, much need to be done to improve tree abundance and diversity in the metropolis through afforestation programmes and tree planting campaigns. Such programmes should take account of the many stresses urban tress are exposed to as a result of increasing urban temperatures, restricted rooting space, water deficiencies (Davies et al., 2011) and the ecosystem service potentials of the different tree species.
North-Western Nigeria
with medium to high trunk diameters, which are a characteristic of the Savannah ecosystem where the city is located (Glèlè Kakaï & Sinsin, 2009)
.
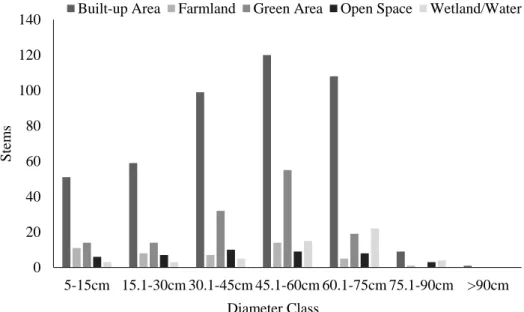
Most of the stems (73.1%) have a trunk diameter between 30cm and 75cm. About 2.5% had a diameter of more than 75cm and only 24.4% of the stems have a trunk diameter of less than 30cm (Figure 2).Figure 2 Stem diameter distribution
Although the carbon storage and sequestration potential of urban trees in this part of the world have somehow been neglected, this study shows that urban trees in the region are good carbon sinks. This however, varied with the type of species, diameter and land use/cover type. Species with the highest mean biomass and carbon stock include Tamarindus indica, Phoenix dactylifera, Adansonia digitata, Mangifera Indica and Parkia biglobosa (Table 1). Between the land cover types, the Built-up and Green areas accounted for 80% of the stems recorded and also accommodate most of the large-diameter trees. Higher total biomass and carbon stock were therefore recorded in these areas (Table 2).
The structural characteristics of tree species recorded in this study varied across the land use/cover types. These to a large extent, determined the biomass and carbon stock of trees in the metropolis. A one-way Analysis of Variance (ANOVA) revealed significant difference in mean stem diameter (f = 5.79, p < 0.001), mean stem basal area (f = 5.21, p < 0.001) and consequently, mean stem biomass and carbon stock (f = 4.73, p < 0.001) across the different land use/cover types. The highest mean stem biomass (1.73t/stem) was recorded in the
0 20 40 60 80 100 120 140
5-15cm 15.1-30cm 30.1-45cm 45.1-60cm 60.1-75cm 75.1-90cm >90cm
Stem
s
Diameter Class
Wetland/Water where mean stem diameter was highest and the lowest mean stem biomass (0.92t/stem) was recorded in the Farmland where mean stem diameter was correspondingly lower (Table 3).
Table 3 Comparison of structural parameters and tree biomass
S/N Parameter BUA Farmland GA OS WW f p
1 Total Stems 477 46 134 43 52
2 Stem Density
(ha-1) 48.22 15.97 186.1 12.91 64.2
3 Mean DBH
(cm) ±SD 44.6± 20.8 36.8± 23.4 43.4± 16.95 43.3± 22.0 55.8±
18.8 5.79 .001
4 Mean BA
(cm2) ±SD
1903.7 ± 1645.4 3 1487.1± 1448.29 1701.7± 1016.16 1846.7± 1558.16 2714.4±
1395.61 5.21 .001
5 Mean Biomass (t) ±SD 1.19± 1.18 0.92± 0.96 1.03± 0.66 1.15± 1.05 1.73±
0.95 4.73 .001
BUA = Built-up Area; GA = Green Area; OS = Open Space; WW = Wetland/ Water
CONCLUSION
Sokoto metropolis is composed of a few tree species which are distributed disproportionately across the land cover classes. Depending on the tree species, tree density and diameter as well as land cover type, these trees store a considerable amount of aboveground biomass and carbon stock and thus, contribute significantly to the regional and global carbon budget. In view of climate change mitigation, Tamarindus indica, Phoenix dactylifera, Adansonia digitata, Mangifera Indica and Parkia biglobosa which have higher mean biomass and carbon stock storage should be adopted as species of choice in the metropolis and widely propagated.
ACKNOWLEDGEMENT
We acknowledge the support from Universiti Putra Malaysia under Grant GCS15-4002.
REFERENCES
Belda, M., Holtanová, E., Halenka, T., & Kalvová, J. (2014). Climate classification revisited: From Köppen to Trewartha. Climate Research, 59(1), 1-13.
Brown, S., Gillespie, A. J. R., & Lugo, A. E. (1989). Biomass estimation methods for tropical forests with applications to forest inventory data. Forest Science, 35(4), 881-902.
North-Western Nigeria
Chave, J., Coomes, D., Jansen, S., Lewis, S. L., Swenson, N. G., & Zanne, A. E. (2009). Towards a worldwide wood economics spectrum. Ecology Letters, 12(4), 351-366.
Chave, J., Réjou-Méchain, M., Búrquez, A., Chidumayo, E., Colgan, M. S., Delitti, W. B. C., …& Vieilledent, G. (2014). Improved allometric models to estimate the aboveground biomass of tropical trees. Global Change Biology, 20(10), 3177-3190.
Churkina, G. (2016). The role of urbanization in the global carbon cycle. Frontiers in Ecology and Evolution, 3, 144.
Clerici, N., Rubiano, K., Abd-Elrahman, A., Posada, H. J., & Escobedo, F. (2016). Estimating aboveground biomass and carbon stocks in periurban Andean secondary forests using very high resolution imagery. Forests, 7(7), 138. Conway, T. M., & Vander Vecht, J. (2015). Growing a diverse urban forest: Species
selection decisions by practitioners planting and supplying trees. Landscape and Urban Planning, 138, 1-10.
Dahlhausen, J., Biber, P., Rötzer, T., Uhl, E., & Pretzsch, H. (2016). Tree species and their space requirements in six urban environments worldwide. Forests, 7(6), 1-19.
Davies, Z. G., Edmondson, J. L., Heinemeyer, A., Leake, J. R., & Gaston, K. J. (2011). Mapping an urban ecosystem service: Quantifying above-ground carbon storage at a city-wide scale. Journal of Applied Ecology, 48(5), 1125-1134.
Feldpausch, T. R., Banin, L., Phillips, O. L., Baker, T. R., Lewis, S. L., & Quesada, C. A. (2011). Height-diameter allometry of tropical forest trees. Biogeosciences, 8, 1081-1106.
Glèlè Kakaï, R., & Sinsin, B. (2009). Structural description of two Isoberlinia dominated vegetation types in the Wari-Maro Forest Reserve (Benin). South African Journal of Botany, 75(1), 43-51.
Grace, J. (2004). Understanding and managing the global carbon cycle. Journal of Ecology, 92(2), 189-202.
Hutchinson, J., & Dalziel, J. (1972). Flora of West Tropical Africa. (R. W. J. K. and F. N. Hepper, Ed.) (Revised). London: Crown Agents for Overseas Governments and Administrations.
Justin, M., Östberg, J., Konijnendijk van den Bosch, C., Nielsen, A. B., Hauer, R., Sjöman, H., …& Jansson, M. (2016). Urban tree diversity-Taking stock and looking ahead. Urban Forestry and Urban Greening, 15, 1-5.
Keay, R. W. J., Onochie, C. F. A., & Stanfield, D. P. (1964). Nigerian Trees. Federal Department of Forest Research Ibadan, Nigeria (Vol. 1). Apapa, Lagos: Nigerian National Press Ltd.
Kuruneri-Chitepo, C., & Shackleton, C. M. (2011). The distribution, abundance and composition of street trees in selected towns of the Eastern Cape, South Africa. Urban Forestry & Urban Greening, 10(3), 247-254.
Lely, H. V. (1925). The useful trees of Northern Nigeria. London, S.W.1: Crown Agents for the Colonies.
Levy, P. S., & Lemeshow, S. (2011). Sampling of pPopulations: Methods and applications (Fourth Edition). (n.p.): Wiley.
China. Urban Forestry and Urban Greening, 11(2), 121-128.
Liu, T., & Yang, X. (2015). Monitoring land changes in an urban area using satellite imagery, GIS and landscape metrics. Applied Geography, 56, 42-54.
McKinney, M. L. (2006). Urbanisation as a major cause of biotic homogenization. Biological Conservation, 127, 247-260.
McPherson, E. G., Xiao, Q., & Aguaron, E. (2013). A new approach to quantify and map carbon stored, sequestered and emissions avoided by urban forests. Landscape and Urban Planning, 120, 70-84.
Montagu, K. D., Düttmer, K., Barton, C. V. M., & Cowie, A. L. (2005). Developing general allometric relationships for regional estimates of carbon sequestration - An example using Eucalyptus pilularis from seven contrasting sites. Forest Ecology and Management, 204(1), 113-127.
National Bureau of Statistics. (2016). Annual abstract of statistics (Vol. 1). Abuja, Nigeria: Author.
Nowak, D. J., Crane, D. E., Stevens, J. C., & Hoehn, R. E. (2003). The Urban forest Effects (UFORE) model: Field data collection manual (Vol. 13210). Syracuse, NY: USDA Forest Service, Northeastern Research Station.
Nowak, D. J., Greenfield, E. J., Hoehn, R. E., & Lapoint, E. (2013). Carbon storage and sequestration by trees in urban and community areas of the United States. Environmental Pollution, 178, 229-236.
Nowak, D. J., Walton, J., Stevens, J. C., Crane, D. E., & Hoehn, R. E. (2008). Effect of plot and sample size on timing and precision of urban forest assessments methods. Arboriculture and Urban Forestry, 34(6), 386-390.
Nsangu, C. A. (2009). Urban agriculture and physical planning: A case study of Zaria, Nigeria. In M. Redwood (Ed.), Agriculture in urban planning: Generating livelihoods and food security (pp. 217–234). London: Earthscan Publications Ltd.
O’Donoghue, A., & Shackleton, C. M. (2013). Current and potential carbon stocks of trees in urban parking lots in towns of the Eastern Cape, South Africa. Urban Forestry and Urban Greening, 12(4), 443-449.
Pataki, D. E., Alig, R. J., Fung, A. S., Golubiewski, N. E., Kennedy, C. A., Mcpherson, E. G., …& Lankao, P. R. (2006). Urban ecosystems and the North American carbon cycle. Global Change Biology, 12(11), 2092-2102.
Peter, de L., & Shackleton, C. M. (2017). Aesthetic and spiritual ecosystem services provided by urban sacred sites. Sustainability (Switzerland), 9(9), 1628. Ren, Z., Du, Y., He, X., Pu, R., Zheng, H., & Hu, H. (2017). Spatiotemporal pattern of
urban forest leaf area index in response to rapid urbanization and urban greening. Journal of Forestry Research, 29(3), 785-796.
Sanni, M., Odekunle, T. O., & Adesina, F. A. (2012). Spatio-temporal variation of drought severity in the Sudano-Sahelian Region of Nigeria: Implications for policies on water management. In W. L. Filho (Ed.), Climate change and the sustainable use of water resources. Berlin Heidelberg: Springer-Verlag. Seburanga, J. L., Kaplin, B. A., Zhang, Q.-X., & Gatesire, T. (2014). Amenity trees and
green space structure in urban settlements of Kigali, Rwanda. Urban Forestry & Urban Greening, 13(1), 84-93.
North-Western Nigeria
Nigeria. A study of political intervention, adaptation and change, 1800-1980. Cahiers d’Etudes Africaines, 101–102, 75-111.
Tang, Y., Chen, A., & Zhao, S. (2016). Carbon storage and sequestration of urban street trees in Beijing, China. Frontiers in Ecology and Evolution, 4(53), 1-8.
United Nations. (2018). World urbanization prospects: The 2018 revision. Department of Economic and Social Affairs, Population Division, Methodology Working Paper No. ESA/P/WP.252. New York.
Vashum, K. T., & Jayakumar, S. (2012). Methods to estimate above-ground biomass and carbon stock in natural forests - A review. Journal of Ecosystem & Ecography, 2(4), 1-7.
Wang, Y., Ji, W., Yu, X., Xu, X., Jiang, D., Wang, Z., & Zhuang, D. (2014). The impact of urbanization on the annual average temperature of the past 60 years in Beijing. Advances in Meteorology, 014(1), 1-10.
Woldegerima, T., Yeshitela, K., & Lindley, S. (2017). Ecosystem services assessment of the urban forests of Addis Ababa, Ethiopia. Urban Ecosystems, 20(3), 683-699. World Meteorological Organization. (2014). The state of greenhouse gases in the atmosphere based on global observations through 2013. Available at https://www.wmo.int/pages/ mediacentre/press
Yang, J., McBride, J., Zhou, J., & Sun, Z. (2005). The urban forest in Beijing and its role in air pollution reduction. Urban Forestry and Urban Greening, 3(2), 65-78. Zhang, D., Zheng, H., He, X., Ren, Z., Zhai, C., Yu, X., … Wang, P. (2016). Effects of forest type and urbanization on species composition and diversity of urban forest in Changchun, Northeast China. Urban Ecosystems, 19(1), 455-473