Equivalence Testing the Easy Way
Vesna Lu
zar-Stif
ˇ
fl
er
1and Charles Stif
fl
er
21University Computing Centre and CAIR Research Center, Zagreb, Croatia 2CAIR Research Center, Zagreb, Croatia
The purpose of the article is to demonstrate an equiv-alence testing software application written under SAS1 Institute software designed for use by pharmaceutical and other medical research professionals. Besides making the entire equivalence testing procedure easier and more efficient, the application “EquivEasy” offers three main advantages over similar software: a)testing for 3 3
in addition to 2 2 crossover designs, b)familiar SAS
user environment, and c)export flexibility (MS Word,
PDF, HTML). Two case studies are presented with report
results provided in tabular and graphical form.
Keywords: equivalence testing, SAS application, cross-over design, TOST, nonparametric tests, clinical trials.
1. Introduction
The purpose of this paper is to describe a new SAS software-based statistical application “EquivEasy”, that has been designed and de-veloped with the aim of making the actual exe-cution of equivalence testing procedures easier for a typical final user (e.g., a researcher in a pharmaceutical company, etc.), while at the same time ensuring both a high level of statis-tical competency and access to other powerful features (e.g., import formats, other statistical procedures, etc.) of the SAS software.
Equivalence testing now represents one of the most frequently used routine applications in clinical pharmacokinetic studies.
Although any clinical statistician can easily per-form an equivalence testing procedure using al-most any reliable statistical software, less ex-perienced researchers can benefit from hav-ing a quick, easy, programmhav-ing-free, “shrink
wrapped” application for performing both rou-tine and some of the more demanding equiva-lence tests.
In some simple situations one can use SAS Ana-lyst Application’s “equivalence testing” option,
but for more complex situations (e.g., 3 3
crossover design, nonparametric tests), one has to resort to programming.
Among other software solutions for equivalence testing the best known is the EquivTest from Statistical Solutions Ltd., Ireland10].
The application described in this paper offers three main advantages as compared to existing solutions for equivalence testing. They are as follows:
1) the possibility to perform equivalence testing for 3 3(3 treatments, 3 periods)crossover designs(in addition to 2 2 crossover and parallel designs),
2) the added flexibility and power of the SAS environment(the “de facto” standard for sta-tistical analysis in pharmaceutical industry), and
3) exporting flexibility(results can be created in simple listing and various graphics
for-mats, MS word, PDF, and HTML formats).
2. Equivalence Testing
Equivalence studies are different from other clinical studies in that the desired inference in equivalence studies, instead of the usual “sig-nificant difference”, is “practical difference”.
Therefore, in equivalence studies the null hy-pothesis tested is “Treatment 1 is NOT equiv-alent to treatment 2” versus the alternative hy-pothesis “Treatment 1 is equivalent to treatment 2”. (Note: Treatment 2(T2)is usually denoted as “R”, for “reference” treatment.)
Test for
Difference EquivalenceTest for
Null
Hypothesis equal to TT1 2
T1not equivalent
to T2 Alternative
Hypothesis
T1 different
from T2
T1 equivalent
to T2
Table 1.Equivalence vs. superiority trials.
There are, generally speaking, two types of equivalence studies: clinical equivalence and bioequivalence studies. Each type has its own purpose:
In Clinical Equivalence(CE)studies treatments are proclaimed “similar” with respect to clini-cal outcome(e.g., response rates, BP, survival). CE can take into account different therapeutic measures with different mechanisms of action. In Bioequivalence(BE)studies, drugs are “sim-ilar” with respect to pharmacokinetic
charac-teristics (e.g., AUC, CMAX, TMAX). BE is
limited to drugs with the same mechanism of action.
Although there are several different approaches to testing bioequivalence, the most common one
(also recommended by FDA
2
11])is based on equivalence region, and ultimately on
confi-dence sets. The equivalence region E can be
defined as follows:
Letδ denote the difference between treatments T1and T2.
Let E be a set of “small” differences.
Ifδ lies in E(i.e., ifδ is “small”), then we say that T1and T2are equivalent.
Ifδ does not lie in E(i.e., ifδ is “large”), then we say that T1and T2 differ in a clinically rel-evant way. (That is, it cannot be claimed that they are “substitutes”.)
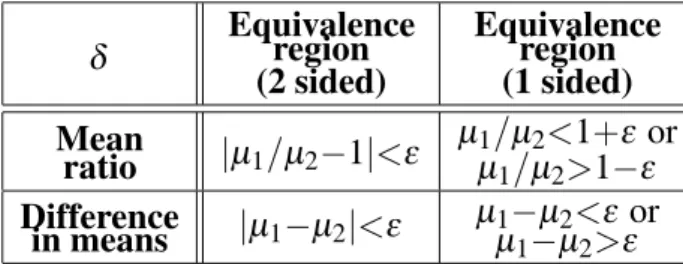
δ Equivalence(2 sided)region Equivalence(1 sided)region
Mean
ratio jµ1=µ2;1j<ε µ
1=µ2<1+ε or
µ1=µ2>1;ε Difference
in means jµ1;µ2j<ε
µ1;µ2<ε or
µ1;µ2>ε Table 2.Typical equivalence regions in bioequivalence
studies.
δ Equivalence(2 sided)region Equivalence(1 sided)region
Hazard
ratio jλ1=λ2;1j<ε
λ1=λ2<ε or
λ1=λ2>;ε Difference
in means jπ1;π2j<ε π1
;π2<ε or
π1;π2>;ε Table 3.Typical equivalence regions in clinical
equivalence studies.
Examples of δ and corresponding equivalence
regions inbioequivalenceandclinical equiva-lencestudies are given in Table 2 and 3, respec-tively.
Confidence interval CIα(δ) provides a way to test if “δ lies in E”. A 100(1;α)% confidence interval CIα(δ)for a parameterδ is defined by
ProbfCIα(δ)containsδg>=1;α:
The width of the confidence CIα(δ)(for a given
δ)depends on the estimate of the standard error ofδ estimate(i.e., standard error of difference in means or of mean ratio)and the type of hypoth-esis being tested(1 or 2 sided). The estimate of the standard error, on the other hand, depends on the experimental design used, statistical model applied, estimation method, software, etc. There is a certain amount of controversy and misunderstanding around the issue of using 100(1; 2α)% vs. 100(1 ; α)% confidence interval for testing 2-sided equivalence hypoth-esis at the level α (see e.g., 1]). These and other issues most relevant to this research topic will be covered in the following paragraphs. In this paper we will be focused on the issues re-lated to bioequivalence studies only(although most of it also applies to clinical equivalence studies).
3. Bioequivalence Testing
Hypotheses that specify only that the popula-tion means should be “close” are called average bioequivalence hypotheses. Hypotheses that state that the whole distribution of bioavailabil-ities is the same for the test and reference pop-ulations are called population bioequivalence hypotheses. Sometimes bioequivalence is de-fined in terms of parameters that more directly measure equivalence of response within an indi-vidual. This is called individual bioequivalence. Since the FDA currently requires that only the results of the average bioequivalence tests be submitted, in this paper we will not consider either individual or population bioequivalence tests.
As mentioned, methods for average bioequiva-lence are based on either the raw data model( un-transformed)or the log-transformed model, and are derived under the assumptions of normality or lognormality for between subject ( intersub-ject)and within subject(intrasubject) variabil-ities.
To claim bioequivalence in average bioavail-ability it is commonly required that the ratio of the two true formulation averages µT=µR be within (80%, 120%) limits (or the differ-ence µT ; µR be within 20% of µR, where
T = test formulation, R = reference
formu-lation). However, for the logarithmic trans-formation of pharmacokinetic responses, the FDA guidance requests that to claim average bioequivalence, the ratio of the two formula-tion averages on the original scale be within
(80%, 125%) limit (which corresponds to a symmetric interval around 0 in the log scale, i.e., log(:80) = ;log(1:25)). The FDA requires that the bioequivalence be concluded with 90% assurance. In pursuit of this goal, several meth-ods have been proposed in the past two decades. These methods include:
1) the confidence interval approach,
2) the method of interval hypothesis testing, 3) the bayesian approach, and
4) nonparametric methods.
In this paper, we will discuss the 3 most
com-mon(currently recommended by FDA, and
im-plemented in EquivEasy)methods: 1)the “clas-sical”(shortest)confidence interval forµT=µR,
2)Schuirmann’s two one sided tests(TOST,7],
8]), and 3)a nonparametric method.
It can be shown that the 90% confidence in-terval method is equivalent to carrying out two one sided tests at 5% significance level. Both of the methods will be discussed and imple-mented for the raw data model (additive) and then for the log-transformed data model( mul-tiplicative). However, some caution is advised with regard to selection of the appropriate test when the analysis is performed on raw data(see below).
In the next two paragraphs typical methods for the analysis of data coming from a crossover design will be briefly introduced. The analysis for data from a parallel design is easily found in standard statistical texts, and will not be dealt with here.
4. Raw Data Analysis
4.1. Confidence Interval Approach
If the analysis is performed in the original scale, then the “classic” confidence interval for the ra-tioµT=µR is obtained from the difference con-dition:
δL <µT ;µR<δU (1) using the standard t statistic for µT ;µR and converting it to the (1; 2α) 100% confi-dence interval for the ratioµT=µR by dividing the limits for the difference by the least squares estimate of the reference mean(assuming that the estimate is the true reference meanµR). Al-though intuitively appealing and regularly used, the “classical” procedure may not have the de-sired level of assurance required by the FDA in cases where there is a large coefficient of variation(CV)or a large intrasubject variability
4.2. TOST
Schuirmann’s(7],8])proposed two one-sided
(TOST)procedure suggests taking the conclu-sion of average bioequivalence at theα level of significance if, and only if, both H01 and H02 are rejected at a predetermined α level of sig-nificance:
H01: µT;µR δL H02: µT;µR δU Ha1 : µT;µR >δL Ha2: µT;µR <δU
The tests are performed using two one-sidedt
tests as follows:
TL =(D;δL)=SE(D)>tαr (2) TU=(D;δU)=SE(D)<;tαr (3)
where tα r is the upper 100α percentile of t-distribution with r degrees of freedom, D is the estimated difference between test and reference means, and SE(D) is the standard error of the difference.
5. Log-transformed Data Analysis
There are several reasons or rationales for ap-plying log transformation to AUC and CMAX data. They are labeled “Clinical”, “Pharma-cokinetic”, and “Statistical”. The statistical ra-tionale is that much of pharmacokinetic data is skewed in original scale and that it appears more lognormal than normal. Besides, by log trans-formation, the ratio condition in original scale changes into a difference condition in the log scale:
δL <µT=µR <δU =)
log(δL)<ηT;ηR <log(δU) (4)
where µi = exp(ηi + σ 2
=2), i=T,R and ηi,
σ are parameters of the lognormal distribution. Here we assume that the log transformed data are distributed according to the normal distribu-tion with meansµT,µRand a common variance
σ2
(i.e., that the original data are distributed ac-cording to lognormal distribution with param-eters ηi and δ). As mentioned earlier, recom-mended limits for logged data are δL = :80 and δU = 1:25, which yield symmetric limits log(:80) = ;:223 and log(1:25) = :223, re-spectfully, in log scale.
5.1. Confidence Interval Approach
The confidence interval approach in the case of logged data is straightforward:
CI =D;tαrSE(D),D+tα rSE(D)] (6) where tαr is the upper 100α percentile of t -distribution with r degrees of freedom, D is the estimated difference between test and reference means, and SE(D) is the standard error of the difference. The interval for the ratio of means in the original scale is obtained by exponentiating the interval limits(6).
5.2. TOST
In the case of log transformed data, TOST tests the following two hypotheses:
H01: ηT;ηRlog(δL) H02: ηT;ηRlog(δU) Ha1 : ηT;ηR>log(δL) Ha2 : ηT;ηR<log(δU):
The tests are performed by comparing TL and TUto the percentiles of the t-distribution as fol-lows:
TL =(D;log(δL))=SE(D)>tαr (7) TU=(D;log(δU))=SE(D)<;tαr:
(8)
It can be shown that the 100(1;2α)(and not the 100(1;α)confidence interval approach is operationally identical to TOST performed atα
level.
The width of the confidence interval (and the decision from TOST) depend on (given fixed
δL,δUand the selected bioequivalence method) the estimate of the difference between two drug means and its standard error. This estimate, on the other hand, depends on a number of other things such as:
experimental design(e.g., crossover vs. par-allel)
treatment of effects(fixed vs. random)
effects included in model(e.g., with or with-out carryover effects)
modeling covariance structure (e.g., differ-ent variances)
estimation method(software, procedure, etc.)
5.3. Nonparametric Test
Statistical methods for assessment of bioequiv-alence are developed under the following as-sumptions:
Sik (the effect of the ith subject in the kth se-quence)are iid normal with mean 0 and variance
σ2
s (“intersubject” variability),
eijk (the (within subject)random error) are iid normal with mean 0 and variancesσ2
e ( “intra-subject” variability), and
Sikand eijk are mutually independent.
It is important to check these assumptions, and several approaches based on examining inter-and intrasubject residuals have been suggested in the literature. However, they are not rigor-ous statistical tests for normality and should be used with caution due to the small number of subjects usually used in bioequivalence studies
(see9]).
If normality (or lognormality) is seriously vi-olated, TOST (even for log transformed data) is no longer justified. Application EquivEasy uses a distribution-free approach proposed by Hauschke D., Steinijans VW, and Diletti E.6]. The advantage of this approach is its applicabil-ity even in the case of unequal period effects. The procedure proposed in6]uses Mann- Whit-ney-Wilcoxon tests and the corresponding distri-bution-free 100(1;2α)% confidence interval, and the Hodges-Lehman estimator (as a point estimator for the logged ratio of means). The approach is specially appealing because it yields results in the form of 100(1;2α)% confidence intervals(as with parametric approach), which are then easily compared to the pre-specified
(bio)equivalence range (see Table 5 in para-graph 6 for an example of the results generated by the nonparametric option in EquivEasy).
6. EquivEasy Application
Although SAS GLM and MIXED procedures can be used for “standard” bioequivalence
test-ing(e.g., 90% confidence intervals and TOST), their use is not straightforward because the tests results have to be calculated(using appropriate formulas)from SAS procedures outputs. Also, it is usually necessary to first examine the results from the model with carryover effects(in case of crossover design), and then (in the absence of significant carryover effects)from the model without carryover effects. Furthermore, report-ing on bioequivalence studies require that some standard tables, figures and listings(TFL)(e.g., means, CV, ratios, estimates of inter- and intra-subject variability, etc.) be supplied in addition to the bioequivalence test(s)results. These usu-ally require that appropriate manipulations and transformations be applied to the data before TFLs are made.
The purpose of EquivEasy application is:
to raise the likelihood of proper reporting on bioequivalence studies (for data from 2 treatments, 2 periods crossover design and 3x3 crossover(Williams)design):
to minimize the errors in report preparation
(increased quality),
to minimize the maximum time required for
studies(increased efficiency),
to reduce the need for in-house SAS
exper-tise(i.e., so as to simplify use, and to reduce training costs),
to maximize the uniformity of reporting( stan-dardization), and
to minimize additional validation costs by
using pre-validated SAS Institute software procedures wherever possible.
Using the application is straightforward: appro-priate selections(such as location of the data, re-sponse variable name, level names, log/original
scale, GLM/ MIXED /nonparametric
proce-dure, with/without carryover effects, limits,
output format: MS Word/HTML/ PDF, etc.)
have to be supplied(as shown in Figure 1)prior to pushing the “OK” button, which then creates typical output(tables and graphs)in the selected format.
Data for the first example (3 3 crossover
Fig. 1.EquivEasy Application frame.
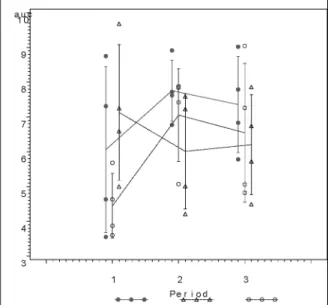
Fig. 2.“Treatment means by period” plot.
effects, original scale, and (0.80,1.20) bioe-quivalence limits in the EquivEasy Application frame. The output was requested in .rtf (MS Word)format. The key results, a graph of
treat-ment means by periods, and a table with 90% confidence intervals and TOST are shown in Figure 2 and Table 4, respectively. It can be shown that the application yields results iden-tical to the results given in the original Table 10.3.16. in 3] (n.b., original table contains two clerical errors). Incidentally, the results
(both the 90% confidence interval approach and TOST)show that equivalence with the reference treatment(R)can be concluded only for treat-ment B.
The second example (2 2 crossover design)
is also based on data from 3] (Table 3.6.1.). The nonparametric procedure, log scale, and the usual (.80, 1.25) bioequivalence range for the logged data were selected to analyze the second data set. The results for the 90%(HSD) confidence interval based on Mann-Whitney-Wilcoxon test, a Hodges-Lehman(HSD)point estimate, and an exact confidence coefficient are given in Table 5. The stated bioequivalence limits (0.90, 1.25) encompass the 90% HSD confidence interval (0.94, 1.18). Hence, it is concluded that the two treatments are equiva-lent.
Table 5.Nonparametric test results.
7. Summary
Equivalence testing need not consume exces-sive researcher time and company resources. Although not simple, the testing procedure can be made much easier with the aid of “expert
system” software application assistance. The EquivEasy application (created using SAS In-stitute software)makes equivalence testing both faster and easier for the pharmaceutical research professional.
References
1] BERGER RL, HSU JC. Bioequivalence trials,
Intersection-Union Tests and Equivalence Confi-dence Sets (with discussion). Statistical Science
1996; 11(4), 283–319.
2] CHEN, ML. Individual bioequivalence – a regulatory
update.J. Biopharm. Stat.1997; 7: 5–11.
3] CHOW, S-C, LIU J-P. Design and Analysis of Bioavailability and Bioequivalence Studies. New York: Marcel Dekker, Inc.; Second Edition; 2000.
4] EFRON, B. The Jackknife, Bootstrap and Other Resampling Plans.SIAM, Philadelphia; 1982.
5] FIELLER, E. Some problems in interval estimation. J. R. Stat. Soc.B 1954; 16: 175–185.
6] HAUSCHKE D., STEINIJANS VW., DILETTI E. A
distribution-free procedure for the statistical analy-sis of bioequivalence studies.Int. J. Of Clin. Pharm., Therapy and Toxic., 1990; 28(2): 72–78.
7] SCHUIRMANN, DJ. On hypothesis testing to
de-termine if the mean of a normal distribution is contained in a known interval.Biometrics1981; 37: 617.
8] SCHUIRMANN, DJ. A comparison of the two
one-sided tests procedure and the power approach for assessing the equivalence of average bioavailability.
J. Pharmacokin. Biopharm.1987; 15: 657–680.
9] SHAPIRO, SS., WILKMB. An analysis of variance
test for normality(complete samples).Biometrika
1965; 52: 591–611.
10] Statistical Solutions Ltd., Ireland. EquivTest. http://www.statsol.ie/equivtest/ equivtest.html3/30/2002].
11] US Food and Drug Administration(FDA).
Guid-ance on Statistical Procedures for Bioequivalence Using a Standard Two-treatment Crossover De-sign. Division of Bioequivalence, Office of Generic Drugs, Center for Drug Evaluation and research, US Food and Drug Administration, Rockville, MD.; 1992.
Received:June, 2002
Accepted:September, 2002
Contact address:
Vesna Luˇzar-Stiffler University Computing Centre and CAIR Research Center Zagreb, Croatia e-mail:[email protected]
Charles Stiffler CAIR Research Center Zagreb, Croatia e-mail:c|harles.stiffler@cair-ce nter .hr
VESNALUˇZAR-STIFFLERis a senior researcher at the University Com-puting Centre, University of Zagreb and the Director of Statistical Meth-ods at CAIR Research Center in Zagreb, Croatia. She obtained her B.Sc. in mathematics, her Ph.D. in computer science/computational statistics
at the University of Zagreb, and was awarded a Fulbright Postdoctoral Grant for research at the Department of Statistics, Stanford Univer-sity, specializing in computational statistics and multivariate analysis. Her teaching experience includes statistical courses at the University of Zagreb, Stanford University, University of Maryland, University of Naples, SAS Institute and various companies in Central and Eastern Europe. She has consulted in the area of statistical/graphical
applica-tions, data mining, marketing research, and SAS business intelligence software support with various companies(including pharmaceutical,
aeronautic, automotive, semiconductor manufacturing technology, in-surance, FMCG retail, beverage, telecommunications)and is currently
involved with a variety of companies and government organizations in the US, Italy, Croatia, Slovenia, Macedonia, Romania, etc.
CHARLESSTIFFLERobtained his MBA in 1980 at San Diego State Uni-versity, specializing in consumer psychology and market research, and his doctorate(Ph.D.)in business and administration from the
Univer-sity of Colorado, Boulder in 1985, specializing in market research and business strategy. He taught at the University of Colorado, Boulder until 1987, where over a 7 year period he completed 120+market
re-search projects. He has consulted in industry, taught in the area of entrepreneurship and was owner/director of a research firm(
Environ-mental Marketing Inc.) during the late 80’s. From 1990 until 1995