Spatio-Temporal Outlier Detection
in Large Databases
Derya Birant, Alp Kut
Dokuz Eylul University, Department of Computer Engineering, Izmir, Turkey
Outlier detection is one of the major data mining meth-ods. This paper proposes a three-step approach to detect spatio-temporal outliers in large databases. These steps are clustering, checking spatial neighbors, and checking temporal neighbors. In this paper, we introduce a new outlier detection algorithm to find small groups of data objects that are exceptional when compared with the remaining large amount of data. In contrast to the existing outlier detection algorithms, the new algorithm has the ability of discovering outliers according to the non-spatial, spatial and temporal values of the objects. In order to demonstrate the new algorithm, this paper also presents an example of application using a data warehouse.
Keywords: outlier detection, data mining, spatio-temporal data, data warehouse.
1. Introduction
Spatio-temporal databases are growing very rapidly, both in size and in number. This condi-tion results in an increasing need for knowl-edge discovery in spatio-temporal databases. Most studies in KDD(Knowledge Discovery in Databases) focus on finding the common pat-terns. However, finding the outliers(rare events or exceptional cases) may be more interesting and useful than finding the common patterns.
Outliers can be defined as observations which appear to be inconsistent with the remainder of the dataset. They deviate too much from other observations. Outlier detection is a data mining technique like classification, clustering, and association rules. A Spatial Outlier ( S-Outlier)is an object whose non-spatial attribute value is significantly different from the values of its spatial neighbors. Recently, a few stud-ies have been conducted on spatial outlier de-tection for large datasets. [4][16][19]However,
most of these studies don’t consider temporal aspects. Temporal outlier detection should also be considered in many applications such as geo-graphic phenomena-based applications. A Tem-poral Outlier (T-Outlier) is an object whose non-spatial attribute value is significantly dif-ferent from those of other objects in its temporal neighborhood. The studies [1][2] focus on the representation of a time location which deviates too much from its temporal neighbors.
This paper combines S-Outlier and T-Outlier definitions to define aSpatio-Temporal Outlier
(ST-Outlier)to be an object whose non-spatial attribute value is significantly different from those of other objects in its spatial and tem-poral neighborhoods. For many applications, identification of ST-Outliers can lead to the dis-covery of unexpected, interesting, and implicit knowledge.
This paper focuses on the question how ST-Outliers can be detected. It presents a new out-lier detection algorithm which is based on the DBSCAN clustering algorithm since clustering is a basic method for spatial outlier detection. From the viewpoint of a clustering algorithm, outliers are objects not located in any cluster. Furthermore, if a cluster is significantly differ-ent from other clusters, the objects in this cluster might be potential S-Outliers.
The algorithm proposed in this study first iden-tifies S-Outliers and then T-Outliers. However, the identification of first T-Outliers and then S-Outliers yields the same result. So ST-S-Outliers and TS-Outliers are identical.
our algorithm to detect ST-Outliers. Section 4 presents performance evaluation of the algo-rithm. Section 5 shows the sensitivity analyses of the parameters of the algorithm. Using a real-world dataset, Section 6 presents an application to demonstrate our solution and shows the data mining results. Finally, the conclusion is given in Section 7.
2. Outlier Detection Approaches
The existing approaches to outlier detection can be classified into five categories: distribution-based, clustering-based,depth-based, distance-based, anddensity-based[14][16].
Distribution-basedapproaches use standard sta-tistical distribution. They deploy some standard distribution model(e.g. Normal, Poisson, etc.) and recognize as outliers those points which de-viate from the model. [3] However, for many KDD applications, the underlying distribution is unknown. Often a large number of tests are required in order to decide which distri-bution model fits the arbitrary dataset best, if any. Fitting the data with standard distributions is costly, and may not produce satisfactory re-sults.
Clustering-based approaches detect outliers as by-products [10]. Some clustering algorithms such as CLARANS[15], DBSCAN[5][6], CURE [7] have the capability of handling exceptions. However, since the main objective of the clus-tering algorithms is to discover clusters, they are not developed to optimize outlier detection.
Depth-based approaches are based on compu-tational geometry and compute different layers of k-d convex hulls. [11][17]Outliers are more likely to be data objects with smaller depths. However, in practice, this technique becomes inefficient for large datasets (k ≥ 4). Depth-based approach is also applied for spatial outlier detection. [2]
Distance-based methods use a distance metric to measure the distances among the data points. [12][13]Problems may occur if the parameters of the data are very different from each other in different regions of the data set.
Density-based approach was proposed by M. Breunig, et al. [4]. This method assigns a Lo-cal Outlier Factor (LOF)to each sample based
on their local neighborhood density. Samples with high LOF value are identified as outliers. The neighborhood is defined by using MinPts
parameter.
One drawback of the existing methods is that they don’t consider temporal aspects. In this paper, we propose a ST-Outlier detection rithm to overcome this disadvantage. Our algo-rithm combines the advantages of the clustering-based and density-clustering-based approaches.
3. ST-Outlier Detection Algorithm
In our algorithm, a three-step approach is pro-posed to identify the spatio-temporal outliers. These steps are: clustering, checking spatial neighbors, and checking temporal neighbors.
3.1. Clustering
Clustering is a basic method to detect potential S-Outliers. From the viewpoint of a cluster-ing algorithm, potential outliers are objects not located in any cluster. Furthermore, if a clus-ter is significantly different from other clusclus-ters, the objects in this cluster might be potential S-Outliers.
DBSCAN clustering algorithm needs two input parameters to define the notion of density: Eps
and MinPts. The input parameter Eps is a ra-dius value and it is based on a distance metric such as Manhattan, Euclidean etc. The second input parameterMinPtsspecifies the minimum number of points that should occur withinEps
radius. While DBSCAN algorithm needs two inputs, our algorithm requires four input pa-rameters: Eps1, Eps2,MinPts, and Δε. While
Eps1 is the distance parameter for spatial at-tributes,Eps2is the distance parameter for non-spatial attributes. MinPtsis the minimum num-ber of points withinEps1andEps2distance of a point. If a region is dense, then it should contain more points thanMinPtsvalue. In[5], a simple heuristic is presented to determine the param-eters Eps and MinPts. The last parameter Δε
is used to prevent the discovering of combined clusters if there are few differences in the values of neighbor locations.
In order to discuss whether a set of points is
similar enough to be considered a cluster, we need a distance measure Dist(i, j) which tells how far points i and j are. The most common distance measures are Manhattan, Euclidean, and Minkowski distance. In our algorithm, Eu-clidian formula is used two times to calculate two different distance metrics: Eps1 (for spa-tial values) and Eps2 (for non-spatial values). Euclidean distance is defined as follows:
Dist(i,j)=|xi1−xj1|2+|xi2−xj2|2+. . .+|xin−xjn|2
(1) where i=(xi1, xi2,..., xin)and j=(xj1, xj2,..., xjn)
are two n-dimensional data objects.
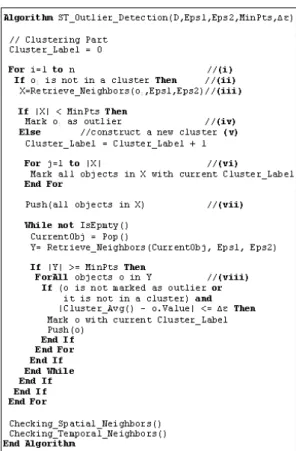
As shown in Figure 1, the algorithm starts with the first point in database D. After processing this point, it selects the next point inD(i). If the selected object doesn’t belong to any cluster(ii),
Retrieve Neighbors function is called (iii). A call ofRetrieve Neighbors(object, Eps1, Eps2)
returns the objects that have a distance less than Eps1 and Eps2 parameters to the selected object. If the total number of returned points is smaller thanMinPtsinput, the object is assigned as out-lier (iv). The points which have been marked as outliers may be changed later. This happens for border points of a cluster.
Fig. 1.ST-Outlier Detection Algorithm.
If the selected point has enough neighbors within
Eps1andEps2distances, then a new cluster is constructed(v). Then all neighbors withinEps1
andEps2radiuses of this object are also marked with new cluster label(vi). Then the algorithm iteratively collects all reachable objects from neighbors by using a stack(vii). If the object is not marked as outlier, or it is not in a cluster, and the difference between the average value of the cluster and the new coming value is smaller than
Δε, it is placed into the current cluster(viii). After processing the selected point, the algo-rithm selects the next point inDand algorithm continues iteratively until all of the points have been processed. Checking spatial neighbors
andchecking temporal neighborsfunctions are described in sections 3.2 and 3.3.
If two clustersC1andC2are very close to each
other and a point pis the border point of both
C1andC2, then the algorithm assigns pointpto
the cluster discovered first.
3.2. Checking Spatial Neighbors
From the viewpoint of a clustering algorithm, potential outliers are objects not located in any cluster. In the previous step, potential outliers were detected when the data was clustering. In this step, these potential outliers are checked to verify whether these objects are actually S-Outliers or not. During the verification, the background knowledge (the characteristic) of the data is required. If no prior-knowledge about the data is available, some methods such as neural network can be applied to handle it. Furthermore, if a cluster is significantly differ-ent from other clusters, the objects in this cluster might be S-Outliers. Thus this step also checks all clusters identified in the previous step to de-cide whether the cluster is S-Outlier or not. The formula used to verify S-Outliers is defined in definition 1.
Definition 1. Given a database ofndata objects
D = {o1,o2, . . . ,on}. Assume that the object
o is detected as potential outlier in clustering. The average value of the spatial neighbors ofo
withinEps1radius is defined as
Adef= oneigh.1+oneigh.2m+. . .+oneigh.m (2)
where mis the number of spatial neighbors of
owithinEps1radius and the standard deviation for the objectois defined asσ =√V, where
Vdef= (oneigh1−A)2+ (oneigh2−mA)2+. . .+ (oneigh m−A)2. (3)
The objectois classified as an S-Outlier if it is outside the interval[L,U] (i.e., if eithero<Lor
o>U), whereLdef= A−k0·σ,Udef= A+k0·σ,
and k0>1 is some pre-selected value.
3.3. Checking Temporal Neighbors
This step checks the temporal neighbors of the S-Outliers identified in the previous step. Two objects are temporal neighbors if the values of
these objects are observed in consecutive time units such as consecutive days in the same year or in the same day in consecutive years. During the application of the algorithm, a tree is tra-versed to find the temporal neighbor objects of any object.
In order to support temporal aspects, S-Outliers are compared to other objects of the same lo-cal area, but in different times. In comparison operation, spatio-temporal data is first filtered by retaining only the temporal neighbors and their corresponding values. If the characteristic value of an S-Outlier does not have significant differences from its temporal neighbors, this is not an ST-Outlier. Otherwise, it is confirmed as an ST-Outlier. The formula used to detect ST-Outliers is similar to formula defined in def-inition 1. In this case temporal neighbors are checked instead of spatial neighbors.
4. Performance Evaluation
The average runtime complexity of the DB-SCAN algorithm is O(n*logn), where n is the number of objects in the database. DBSCAN has been proven in its ability of processing very large datasets[5][6]. The algorithm yields sig-nificant speed-up factors, even for large num-bers of data in the database. The paper[6]shows that the runtime of other clustering algorithms such as CLARANS[15], DBCLASD[20]is be-tween 1.5 and 3 times the runtime of DBSCAN. This factor increases with increasing size of the database. Our modifications do not change the runtime complexity of the algorithm.
During the application of the algorithm, this tree is traversed to find the spatial or temporal neighbor objects of any object.
In addition to spatial index structure, some fil-ters should also be used to reduce the search space for spatial data mining algorithms. These filters allow the operations on neighborhood paths by reducing the number of paths actu-ally created. They are necessary to speed up the processing of queries.
5. Sensitivity Analyses of the Parameters
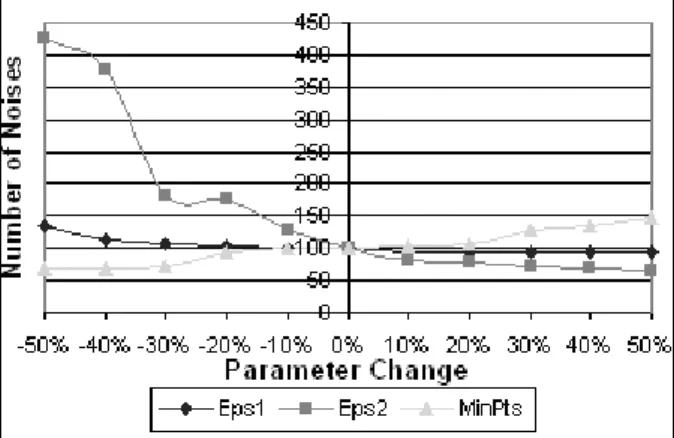
Sensitivity analysis is used to determine how a given algorithm output depends upon the input parameters. Most sensitivity analyses involve changing one parameter at a time. A sensitiv-ity analysis was conducted by changing each parameter value by +/−10%. According to the heuristic defined in [5], the input parame-ters should be assigned asEps1=1,Eps2=0.25, andMinPts=15. Figure 2 shows the sensitivity of our algorithm to the Eps1,Eps2andMinPts
parameters with respect to the number of noise points.
Fig. 2.The sensitivity analyses results.
According to the results of the tests, even where there is a huge variation ofEps1parameter, there is a little influence on the results. The number of noise points continuously increases when the value of Eps1parameter decreases. But, there is no change in the number of noise points when the value ofEps1parameter increases. SoEps1
parameter has little influence on the algorithm output. The results show thatEps2parameter is the most sensitive parameter. Decreasing in the
value of the Eps2 parameter greatly increases the number of noise points. The output of the algorithm is very much depending on the relia-bility of this parameter. The results also show that the output of the algorithm is little sensitive to changes in theMinPtsparameter values.
6. Application
This section demonstrates how our algorithm detects ST-Outliers by using a real-world dataset. The purpose of the application is to detect rare events and exceptional cases related with sea waves in years between 1992 and 2002.
6.1. Dataset
We designed a spatio-temporal data warehouse which contained wave height values of four seas: the Black Sea, the Marmara Sea, the Aegean Sea, and the east of the Mediterranean Sea. These seas surround Turkey from the north, west, and south. The geographical coor-dinates of our work area are 30◦to 47.5◦north latitude and 17.0◦to 42.5◦east longitude.
Dataset has been provided from Topex/ Posei-don Satellite[21]. Topex/Poseidon data are re-leased by NASA and CNES. Wave heights are measured in meters. Dataset has approximately six million rows of record. It has the following columns: StationID, RegionID, Year, Month, Day of the record, Latitude of the station, Longi-tude of the station, WaveHeight value, and Clus-terID. Whereas the column, StationID, identi-fies the geographic location of monitoring sta-tion, RegionID identifies the name of the sea, Cluster ID identifies a particular cluster of sta-tions.
6.2. Implementation Details and Results
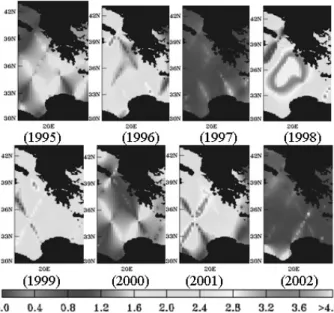
The region which is circled in dashed lines in Figure 3 had significantly high wave height val-ues on January 24, 1998. The approximate wave height value in this region is 6 meters. So it con-tains S-Outliers. Third, we checked the tempo-ral neighbors. We compared the wave height values of S-Outliers with other data points of the same location, but in different times. Fig-ure 4 shows the wave height values of the same region in different years. We detected that the region circled in dashed lines in Figure 3 had extreme wave height values in 1998. But, in other years, wave height values of this region were not too high. For this reason, the objects in this region are confirmed as ST-Outliers.
Fig. 3.The region circled in dashed lines contains S-Outliers(January 24, 1998).
Fig. 4. The wave height values of the same region on the same day, but in different years.
7. Conclusions
This paper proposes a three-step approach to de-tect spatio-temporal outliers in large databases. These steps are clustering, checking spatial neigh-bors to identify spatial outliers, and checking temporal neighbors to identify spatio-temporal outliers. The paper introduces a new outlier detection algorithm. According to the perfor-mance tests of the algorithm, it has the ability of processing very large datasets. According to the results of the sensitivity analysis of the input parameters,Eps2parameter is the most sensitive parameter. The example presented in Section 6 demonstrates that our algorithm appears to be very promising when spatio-temporal outliers need to be detected.
References
[1] T. ABRAHAM, J. F. RODDICK, Survey of
Spatio-Temporal Databases, GeoInformatica (Springer)
1999; 3(1), pp. 61–99.
[2] N. R. ADAM, V. P. JANEJA, V. ATLURI,
Neighbourhood-Based Detection of Anomalies in High Dimension Spatio-Temporal Sensor Datasets,
ACM Symposium on Applied Computing, Nicosia Cyprus; 2004. pp. 576–583.
[3] V. BARNETT, T. LEWIS,Outliers in Statistical Data,
New York: John Wiley; 1994.
[4] M. M. BREUNIG, H-P. KRIEGEL, R. NG, J. SANDER,
LOF: Identifying Density-Based Local Outliers,
ACM SIGMOD Int. Conf. on Management of Data, Dallas, TX; 2000, pp. 93–104.
[5] M. ESTER, H-P. KRIEGEL, J. SANDER, X. XU, A
Density-Based Algorithm for Discovering Clusters in Large Spatial Databases with Noise, In: Pro-ceedings of the 2nd Int. Conference on Knowledge
Discovery and Data Mining, Portland, OR; 1996.
[6] M. ESTER, H-P. KRIEGEL, J. SANDER, X. XU,
Clus-tering for Mining in Large Spatial Databases, KI-Journal (Artificial Intelligence), Special Issue on Data Mining 1998; 12(1), pp. 18–24.
[7] S. GUHA, R. RASTOGI, K. SHIM, CURE: An
Effi-cient Clustering Algorithms for Large Databases, In:Proc. ACM SIGMOD Int. Conf. on Management of Data, Seattle, WA; 1998. pp. 73–84.
[8] A. GUTTMAN, R-trees: A Dynamic Index Structure
[9] R. H. GUTING, An Introduction to Spatial Database
System, it VLDB Journal, 1994; 3(4), pp. 357–399.
[10] A. JAIN, M. MURTY, P. FLYNN, Data Clustering: A Review,ACM Computing Surveys, 1999, 31(3), pp. 264–323.
[11] T. JOHNSON, I. KWOK, R. NG, Fast Computation of
2-Dimensional Depth Contours, In: Proc. 4th. Int. Conf. on KDD, New York, NY, 1998, pp. 224–228.
[12] E. M. KNORR, R. T. NG, Algorithms for Mining
Distance-Based Outliers in Large Datasets, In:
Proc. 24th Int. Conf. Very Large Data Bases, New York, NY; 1998, pp. 392–403.
[13] E. M. KNORR, R. T. NG, V. TUCAKOV, Distance-Based Outliers: Algorithms and Applications, Jour-nal: Very Large Data Bases, 2000, 8 (3-4), pp. 237–253.
[14] L. KOVACS´ , D. VASS, A. VIDACS´ , Improving Quality
of Service Parameter Prediction with Preliminary Outlier Detection and Elimination, In: Proc. 2nd Int. Workshop on Inter-Domain Performance and Simulation, Budapest, Hungary, 2004, pp. 194–199.
[15] R. T. NG, J. HAN, Efficient and Effective Clustering Methods for Spatial Data Mining, In:Proc. 20thInt.
Conf. on Very Large Data Bases, Santiago, Chile, 1994, pp. 144–155.
[16] S. PAPADIMITRIOU, C. FALOUTSOS, Cross-Outlier
Detection, In: Proc. 8th International Symposium on Spatial and Temporal Databases, Greece, 2003, pp. 199–213.
[17] I. RUTS, P. ROUSSEEUW, Computing Depth Contours
of Bivariate Point Clouds,Journal of Computational Statistics and Data Analysis, 1996, 23(1996), pp. 153–168.
[18] H. SAMET,The Design and Analysis of Spatial Data
Structures, MA, Addison-Wesley, 1990.
[19] S. SHEKHAR, C-T. LU, P. ZHANG, A Unified
Ap-proach to Detecting Spatial Outliers, GeoInformat-ica, Kluwer Academic Publishers 2003, 7(2), pp. 139–166.
[20] X. XU, M. ESTER, H-P. KRIEGEL, J. SANDER, A
Distribution-Based Clustering Algorithm for Min-ing in Large Spatial Databases, In: Proceedings of IEEE International Conference on Data Engineer-ing, Orlando, Florida, 1998. pp. 324–331.
[21] Topex/Poseidon Satellite Description
http://podaac.jpl.nasa.gov/woce/[15/09/2005]
Received:June, 2006
Accepted:September, 2006
Contact addresses:
Derya Birant Dokuz Eylul University Department of Computer Engineering 35100, Izmir Turkey
Alp Kut Dokuz Eylul University Department of Computer Engineering 35100, Izmir Turkey
DERYABIRANTreceived her PhD in computer engineering from Dokuz Eylul University in 2006. Currently, she is a research assistant at the De-partment of Computer Engineering, Dokuz Eylul University in Turkey. Her research interests include data mining in large databases, data ware-housing, parallel computing, web systems modeling and engineering.