http://www.sciencepublishinggroup.com/j/ajhr doi: 10.11648/j.ajhr.20170502.14
ISSN: 2330-8788 (Print); ISSN: 2330-8796 (Online)
Expression of Transforming Growth Factorα and Epidermal
Growth Factor Receptor in Thyroid Carcinoma
Tahani Abduljabbar Nasser
1, *, Kareem Hamed Ghali
1, Hameed Naeem Mousa
21Department of Biology, College of Science, Wasit University, Wasit, Iraq 2
Department of Pathology and Forensic Medicine, College of Medicine, Thi Qar University, Thi Qar, Iraq
Email address:
lovingsoul934@gmail.com (T. A. Nasser)
*Corresponding author
To cite this article:
Tahani Abduljabbar Nasser, Kareem Hamed Ghali, Hameed Naeem Mousa. Expression of Transforming Growth Factorα and Epidermal Growth Factor Receptor in Thyroid Carcinoma. American Journal of Health Research. Vol. 5, No. 2, 2017, pp. 44-49.
doi: 10.11648/j.ajhr.20170502.14
Received: January 17, 2017; Accepted: February 18, 2017; Published: March 9, 2017
Abstract:
The current study was performed on 178 paraffin embedded tissue specimens, included 111 of them were affected by thyroid carcinoma, 46 were benign neoplastic and 21individuals as control group. The study was carried out in Laboratory of College of Science, University of Wasit in collaboration with AL-Hussein Teaching Hospital and Ibn al-Bitar Laboratory Specialist in Thi Qar Province, IRAQ, from October 2015 to April 2016. Immunohistochemical technique was used to determination the expression of TGFα and its receptor EGFR in thyroid carcinoma in comparison with benign thyroid disease and control group. The aim of this study is to detect, quantify and analyze the clinicopathological correlation of those genes in patients with thyroid carcinoma. The results showed a significant increase of TGFα in thyroid patients comparing with control group and benign neoplasms, and between control group and benign neoplasms (p<0.05). On the other hand, the positive expression of EGFR was increased but did not reach to significantly difference in thyroid carcinoma in comparison with neither benign neoplasms nor control group (p>0.05). Our results concluded that there is a strong relationship between TGFα overexpression with thyroid carcinogenesis.Keywords:
Thyroid Cancer, TGFα, EGFR and Immunohistochemistry1. Introduction
Thyroid carcinoma is the most widespread type among endocrine malignancy [1]. This cancer occurs in the thyroid gland, which it is importantly endocrine glands located at the lower part of the larynx, and responsible for the production of hormones that regulate the control: heart rate, blood pressure, body temperature, and basal metabolic rate [2]. The occurrence of Thyroid cancer has increased significantly around the world over the last few decades [3]. Which it is the fifth more commonly malignant tumor at women [4]. And risk factors of thyroid cancer are very high in Arab countries [5]. In Saudi Arabia, thyroid carcinoma was occupied the second ranked in females [6]. While in Iraq it was occupies the 11th ranked among females [7]. Thyroid carcinoma is more widespread in females at a rate of three times more
apoptosis and cell survival [14]. The EGFR have sites allows it to attaching to other proteins, called ligands, in the outside of the cell and to receive signals that help the cell respond to the surrounding environment, and suitable together such as to locks and keys [15]. EGFR is activated by binding of its own ligands, including epidermal growth factor (EGF) and transforming growth factor alpha (TGFα), this kinase triggers diversely downstream signaling pathways and results in various biological responses, such as proliferation and differentiation [16]. Transforming growth factor alpha (TGF-α): is a protein contain of 50 amino-acids polypeptide, the cytogenetic location of human TGF-α gene is: 2p13.3, which is the short (p) arm of chromosome 2. at position 13.3 [17]. TGF-α becomes effective when it is linked to receptors capable of protein kinase effectively of cellular signaling [18]. TGF-α is a ligand for the EGF receptor, and because TGF-α is a member of the receptor tyrosine kinase family, so this gives them the similarity biological structural about 30%, therefore TGF-α and EGF are linked to the same receptor [19]. Loss of regulation of the TGF-alpha and its receptor EGFR could lead to many human diseases, most notably cancer [20]. In the recent period, the increased of thyroid cancer was affected by numerous factors such as genetic changes, growth agents, and physical factors such as radiation, so there are needed to helpful forecast factors to detect the biologic behavior, providing an initial help [21]. A large number of biomarkers have been used in differential diagnosis of thyroid cancer, which include: TGF-α, and EGFR have been translated in clinical applications that led to the emergence of a significant improvement in the preoperative diagnosis of thyroid cancer [22].
2. Materials and Methods
2.1. Patients and Tissue Samples
The study was conducted in the laboratories of College of Science, University of Wasit and in collaboration with AL-Hussein Teaching Hospital, Thi Qar Province and Ibn Al-Bitar National Laboratory in Thi Qar Province for the period from October 2015 to April 2016. One hundred and seventy-eight patients with diseases of the thyroid gland are collected randomly, which included three groups of thyroid gland diseases, first group was thyroid carcinoma 111 (62.36%) patient's, second group benign tumor account 46 (25.84%) patient's and 21 (11.80%) other thyroid diseases (non-cancer and non- benign), the rate of the patient's age between 11 - 80 years. All patients were diagnosed and confirmed by specialized histopathlogistis. All clinical information about samples was taken. Histological samples were taken treated with formalin and embedded with paraffin wax postoperative.
2.2. Immunohistochemistry (IHC)
Immunohistochemistry technique was used in this study.
ABC staining system: sc-2017, TGFα: sc-374433 and EGFR: sc-373746 (mouse monoclonal antibodies) was provided by Santa Cruz Biotechnology, Inc.
Serial tissue sections were cut 4 - 5 µm thick and positioned on positive charged slides. The slides were backed in oven at 60°C overnight. The tissue sections were deparaffinized; then the slides were dehydrated by different ethanol concentration (100%, 95%, and 70%) and distal water. The slides were treated with citric buffer for 15. minute, and then washed in two changes of PBS solution for 5. minutes. Then slides were washed in distal water. The percentage of expression was calculated as 0 for negative, 1 for 1-25, 2 for 26-50, and 3 for 51-100 staining cells. Intensity was calculated as 1 (weak), 2 (moderate) and 3 (strong).
2.3. Ethical Consent
The study was submitted and approved by the College of Science, University of Wasit in collaboration with AL- Hussein Teaching Hospital and Ibn al-Bitar Laboratory Specialist in Thi Qar Province, Iraq.
2.4. Statistical Analysis
All the clinical, pathological, follow-up, expression data were computerized. Statistical analysis was performed using the SPSS for Windows (version 23.0). Fisher’s exact test, chi-square test or likelihood ratio was used for categorical variables. Statistical significance level of the tests was taken at a p-value <0.05.
3. Results
3.1. TGFα Expression and Intensity
The results of immunohistochemistry showed, that the expression of TGFα was positively in 76 (68.47%) of thyroid carcinoma patients out of 111 cases, while in benign 20 (43.48%) patients has appeared positive out of 46 cases, as for the control group; 4 (19.05%) cases are positive expression from 21 cases.
When thyroid carcinoma were compared with benign neoplasms showed there was highly significant differences between thyroid carcinoma patients and benign neoplasms to TGFα expression (P= 0.002) table 1, as well as when comparing thyroid carcinoma with control group table 2, the results showed that also there was highly significant difference between thyroid carcinoma patients and control group (P= 0.000). Also benign patients and control group cases had appeared a significant difference (P= 0.046) table 3.
TGF-α expression was: 26 (56.52%) cased were negative (score 0) and 20 (43.48%) cases were positive divided as follows: 3 (6.52%) cases were score +1, 15 (32.61%) cases were score +2 and 2 (4.35%) cases were score +3. In control group the intensity of TGF-α expression was: 17 (80.95%) cases were negative (score 0), while only 4 (19.05%) cases were positive and distributed as: score +1; 1 (4.76%) case, score +2; 3 (14.29%) cases, while no case in score +3 (Fig. 1).
When thyroid carcinoma were compared with benign neoplasms and with control group, there were no significant differences in relation to intensity of TGFα expression (P>0.05). As well as, in the case of TGFα expression intensity between benign neoplasms and control group, also no statistically significant differences were found (P>0.05).
Comparison of TGF expression intensity between thyroid carcinoma and benign patients and the control group are shown in Tables 1, 2 and 3
Figure 1. Representative slides of TGF-α staining by immunohistochemistry
in thyroid carcinoma, shows: (a) negatively staining (b) positively staining score +1 (c) positively staining score +2 (d) positively staining score +3. Magnification: 40X.
Table 1. TGFα expression and intensity in thyroid carcinoma compared with benign neoplasms.
Cases
TGFα Expression TGFα Intensity
Total No.%
-ve +ve 0 1+ 2+ 3+
No.% No.% No.% No.% No.% No.%
Thyroid carcinoma 35 76 35 19 43 14 111
31.53% 68.47% 31.53% 17.12% 38.74% 12.61% 100.0%
Benign neoplasms 26 20 26 3 15 2 46
56.52% 43.48% 56.52% 6.52% 32.61% 4.35% 100.0%
Total 61 96 61 22 58 16 157
38.85% 61.15% 38.85% 14.01% 36.94% 10.20% 100.0%
P. value highly significant non-significant
P= 0.002 P= 0.378
Table 2. TGFα expression and intensity in thyroid carcinoma compared with control group.
Cases
TGFα Expression TGFα Intensity
Total No.%
-ve +ve 0 1+ 2+ 3+
No.% No.% No.% No.% No.% No.%
Thyroid carcinoma 35 76 35 19 43 14 111
31.53% 68.47% 31.53% 17.12% 38.74% 12.61% 100.0%
Control group 17 4 17 1 3 0 21
80.95% 19.05% 80.95% 4.76% 14.29% 0.00% 100.0%
Total 52 80 52 20 46 14 132
39.39% 60.61% 39.39% 15.15% 34.85% 10.61% 100.0%
P. value highly significant non-significant
P= 0.000 P= 1.000
Table 3. TGFα expression and intensity in benign neoplasms and control group.
Cases
TGFα Expression TGFα Intensity
Total No.%
-ve +ve 0 1+ 2+ 3+
No.% No.% No.% No.% No.% No.%
Benign neoplasms 26 20 26 3 15 2 46
56.52% 43.48% 56.52% 6.52% 32.61% 4.35% 100.0%
Control group 17 4 17 1 3 0 21
80.95% 19.05% 80.95% 4.76% 14.29% 0.00% 100.0%
Total 43 24 43 4 18 2 67
64.18% 35.82% 64.18% 5.97% 26.87% 2.98% 100.0%
P. value significant non-significant
P= 0.046 P= 1.000
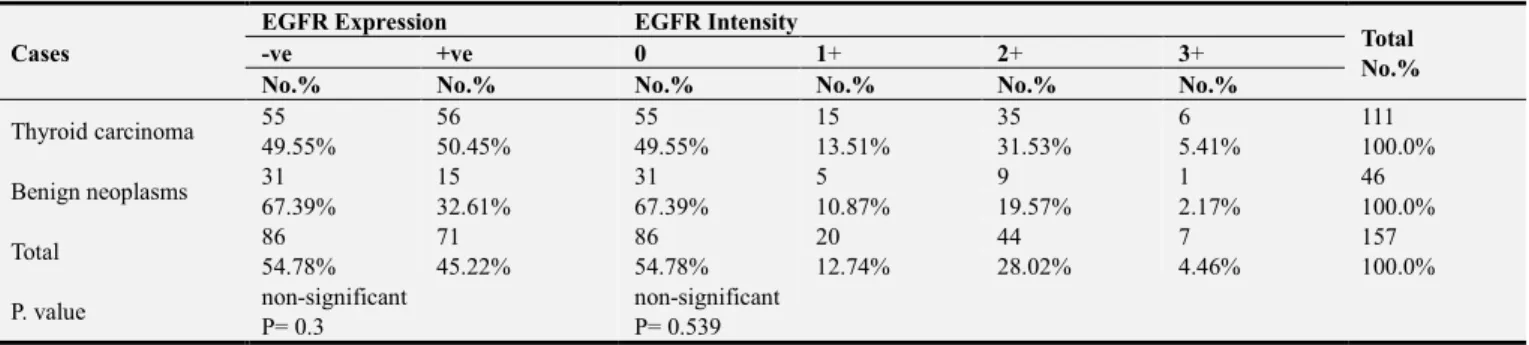
3.2. EGFR Expression and Intensity
The result of EGFR expression was demonstrated positive expression at 56 (50.45%) from 111 cases of thyroid
By comparing EGFR expression between thyroid carcinoma patients with benign patients and with control group, the results demonstrated there were no statistically significant differences (p> 0.05). Moreover, when comparing EGFR expression between benign neoplasms and control group, there was no significant difference (p> 0.05).
Regarding to intensity assessment of EGFR expression in thyroid carcinoma, the results were showed that: 55 (49.55%) cases were negative, score 0, 15 (13.51%) cases with score +1, 35 (31.53%) cases with score +2, and lowest percentage 6. (5.41%) cases were with score +3. As for intensity of benign were as follows: score 0; 31 (67.39%) cases, score +1; 5 (10.87%) cases, score +2; 9 (19.57%) cases, and only one case (2.17%) with score +3. In control group, 14 (66.67%) cases were score 0, 5 (23.81%) cases with score +1, 2 (9.52%) cases with score +2, and no case with score +3 (Fig. 2).
In relation to intensity of EGFR expression there were no statistically significant differences between thyroid carcinoma and benign patients (P>0.05), as well as, when the comparison between thyroid carcinoma and control group there were no significant differences (P>0.05), also is the situation between benign neoplasms and control group, no
statistical significance differences were found (P>0.05). Tables 4, 5 and 6 illustrate the comparison of EGFR expression and intensity between thyroid carcinoma and benign neoplasms and the control group.
Figure 2. Representative slides of EGFR staining by immunohistochemistry
in thyroid carcinoma shows: (a) negatively staining (b) positively staining score +1 (c) positively staining score +2 (d) positively staining score +3. Magnification: 40X.
Table 4. EGFR expression and intensity in thyroid carcinoma compared with benign neoplasms.
Cases
EGFR Expression EGFR Intensity
Total No.%
-ve +ve 0 1+ 2+ 3+
No.% No.% No.% No.% No.% No.%
Thyroid carcinoma 55 56 55 15 35 6 111
49.55% 50.45% 49.55% 13.51% 31.53% 5.41% 100.0%
Benign neoplasms 31 15 31 5 9 1 46
67.39% 32.61% 67.39% 10.87% 19.57% 2.17% 100.0%
Total 86 71 86 20 44 7 157
54.78% 45.22% 54.78% 12.74% 28.02% 4.46% 100.0%
P. value non-significant non-significant
P= 0.3 P= 0.539
Table 5. EGFR expression and intensity in thyroid carcinoma compared with control group
Cases
EGFR Expression EGFR Intensity
Total No.%
-ve +ve 0 1+ 2+ 3+
No.% No.% No.% No.% No.% No.%
Thyroid carcinoma 55 56 55 15 35 6 111
49.55% 50.45% 49.55% 13.51% 31.53% 5.41% 100.0%
Control group 14 7 14 5 2 0 21
66.67% 33.33% 66.67% 23.81% 9.52% 0.00% 100.0%
Total 69 63 69 20 37 6 132
52.27% 47.73% 52.27% 15.15% 28.03% 4.55% 100.0%
P. value non-significant non-significant
P= 0.069 P= 0.079
Table 6. EGFR expression and intensity in benign neoplasms and control group
Cases
EGFR Expression EGFR Intensity
Total No.%
-ve +ve 0 1+ 2+ 3+
No.% No.% No.% No.% No.% No.%
Benign neoplasms 31 15 31 5 9 1 46
67.39% 32.61% 67.39% 10.87% 19.57% 2.17% 100.0%
Control group 14 7 14 5 2 0 21
66.67% 33.33% 66.67% 23.81% 9.52% 0.00% 100.0%
Total 45 22 45 10 11 1 67
67.16% 32.84% 67.16% 14.93% 16.42% 1.49% 100.0%
P. value non-significant non-significant
4. Discussion
This study has shown that there is a high significant difference of TGFα expression between thyroid carcinoma and benign patients (P<0.05), Also there was a highly significant difference of TGFα expression between thyroid carcinoma and noncancerous control group, where the TGF-α overexpression was positive in (68.47%) of thyroid carcinoma patients, (43.48%) in benign patients and (19.05%) in noncancerous control group, this is compatible with results of Lam et al. [23], and Lau [24]. Overexpression of TGFα has been observed in a variety of human cancers, including hepatocellular cancer, a study done by Daveau, Scotte et al. [25], salivary duct cancer a study by Fan, Melhem et al. [26], and gastric cancer study by Konturek et al. [27]. On the other hand, there was no significant difference of EGFR expression between thyroid carcinoma and benign patients, as well, there was no significant difference of EGFR expression between thyroid carcinoma and noncancerous control group, although the percentage of EGFR overexpression was positively in (50.45%) of thyroid carcinoma and this is identical to the Lei Gong study [28], but the ratio was only (32.61%) in benign neoplasms and (33.33%) in noncancerous control group. In the study done by Lam et al. [23], they found that was a high expression of TGF-α noted in 77% (55 from 71) of thyroid cancers, and also a high level of EGFR expression was observed in 54% (38 from 71) of thyroid cancers. Additionally, in this study we compared TGFα and EGFR expression between benign neoplasms and noncancerous control group, whereas most of other studies were compared only among thyroid carcinoma patients with benign neoplasms or with noncancerous control group, in the current study we have noted there was significant difference of TGFα expression (P<0.05) between benign patients and noncancerous control group, while there was no significant difference of EGFR expression among benign neoplasms and noncancerous control group. In the study performed by Lau [24], 59 patients of papillary thyroid carcinoma and 10 benign thyroid neoplasm was taken, the results were showed, all cases of the papillary thyroid carcinoma positively for TGFα expression compared with only 20% in the benign thyroid neoplasm, and from 59 samples, 39 (66%) cases were higher expression and 20 (34%) cases were lower expression, as for the benign thyroid neoplasms all positive samples were classified as a lower expression. Moreover, there was no significant difference of TGFα intensity between thyroid carcinoma and benign neoplasms (P>0.05). The same applies for TGFα intensity between thyroid carcinoma and noncancerous control group were there no significant difference and this is consistent with results by Lau [24]. Also there was a no significant difference of the EGFR intensity between thyroid carcinoma and benign neoplasms. Our results concluded there is a strong relationship between TGFα expression and thyroid cancer.
5. Conclusion
Our study concluded that there is a strong relationship between TGFα overexpression with thyroid carcinogenesis, and this protein could serve as a biomarker tool to diagnosis the thyroid cancer.
Acknowledgement
We would like to thank Mr. Younus Atiyah Kamil, AL-Hussein Teaching Hospital, Thi Qar Province and Dr. Ali Abed Saadoon, University of Thi Qar, Thi Qar Province.
References
[1] Nguyen, Q. T.; Lee, E. J.; Huang, M. G.; Park, Y. I.; Khullar, A. and Plodkowsk, R. A. (2015). Diagnosis and treatment of patients with thyroid cancer, American health & drug benefits, 8 (1), 30-38.
[2] Khatawkar, A. V. and Awati, S. M. (2015). Thyroid gland - historical, aspects, embryology anatomy and physiology, International Archives of Integrated Medicine, 2 (9).
[3] Sipos, J. A. and Mazzaferri, E. L. (2010). Thyroid cancer epidemiology and prognostic variables, Clinical Oncology, 22 (6), 395–404.
[4] Jemal, A.; Siegel, R.; Xu, J. and Ward, E. (2010). Cancer statistics, 2010, CA: a cancer journal for clinicians, 60 (5), 277-300.
[5] Al Shahrani, A. S.; El-Metwally, A.; Al-Surimi, K.; Bin-Salih, S.; Saleh, Y.; Al-Shehri, A. and Ali, A. (2016). The epidemiology of thyroid diseases in the Arab world: a systematic review, Journal of Public Health and Epidemiology, 8 (2), 17-26.
[6] Hussain, F.; Iqbal, S.; Mehmood, A.; Bazarbashi, S.; El-Hassan, T. and Chaudhri, N. (2013). Incidence of thyroid cancer in the Kingdom of Saudi Arabia, 2000–2010, Hematology/Oncology and Stem Cell Therapy, 6 (2), 58-64.
[7] Ferlay, J.; Soerjomataram, I.; Ervik, M.; Dikshit, R.; Eser, S.; Mathers, C.; Rebelo, M.; Parkin, D. M.; Forman, D. and Bray, F. (2015). Cancer incidence and mortality worldwide: Sources, methods and major patterns in GLOBOCAN 2012, International Journal of Cancer, 136 (5), 359-386.
[8] National Cancer Institute (U. S.) (2015). SEER, Surveillance, Epidemiology, and End Results: thyroid cancer, U. S. Department of Health and Human Services, National Institutes of Health, National Cancer Institute.
[9] Shrivastava, J. P.; Mangal, K. S.; Woike, P.; Marskole, P. and Gaur, R. (2016). Role of FNAC in diagnosing thyroid neoplasms – a retrospective study, IOSR Journal of Dental and Medical Sciences, 15 (1), 13-16.
[10] Trigo, J. M.; Capdevila, J.; Grande, E.; Grau, J. and Lianes, P. (2014). Thyroid cancer: SEOM clinical guidelines, Clinical and Translational Oncology, 16 (12), 1035-1042.
[12] Herbst, R. S. (2004). Review of epidermal growth factor receptor biology, International Journal of Radiation Oncology, Biology, Physics: Supplement, 59 (2), 21-26.
[13] Udart, Martin; U., Jochen; K., Gertraud M. and Peter, R. U. (2001). Chromosome 7. Aneusomy. A marker for metastatic melanoma: expression of the epidermal growth factor receptor gene and chromosome 7. Aneusomy in Nevi, primary malignant melanomas and metastases, Nature Publishing Group, 3 (3), 245-254.
[14] Robinson D. R.; Wu, Y. and Lin, S. (2000). The protein tyrosine kinase family of the human genome, Oncogene, 19 (49), 5548-5557.
[15] Normanno, N.; De-Luca, A.; Bianco, C.; Strizzi, L.; Mancino, M.; Maiello, M. R.; Carotenuto, A.; De Feo, G.; Caponigro, F. and S., David S. (2006). Epidermal growth factor receptor (EGFR) signaling in cancer, Gene, 366 (1), 2-16.
[16] Bogdan, S. and Klambt, C. (2001). Epidermal growth factor receptor signaling, Current biology, 11 (8), 292-295.
[17] Rosenbloom, K. R.; Armstrong, J.; Barber, G. P.; Casper, J. and Clawson, H. (2015). The UCSC genome browser database: 2015 update, Nucleic acids research, 43, 670-681.
[18] Wieduwilt, M. J. and Moasser, M. M. (2008). The epidermal growth factor receptor family: Biology driving targeted therapeutics, Cellular and molecular life sciences, 65 (10), 1566-1584
[19] Acton, Q. A. (2013). Gastrointestinal hormone receptors: advances in research and application, Atlanta, Georgia.
[20] Jameson, J. L.; DeGroot, L. J.; De Kretser, D. M.; Giudice, L.; Grossman, A.; Melmed, S.; Potts, J. T. and Weir, G. C. (2016). Endocrinology: adult & pediatric, 7th edition, Elsevier/Saunders Philadelphia, PA.
[21] Croyle, M.; Akeno, N.; Knauf, J. A.; Fabbro, D.; Chen, X.; Baumgartner, J. E.; Lane, H. A. and Fagin, J. A. (2008). RET/PTC induced cell growth is mediated in part by epidermal growth factor receptor (EGFR) activation: evidence
for molecular and functional interactions between RET and EGFR, Cancer Research, 68 (11), 4183-4191.
[22] Sethi, K.; Sarkar, S.; Das, S.; Mohanty, B. and Mandal, M. (2010). Biomarkers for the diagnosis of thyroid cancer, Journal of Experimental Therapeutics & Oncology, 8 (4), 341-52.
[23] Lam, A. K.; Lau, K. K.; Gopalan, V.; Luk, J. and Lo, C. Y. (2011). Quantitative analysis of the expression of transformation growth factor alpha (TGF- α) and epidermal growth factor receptor (EGFR) in papillary thyroid carcinoma: clinicopathological relevance, Pathology, 43 (1), 40–47.
[24] Lau, K. P. (2007). Clinicopathological Roles of Transforming Growth Factor Alpha (TGFα) in Papillary Thyroid Carcinoma, Hong Kong University Theses Online.
[25] Daveau, M.; Scotte, M.; FrançOis, A.; Coulouarn, C.; Ros, G.; Tallet, Y.; Hiron, M.; Hellot, M. -F. and Salier, J. P. (2003). Hepatocyte growth factor, transforming growth factor alpha, and their receptors as combined markers of prognosis in hepatocellular carcinoma, Molecular Carcinogenesis, 36 (3), 130-141.
[26] Fan, C. Y.; Melhem, M. F.; Hosal, A. s.; Grandis, J. r. and Barnes, E. l. (2001). Expression of androgen receptor, epidermal growth factor receptor, and transforming growth factor alpha in salivary duct carcinoma, Archives of Otolaryngology Head & Neck Surgery, 127 (9), 1075-1079.
[27] Konturek, P. C.; Konturek, S. J.; Sulekova, Z.; Meixner, H.; Bielanski, W.; Starzynska, T.; Karczewska, E.; Marlicz, K.; Stachura, J. and Hahn, E. g. (2001). Expression of hepatocyte growth factor, transforming growth factor alpha, apoptosis related proteins Bax and Bcl-2, and gastrin in human gastric cancer, Alimentary Pharmacology & Therapeutics, 15 (7), 989-999.