Computational Study of the Effect of Intake
Geometry on the Performance of an Internal
Combustion Engine
Muhammad Arif Ab Hamid Pahmi
1, Moumen Idres
2, Mahamad Hisyam Mahamad Basri
3and Sharzali Che
Mat
41,3,4Faculty of Mechanical Engineering, UiTM Pulau Pinang 2Kulliyyah of Engineering, International Islamic University Malaysia
Abstract— Intake system is an important consideration in a study of engine induction system. In such way, numerous studies
on the effect of intake system were carried in improving engine power. The present study deals with the effect of different intake configurations on a 4-stroke single cylinder engine in wide range engine speed. In order to study the intake geometry effect, four different intake configurations proposed by Mariucci (2006) were modeled and simulated using GT-Power software. At first, the computational model is compared to Mariucci’s experimental data for calibration. The study showed adding taper geometry exhibits a significant volumetric efficiency improvement 3% and performs 19.5 kW in brake power. For bell mouth design, maximum volumetric efficiency reduced in 4% but similar brake power of 19.5 kW is obtained. Furthermore, there is an acceptable match between simulation and experimental results for all intake configurations.
Keywords—Intake geometry, induction system, volumetric efficiency, GT-Power
INTRODUCTION
The primary function of the intake manifold is to spread the combustion mixture evenly to engine cylinder that strictly influenced the engine performance. The flow in the intake manifold especially the compression wave gave significant impact to the engine performance which can be empirically described to produce the desired torque curve [10]. Simulation of internal combustion engine had become prominent in recent years due to the availability of better computer processing. For example, Piedhrahita and Riaza (2003) applied a zero dimensional model in comprehending the cylinder pressure and temperature under different operating parameters such as air-fuel ratio and spark advance angle. Intake tuning is a relatively simple method to boost engine power that relies on the principle of increasing the amount of air-fuel mixture for combustion. Capitalizing on airflow harmonics at specific engine speeds, intake tuning forces more air into the engine cylinders that resulting in greater torque and power [3]. A tuning effect occurs when the compression wave arrives at the time of inlet valve closure [10]. It was found that intake tuning had a more dominant role in the breathing capabilities of the engine compared to exhaust tuning and that both were independent of each other. Sammut and Alkidas (2007) attempted studying the effect of intake and exhaust system on engine performance. His group tried to investigate the profile of engine without intake and exhaust effect. Intake lengths demonstrated a known relationship where maximum volumetric efficiency was obtained at lower speeds for longer intake lengths and vice versa and it helped the breathing performance, beyond what the engine with no pipes was able to produce. In a standard automotive intake system
composed of runners that attached to intake valves, alternating expansion and compression pressure wave oscillated through the air flowing in the runners. If the arrival of compression waves is timed perfectly with the opening and closing of intake valve, these waves act much like a compressor on the turbocharger or supercharger, ramming additional air into the engine cylinder at a pressure above atmospheric [3].
Cylinder pressure was a significant parameter to the engine performance investigation. Eriksson and Andersson (2002) tried to build an analytic model for cylinder pressure in a four-stroke SI engine. Their paper described the in-cylinder pressure of a spark ignited combustion engine operating close to stoichiometric conditions as function of crank angle, manifold pressure and temperature and spark timing.
Further studies in effect of intake tuning create the path to improve engine performance. Intake tuning is where the intake system is tuned until the desirable waves charge into the engine cylinder during induction event. According to Margary, Nino and Vafidis, 1990, the length of intake affect on the mass flow rate and pressure drop across the direct injection diesel engine. The effect of intake length was later continued by Medica group. They performed a study on runner length and added that instead of mass flow rate and pressure drop, cylinder pressure is an important parameter to the engine performance investigation [7]. The intake system especially engine having more than 1 cylinder has complex shape. In 1993, Tallio et al. (1993) study the losses occurred inside the intake system. The intake system is treated as a series of individual components. His study revealed that primary runner entrance had the highest losses.
hypothetical models had been made with the length were increased to 110, 120 and 130% of initial value. The main objective of the study was to investigate the effect of length of runners on the volumetric efficiency at different speeds. In order to ensure simulation accuracy, the simulation results were compared with flow bench rig data for validation. In the model with 20% extended runners, the volumetric efficiency had increased at 3500 and 4500 RPM.
The research on two stroke step piston engine carried out to get the output performance of this type engine. With the aid of simulation using GT-Power, the output can be predicted [1].
Sammut et al. (2007) performed a parametric study using a 1-D engine simulation model that calibrated pressure in the cylinder with cylinder pressure test data from an engine with a stock intake and exhaust system. The engine geometry was reproduced as close as possible in the standard model. Intake and exhaust geometries and valve discharge coefficients based on measured data were input into the model. They adjusted cylinder heat transfer so that the model was able to reproduce the pressure data measured at each engine speed. Once the model was able to predict the measured pressure data, the model was modified by having intake and exhaust system based on specific cases.
The main objective of the study is to investigate the effect of different intake geometries on the volumetric efficiency and the brake power. Therefore, at the end of this study, it will show the best intake geometry which improved the performance of the engine.
METHODOLOGY
GT-Power is based on one-dimensional gas dynamics to investigate the flow and heat transfer in the piping and other components of an engine system. The flow model involves the simultaneous solution of the continuity, momentum and energy equations. These equations are solved in one dimension only, which means that all quantities are averages across the flow direction.
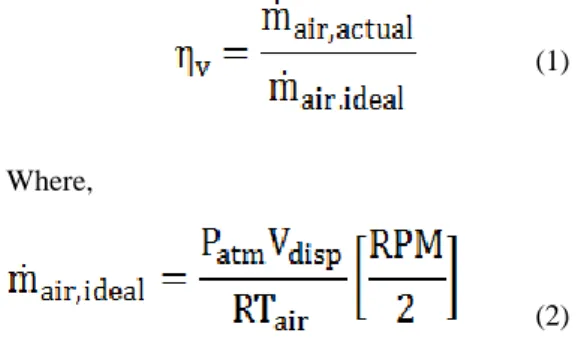
Volumetric efficiency,
η
v is a measurement ofeffectiveness of engine breathing which depends on amount of incoming charge that travels through the intake system. It is determined by dividing the actual mass of air consumed by the ideal air mass that drawn based on displacement volume as shown in equation (1)[3].
(1)
Where,
(2)
The engine specifications such as bore, connecting rod length, compression ratio, maximum lift for both intake
and exhaust valve, and period of valve opening are listed in table 1.
The study is simulation based. Therefore, a sufficient level of confidence must exist before it can be used for other intake configurations. The baseline intake is simulated and the numerical results are compared with the experimental data taken from Mariucci (2006). The model is calibrated using parameters such as temperature inside the cylinder and ignition timing until good agreement with experimental data is achieved. Figures 1 & 2 show the calibration results for volumetric efficiency and brake power.
TABLE 1
SINGLE CYLINDER ENGINE SPECIFICATION (MARIUCCI, 2006)
Bore 89 cm
Stroke 79.5 cm
Rod Length 13.81 cm
Compression Ratio 10.5:1
Clearance Volume 47.10 cm3
Maximum Valve Lift
Intake 0.914 cm
Exhaust 0.937 cm
Valve Timing
Intake Open 308.0 CAD
Intake Duration 286.0 CAD
Exhaust Open 86.5 CAD
Exhaust Duration 326.0 CAD
Figure 1. Calibration of VE for Baseline Intake * Mariucci, 2006
Figure 2. Calibration of BP for Baseline Intake * Mariucci, 2006
1.Baseline
2.Taper
5.S-Bend 4.Single Bend
3.Bellmouth
TABLE 2
TAPER GROUP CONFIGURATION (MARIUCCI, 2006)
Intake L t (cm) Dt (cm) Taper Area Ratio
2 6.613
5.14 1.5
3 13.23
4 26.45
5 13.23
5.94 2.0
6 26.45
7
26.45 6.62 2.5
8 7.26 3.0
TABLE 3
BELLMOUTH GROUP CONFIGURATION (MARIUCCI, 2006)
Intake Rc (cm) Rc/D
13 8.4 2.0
14 6.3 1.5
15 4.2 1.0
TABLE 4
SINGLE BEND GROUP CONFIGURATION (MARIUCCI, 2006)
Intake Ri (cm) Ri/D Overall Length (cm)
9 0.21 0.05 25.21
10 0.84 0.20 25.84
11 2.10 0.50 27.10
12 4.20 1.00 29.20
TABLE 5
S-BEND GROUP CONFIGURATION (MARIUCCI, 2006)
Intake Rc (cm) Rc/D
16 8.4 2.0
17 6.3 1.5
18 4.2 1.0
Figure 3. Intake Geometries Dimensions (Mariucci, 2006)
RESULTS AND DISCUSSIONS
The taper group consists of 7 different area ratios and taper lengths. From the graph, the volumetric peaks shift to the higher engine speed compare to intake 1. All intakes are plot against intake 1 to ensure systematic comparison.
Referring to table 6, the maximum peaks of volumetric efficiency are achieved in intake 5 and 6, which are equivalent of 115% at 4000 and 4250 RPM. These results explain that by applying taper geometry for intake component, it would change locations of volumetric peaks and thus affecting engine performance itself. Moreover, for brake power predictions, the changes are not much but the brake power peaks have shifted to higher engine speeds for intake 4 and 5 and moved to lower engine speeds as indicated in intake 6, 7 and 8. From all tapers results, intake 6 produces the highest volumetric efficiency and intake 8 the best brake power peaks compare to others tapers intakes.
Figure 4. VE for Intake 1, 2 and 3
Figure 5. VE for Intake 1, 4 and 5
Figure 6. VE for Intake 1, 6 and 7
Figure 7. VE for Intake 1 and 8
TABLE 6
MAXIMUM PREDICTIONS VOLUMETRIC EFFICIENCY AND BRAKE POWER FOR TAPER GROUP
Intake Maximum
Volumetric Efficiency,
%
Engine Speed, RPM
Maximum Brake Power, kW
Engine Speed, RPM
1 112.0 3750 19.0 4750
2 113.0 3750 19.5 4750
3 112.0 3850 19.5 4750
4 114.0 4000 19.5 5000
5 115.0 4000 18.5 5000
6 115.0 4250 19.5 4250
7 114.5 4250 19.0 4250
8 108.0 4500 20.0 4500
In figure 8, the peaks volumetric efficiency for intake 9 and 10 nearly identical with intake 1 at 3750 RPM. Intake 9 lowers peaks as much as 109% and other bellmouth intakes, intake 10 obtains 111% maximum extent of volumetric efficiency. At 4750 RPM, intake 1 shows the highest volumetric efficiency compare to intake 9 and 10 because intake 10 has decreased until 97.5% that contributes percentage of difference in 3.47% while intake 9 volumetric efficiency peak has shifted to 5000 RPM, which is equivalent of 97%. In the part of volumetric efficiency trends with bellmouth diameters increasing, the curves for intake 11 and 12 begin to carry on the higher engine speeds as shown in figure 9. The shifting curves are apparently plotted at 3650, 4750, 5000, 5250 and 5500 RPM. At 4750 RPM, intake 11 and 12 show declination approximately 5% until 5500 RPM and support that both intakes predict lower volumetric efficiency at high-engine speeds. Table 7 explains that the volumetric efficiency peaks are almost alike for all bellmouth intakes where intake 9, 10 and 12 indicated reductions. The highest peak brake power is achieved in intake 9, which is equivalent of 20.0 kW. Intake 11 and 12 produce 19.0 kW brake power that is similar delivered by intake 1.
Figure 8. VE for Intake 1,9 and 10
TABLE 7
MAXIMUM PREDICTIONS VOLUMETRIC EFFICIENCY AND BRAKE POWER FOR BELLMOUTH GROUP
Intake Maximum
Volumetric Efficiency,
%
Engine Speed, RPM
Maximum Brake Power, kW
Engine Speed, RPM
1 112.0 3750 19.0 4750
9 109.5 3750 20.0 4750
10 111.0 3750 19.5 5000
11 112.0 3650 19.0 4750
12 111.0 3650 19.0 4750
Overall length for each single bend intakes is 26.45 cm. As shown in figure 10, the peaks of volumetric efficiency for intake 13 and 14 getting lower than intake 1. Although volumetric efficiency peaks merely decreasing, the trends predict similar behaviors as intake 1 does. Hamilton et al. (2009) described the 180 degrees intake bend will reduce engine power in only small quantities. His statement is supported by applying single bend geometry in the intake system used in this study. In table 8, volumetric efficiency peaks merely decrease until 109% and the same behaviors are predicted in brake power magnitudes that show maximum brake power about 19.5 kW for intake 13, 19.4 kW in intake 14 and intake 15 pronounce brake power magnitudes at 19.0 kW. Again, although the volumetric efficiency peaks lower than intake 1, intake 13 predicts the highest brake power magnitude because the compression waves have increased cylinder pressure and lead to higher brake torque and brake power peak.
Figure 10. VE for Intake 1,13 and 14
Figure 11. VE for Intake 1 and 15
TABLE 8
MAXIMUM PREDICTIONS VOLUMETRIC EFFICIENCY AND BRAKE POWER FOR SINGLE BEND GROUP
Intake Maximum
Volumetric Efficiency,
%
Engine Speed, RPM
Maximum Brake Power, kW
Engine Speed, RPM
1 112.0 3750 19.0 4750
13 110.0 3750 19.5 4750
14 109.5 3750 19.4 4750
15 109.0 3750 19.0 4750
In general, intake 16 and 17 trends perform similar peaks of volumetric efficiency except at engine speeds 3000 and 4750 RPM that show destructive magnitudes in 1% and 2%. Intake 18 however, indicates more evidently difference that occurs between engine speeds range from 3000 to 4750 RPM. These predictions are caused by higher flow losses compare to others s-bend intakes. At 3000 RPM, the reduction is around 4%, follows slightly 2 % at 3750 RPM and a decrement of 2.5% is found at 4750 RPM. From table 9, intake 16 shows the highest volumetric efficiency and brake power that attained 111% and 19.5 kW respectively.
Figure 12. VE for Intake 1,16 and 17
Figure 13. VE for Intake 1 and 18
TABLE 9
MAXIMUM PREDICTIONS VOLUMETRIC EFFICIENCY AND BRAKE POWER FOR S-BEND GROUP
Intake Maximum
Volumetric Efficiency, %
Engine Speed, RPM
Maximum Brake Power, kW
Engine Speed, RPM
1 112.0 3750 19.0 4750
16 111.0 3750 19.5 4750
17 109.0 3750 19.4 4750
18 100.0 3750 19.2 4750
from single bend and s-bend group. As shown in figure 14, the highest level of volumetric efficiency peaks hold by intake 6 in 115% at 4250 RPM. It is been noticed the tendency of volumetric efficiency trends to shift on the right side is performed well in intake 6 especially at engine speeds from 3000 to 5500 RPM. Instead of intake 6, intake 9 also indicates apparent discrepancy that occur at 3000, 3500, 4000, 4500 and 4750 RPM. The difference of 2% at 3000 RPM and 5% at 4750 RPM in intake 9 are attained when compare to intake 1. Both intake 13 and 16 predict lower volumetric efficiency peaks in overall correlate to intake 1 and it is noticed that intake 13 exhibits merely smaller peaks than intake 16 due to losses in the intake system. As indicated in figure 15, intake 9 produces 20 kW brake power that is the highest magnitudes, follows by intake 6, 13, 16 and intake 1 in a series of reduction respectively. It also shows intake 6 delivers substantial impacts against brake power performance exceeding over others intake configurations effects at 4250 RPM.
Figure 14. VE for Intake 1, 6, 9, 13 and 16
Figure 15. BP for Intake 1, 6, 9, 13 and 16
Brake mean effective pressure (BMEP) in the cylinder directly related to the brake power measurement. By comparing values plotted in figure 15 and 16 at 4250 RPM, both values imply BMEP and brake power are interrelated. From the figures, highest value of BMEP will produce the best brake power magnitude at the given engine speed. In a simple approach, measurement of intake pressures can use to analyze
volumetric efficiency trends while BMEP is essential for brake power predictions.
Figure 16. BP for Intake 1, 6, 9, 13 and 16
CONCLUSION
REFERENCES
1. Aziz, A. A., Latif, Z. A., Mohamad M. F. M. and Ming G. L. (2005). Development of a 125 cc Two Stroke, Step Piston Engine using a One-Dimensional Engine Code. Journal of KONES Internal Combustion Engines, Vol. 12, 1-2.
2. Eriksson, L. E. and Andersson, I. K. (2002). An Analytic Model for Cylinder Pressure in a Four-Stroke SI Engine. SAE Paper 2002-01-0371.
3. Hamilton L. J., Cowart J. S. and Rozich J. J. (2009). The Effects of Intake Geometry on SI Engine Performance. SAE Paper 2009-01-0302.
4. Maftouni, N., Ebrahimi, R. and Pour, S. H. (2006). The Effect of Intake Manifold Runners Length on the Volumetric Efficiency by 3-D CFD Model. SAE Paper 2006-32-0118, 2006.
5. Margary, R., Nino, E. and Vafidis, C. (1990). The Effect of Intake Duct Length on the In-Cylinder Air Motion in a Motored Diesel Engine. SAE Paper
9000057.
6. Mariucci, V. E. (2006). An Experimental and Computational Investigation of the Effect of Primary Intake Runner Geometry on the Performance of a Single Cylinder Engine. MS Thesis, The Ohio State University.
7. Medica, V., Yarija, Z. and Frankovi, B. (2000). Control Strategy for Continuously Variable Pipes Length of the Intake Manifold. SAE Paper 2000-05-0099.
8. Piedhrahita, C. A. R. and Riaza, H. F. Q. (2003). Prediction of In-Cylinder Pressure, Temperature and Loads Related to the Crank-Slider Mechanism of I.C. Engine: A Computational Model. SAE Paper 2003-01-0728.
9. Sammut, G. and Alkidas, A. C. (2007). Relative Contributions of Intake and Exhaust Tuning on SI Engine Breathing – A Computational Study. SAE Paper 2007-01-0492.
10. Tabaczynski R. J. (1982). Effects of Inlet and Exhaust System Design on Engine Performance. SAE Paper 821577.
11. Tallio K. V., Tobis B. J. and Selamet A. (1993). The Application of Steady-Flow Loss Correlations to Intake Manifold Design. SAE Paper 930608.
ABBREVIATIONS
VE Volumetric Efficiency
BP Brake Power