VOLUME 17 ISSUE 1 (2019), Page 267 – 279
THE NEXUS BETWEEN HOUSING GLUT, ECONOMIC GROWTH, HOUSING AFFORDABILITY AND HOUSE PRICE IN MALAYSIA
Yip Chee Yin1, Au Yong Hui Nee2 & Abdelhak Senadjki3
1,2,3Faculty of Business and Finance
UNIVERSITI TUNKU ABDUL RAHMAN, MALAYSIA
Abstract
This paper analyses [1] the relative impact of housing affordability, housing prices and gross domestic product on housing glut, [2] the effects of housing glut on the health of housing market and then [3] suggestion of solutions to mitigate the risks of housing bubble bursting. Results show that housing affordability and housing price exert very mild effect on housing glut contrary to the common belief that these two factors have significant effect on housing glut. In terms of number, our results show that economic growth contributes about 0.15 negative impact on housing glut for every unit increase in economic growth while each unit increase in housing price can increase housing glut as much as 0.0054 unit.
INTRODUCTION
Housing glut can bring about serious damage to the economy as it can lead to rampant default of bank loan repayment, rising abandonment of ongoing housing projects due to weakened capacity of the developers in servicing their bridging loan following poor sales and a host of other disruptions within the industry and also other related industries (Himmelberg, Mayer, & Sinai, 2005). While lenders would take a more cautious stance and as a result causing a credit crunch, buyers take a wait and see position as they expect prices to fall, thus further reducing sales. The ultimate consequence could be a collapse of house prices or the bursting of the housing bubble that inexorably brings about a financial crisis (Yip, Wong & Woo, 2016).
Much research has been done on the causes of and offer solutions to overcome the housing affordability issue, for example Angel, Mayo and Stephens (1993), Angel (2000), Paris (2007), and Gabriel, Jacos, Arthurson, Burke and Yates (2005). However, none of these aforementioned papers have looked into the relationship between housing affordability and housing glut, and their correlation with other factors like housing price and economic growth so that a clearer picture of the housing affordability dynamics can appear and hence, correct remedial policy action can be taken to alleviate the housing affordability problem and thereby mitigates the housing glut problem.
This paper aims to shed some light on the nexus between housing glut and the factors of housing affordability, housing price and economic growth. Specifically, this paper analyses [1] the relative impact of housing affordability, economic growth and housing prices on housing glut using economic analysis and statistical modelling, [2] the effects of housing glut on the health of the housing market using logical deduction and intuition, and then [3] suggestion of solutions to mitigate the risks of the bursting of the housing bubble.
Malaysia is currently facing a residential property glut with oversupply at its highest level in a decade (Bank Negara Malaysia, 2014). If unchecked, can these imbalances lead to property market crash as experienced in 1998? The logical question to ask is therefore: What level of housing glut is considered as serious enough to cause housing market crash if it can cause housing market crash at all? We attempt to answer this question using logical deduction, regression technique and economic analysis. Finally, to overcome the problem of high level of residential units overhang, we analyse three policies options, namely encouraging rental market, increase efficiency in provision of affordable homes and raising efficiency in allocation of affordable homes.
RESEARCH BACKGROUND
Literature on housing affordability abounds and the established studies are basically driven mainly by the need to provide more affordable housing. However, literature concerning housing glut and its potential devastating effect is yet scarce. In recent years, many nations, advanced and emerging economies alike have explored the approach of using statutory land-use planning system to implement the provision of additional affordable housing more effectively (Paris, 2007). With intent focus on the method to provide more affordable housing, the efforts have overlooked the fact that as supply is being intensified, it may reach the state when supply exceeds demand, and in the event of this scenario, prices will readjust themselves downwards resulting more houses become affordable because prices are coming down fast. Many of these articles focused on how best to address the affordability issue (Gabriel et al., 2005; Burke et al., 2007; Yates, Wulff & Reynold, 2004; Beer, Kearins, & Pieters, 2007) but missed out the dramatic effect of when the supply rate of houses outpaces demand. All these aforementioned research papers concentrated on solutions for the housing affordability problem but failed to investigate the correlation between the main factors especially housing glut, housing prices and economic growth on housing affordability. This state of housing affordability issue is found in many countries including Malaysia.
Meanwhile, Lawson and Milligan (2007), specifically for the case of Australia at national level, discussed that there is a marked increase in using new strategies to promote new investment in affordable housing to low and moderate-income households. Then we have the provision contained in Section 106 of the Town and Country Planning Act 1990 in England that calls for contribution by a developer to affordable housing as a consideration and condition of planning approval. Gurran, Milligan, Baker and Bugg (2007) revealed that the existence of social housing grant exerts a positive impact on the viability of a site for affordable housing by reducing the impact of a social housing target on residual land value. Additionally, the authors also pointed out that in Ireland, national legislation was introduced through the Planning and Development Act (2000) to enable local authorities to require developers to contribute to social and affordable housing. The enactment of this legislation is based on the application of planning gain mechanisms to deliver housing for rent and sale to low income households (Norris & Shiels, 2007).
THE MACRO-VARIABLES: HOUSING GLUT, HOUSING AFFORDABILITY, HOUSING PRICE AND ECONOMIC GROWTH
We use logical deduction, common sense analysis coupled with economic analysis to analyse the four important macro variables in a housing market: housing glut, housing affordability, housing price and economic growth. The reason for this analysis is that it is expected that all these four macro variables are interrelated to one another in some way and thus makes regression results not robust and therefore raises the need to be reinforced by qualitative analysis and the application of special regression technique that is instrumental variable regression.
Housing Glut
Bank Negara Malaysia has stated that Malaysia is facing a serious residential property glut, the highest level since a decade ago. Of the total unsold units, 61% are high rise properties of which 83% are of price RM250,000 and above. Two logical deductions can be made from these two percentages.
The percentage of 83% suggests that many of the potential house buyers cannot afford prices above RM250,000. If we use the definition of affordability being no more than 3 times the annual income of the household, then to be able to afford the price of RM250,000, the combined monthly income of the household would be about RM7,000.00. However, as shown in Figure 1 below, only 14.6% of the total households fall within the monthly income bracket of RM6,000 – RM7,999. Figure 1 also shows that households with earnings more than aforementioned monthly income bracket make up a total of 35.2% from the total households in the country. This suggests that only 35.2% of the national households can afford houses with price of RM250,000 and above. Thus, the question arises as to why the unsold houses were built in the first place? Have these developers not conducted prior market research before launching their projects? A further question is whether the housing price of RM250,000 suggests that houses of this price are the socially accepted minimum standard of housing.
Figure 1: Housing affordability by income levels
Source: BNM Quarterly bulletin-3rd Quarter 2017
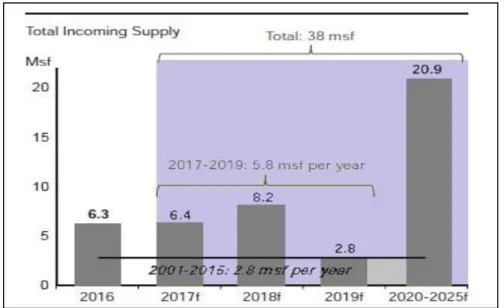
Figure 2: Annual incoming supply from 2017-2019
Source: BNM Quarterly bulletin-3rd Quarter 2017
behind this rather confusing state? Conventional wisdom would point to lack of coordination between developers and government agencies and/orunderstanding of consumer demand trend – current and projected over the next 2-3 years.
Housing Affordability
Many countries including Malaysia are experiencing housing affordability problem which effectively means consumers do not have the purchasing capability to acquire the property that they can set up a liveable home. Hence, the problem is we need a house which is socially accepted with a minimum level of standard of housing (SAMASH) and available at affordable price to the potential buyer. SAMASH is different in different locations and countries and it changes with respect to time and economic development of the country. It is the key to housing affordability problem. To date, there is no consensus as to what constitutes SAMASH. It depends on the public perceptions of what constitute socially minimum acceptable standard of housing and also on the quantum of income level increase which is propelled largely by strong economic growth. This trend of analysis is in line with World’s senior housing specialist Dao Harrison, who proposes that more detailed data should be collected from consumers to understand the true need for affordable housing in Malaysia and surveys should be done by a third party every 2 to 3 years.
Figure 3 displays the housing affordability index graph which suggests that Malaysia faced no housing affordability problem over the period 1990-2009. The problem has surfaced since around 2009. This computation in Figure 3 is based on the recognized notion that when housing after the affordability index less than 130, housing affordability issue will develop.
Figure 3: Housing affordability problem
Source: BNM Quarterly bulletin-3rd Quarter 2017
0 100 200 300 400 500 600
94 96 98 00 02 04 06 08 10 12 14 16
Time Period of No housing affordability
problem
Time Period of housing affordability
problem
The second issue is housing affordability index has various definitions. We should analyse these definitions and adopt the definition that is most suitable for the Malaysian context.
Housing Price
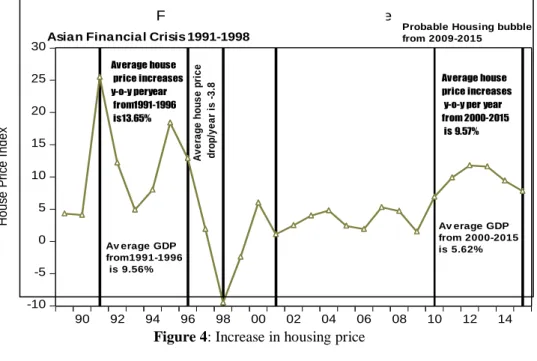
Between 2001 and 2005, house prices in Malaysia increase by an average of 7.3% per year or 29.2% over the course of 5 years. Over the following 5 years between 2006 and 2010, house prices in Malaysia shot up by an average of 6.1% per year or an accumulated 24.2%. By contrast, from 2010-2012, national real house prices grew by 9.4% per year or 37.6% over the 5 years period. This is more than 30% increase in the annual rate of appreciation when compared with the previous 12 years (2001-2012). This increase of 7.3, 6.1 and 9.4% are rather steep in comparison with the United States market over the ten-year period from 1995-2004, when national real house prices grew at an annual average of only 3.6% (Himmelberg et al., 2005). The house price trend in the Malaysian market over the past 10 years is a worrying phenomenon because it is a vital sign of a protracted booming market, the building up of a housing bubble. And history shows that a collapse or burst will very likely follow. A bursting of a housing bubble poses a very significant risk to the national economy, causing economic and social damage, adversely impacting the banking system, household consumption and the real economy of the nation. Figure 4 shows the price increase from 2010 to 2013 are comparatively not as sharp as the spikes in the 1990s and from 2013-2014, the fall is not as rapid as the one in 1998.
Figure 4: Increase in housing price -10 -5 0 5 10 15 20 25 30
90 92 94 96 98 00 02 04 06 08 10 12 14
Av erage GDP from1991-1996 is 9.56%
Av erage GDP from 2000-2015 is 5.62% H o u se P ri ce I n d e x A v e ra g e h o u s e p ri c e d ro p /y e a r is -3 .8 Average house price increases y-o-y peryear from1991-1996 is13.65% Average house price increases y-o-y per year from 2000-2015 is 9.57%
Asian Financial Crisis 1991-1998 Probable Housing bubblefrom 2009-2015
The questions are: Can this moderate boom and burst period deteriorate into a severe boom and burst episode? What are the dynamics of the housing prices for this period? Can a severe housing glut turn this housing cycle into a bubble?
Economic Growth
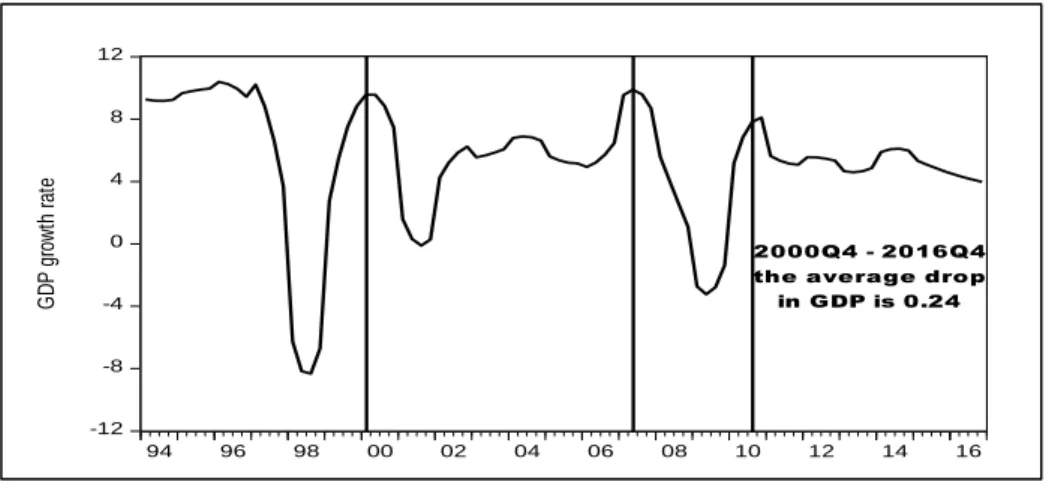
Figure 5: GDP growth rate .
Economic growth (GDP) is the key measure for the economic health of a country. It provides a measure for the household average income. Comparing Figures 3 and 5, we see a downward trend of GDP growth rate that roughly coincides with the period of housing unaffordability for the recent period starting from 2010. It gives an indication that housing affordability, and housing glut are correlated with economic growth as well as housing prices. However, situation like this is true only in big cities like Kuala Lumpur and Penang.
RESEARCH METHOD
In the preceding section, we have discussed the correlation between the four variables - housing glut (HG), housing affordability (HA), housing price (HP) and economic growth (EG). As they are correlated with one another, we cannot use normal regression technique without modification. We trace the correlation matrix for all the four variables. Next, we look for four instruments and then conduct instrumental regression of housing affordability, housing price and economic growth on housing glut.
We have three independent variables and we use two suitable instruments on the simple regression of housing glut on housing affordability, then housing price and next economic growth separately. We test for over identification by using J test. Through literature review and statistical testing, we identify four
-12 -8 -4 0 4 8 12
94 96 98 00 02 04 06 08 10 12 14 16
Figure 5 : GDP growth rate
G
D
P
g
ro
w
th
r
at
e
2000Q4 - 2016Q4 the average drop
instruments: Consumer sentiment index (CI), Kuala Lumpur composite index (KI), Exchange rate (RM/USD) (ER), Oil price (OP).
The formula for the instrumental variable regression is shown in the appendix. The first stage of computation is illustrated by equation (2a), (2b) and (2c) while the second stage of computation is represented by equation in Model 1, 2 and 3. All three are simple linear regression models but computed using two stage least square estimation technique in order to avoid simultaneity, serially correlated and heteroskedastic problem
.
EMPIRICAL ANALYSIS AND CONCLUSION
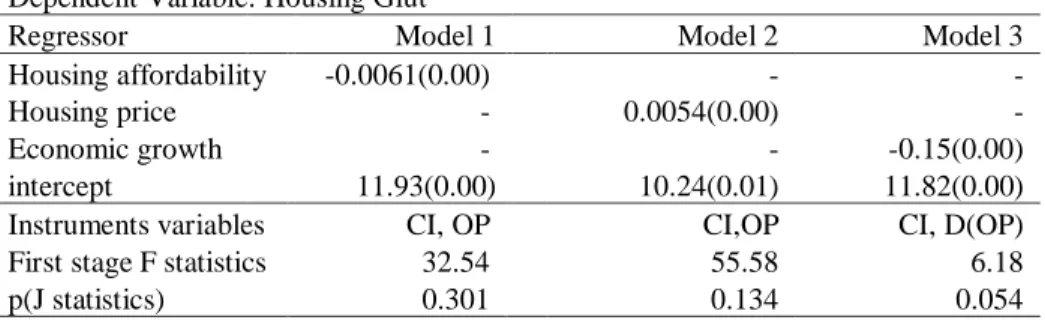
Table 1 shows the results when model 1, 2 and 3 are run by using two stage least square estimation method. The results show that when housing affordability improves by 1 unit, housing glut will decrease by 0.0061 unit, which is small by magnitude. But nevertheless, it shows that improving housing affordability, housing glut will be lessened. On the other hand, housing price exerts a positive impact on housing glut by as much as 0.054 unit for every unit increase in housing price. As for economic growth, housing glut will decrease as much as 0.15 if economic growth picks up by 1 unit. This shows that economic growth has a tremendous effect on housing glut, which is understandable as we know that strong economic growth will increase the level of income and thus increase the financial ability of the people to purchase their own house.
Table 1: Two stage least square estimates of the impact of housing affordability, housing price and economic growth
Dependent Variable: Housing Glut
Regressor Model 1 Model 2 Model 3 Housing affordability -0.0061(0.00) - - Housing price - 0.0054(0.00) - Economic growth - - -0.15(0.00) intercept 11.93(0.00) 10.24(0.01) 11.82(0.00) Instruments variables CI, OP CI,OP CI, D(OP) First stage F statistics 32.54 55.58 6.18 p(J statistics) 0.301 0.134 0.054 Note: CI = Consumer sentiment index, OP = Oil price, D(OP)= first difference of oil price
Values in the parenthesis are p-values for testing significance
affordable housing contrary to what is presented currently by researchers of property agencies. The same situation applies to the factor of housing price which therefore may not be a main cause of housing glut. Hence this brings the conclusion that housing glut is mainly caused by the lack of proper coordination among the various players in the housing market.
GRAPHICAL ANALYSIS
Figure 6a: Housing glut (HG) versus housing affordability (HA)
Figure 6a shows the graph of housing glut with respect to housing affordability. The graph shows that from 2013Q2 onwards, as affordability decreases, housing glut increases. This is in line with our finding using instrumental variable regression analysis as shown in Table 1.
With regard to the relationship between housing glut and housing price, from 2003Q4 onwards, as housing price increases, housing glut moves up only slightly. This debunks the fact that higher housing price is the main cause for housing glut. The graph analysis results corroborate this point that higher housing price can cause slight increase in housing glut only as shown in Figure 6b.
Figure 6c: Housing glut versus economic growth
Figure 6c shows that as economic growth decreases, housing glut starts to rise commencing from 2014Q3 to the current time. The above graphical results are in line with the instrumental variable regression results. Thus, the conclusion is housing price, housing affordability and economic growth do not influence housing glut significantly.
CONCLUSION
period between submission of application for a development project and official approval is quite long, about 2 years. Within these 2 years, the state of the economy may have changed due to external and internal uncontrollable factors. This is indirectly illustrated by the fact that the incoming housing supply increases tremendously despite softer market as shown in Figure 2. T. Based on this research finding, it is suggested that consumer housing demand survey to be conducted every two to three years and must be conducted by a third party so that the actual state of the housing market on the ground is known. Based on the results of our studies, we would suggest that biennial surveys be carried out by appointed institution of higher learning to collect relevant data such as consumer housing demand, financial capacity and such data should be available to developers and government agencies in their planning for housing policies and development projects.
ACKNOWLEDGEMENT
We wish to thank the Ministry of Higher Education, Malaysia for the financial support for this study through the FRGS research grant reference FRGS/1/2016/SS08/UTAR/02/2).
REFERENCES
Angel, S. (2000). Housing policy matters: A global analysis. New York: Oxford University Press.
Angel, S., Mayo, S. K., & Stephens, W. L. (1993). The housing indicators program: A report on progress and plans for the future. Journal of Housing and the Built Environment, 8(1),13-48.
Bank Negara Malaysia (2014). Developments in the Housing Market and Implications on Financial Stability. Financial Stability and System Payments Report 2012.
Beer, A., Kearins, B., & Pieters, H. (2007). Housing affordability and planning in Australia: The challenge of policy under neo-liberalism, Housing Studies, 22(1), 11-24.
Burke, T., Pinnegar, S., Phbbs P, Neske, C., Gariel, M., Ralston, L., & Ruming, K. (2007). Experiencing the housing affordability problem: Blocked aspiration, trade-offs and financial hardships, National Research Venture 3: Housing affordability for lower income Australians, Research Paper No 9, Australian Housing and Urban Research Institute
Gabriel, M., Jacos, K., Arthurson, K., Burke, T., & Yates, J.(2005). Conceptualizing and measuring the housing affordability problem, National Research Venture 3: Housing affordability for lower income Australians Research Paper No. 1,
Australian Housing and Urban Research Institute.
Himmelberg, C., Mayer, C., & Sinai, T. (2005). Assessing high house prices: Bubbles, fundamentals and misperceptions. Journal of Economic Perspective. 19(4). 67-92.
Lawson, J., & Milligan, V. (2007). International trends in housing and policy Responses.
Final Report, AHURI: Sydney. .
Norris, M. & Shiels, P. (2007). Housing affordability in the Republic of Ireland: Is planning part of the remedial work scheme, Administration, 49(1), 25-45 Paris, C. (2007). International perspectives on planning and affordable housing, Housing
Studies, 22(1), 1-9.
Irish Local Government (2000). Town and Country Planning Act (1990). England. Yates, J., Wulff, M. & Reynold, M. (2004). Changes in the supply and need for low rent
dwelling in the private rental market. Final Report No 61, Australian Housing and Urban Research Institute.
Yip, C.Y., Wong W.C. & Woo K. H., (2016). Detecting Malaysian housing bubbles.
American Journal of Applied Sciences, 13(3), 281-289.
APPENDIX
The Instrumental Regression Model: HGi = β0 + β1 HAi + ui (Model 1) HGi = β0 + β2 HPi + ui (Model 2) HGi = β0 + β3 EGi + ui (Model 3) HAi = Л0 + Л1CIi + Л2KIi + Л3ERi + Л4OPi + vi (2a) HPi = Л0 + Л1CIi + Л2KIi + Л3ERi + Л4OPi + vi (2b) EGi = Л0 + Л1CIi + Л2KIi + Л3ERi + Л4OPi + vi (2c)