Lucr
ă
ri
ş
tiin
Ń
ifice Zootehnie
ş
i Biotehnologii, vol. 41 (2) (2008), Timi
ş
oara
THE EFFECT OF SOME FACTORS ON THE MILK MAIN
COMPONENTS
INDICI AI PRODUCTIEI CANTITATIVE SI
CALITATIVE DE LAPTE IN FAZA MAXIMA A CURBEI DE
LACTATIE
CADAR OLEZIA, VELEA C., REBRI
Ş
OREAN ADA
University of Agricultural Sciences and Veterinary Medicine Cluj-Napoca, Romania
Faculty of Animal Production and Biotechnology
The paper emphasizes the results of the research performed on 317 Romanian
Spotted cows from six private exploitations located in the central part of the
country. The main qualitative and quantitative traits of the milk production, season
and familial structures (half sisters by father) effect were recorded in dynamics by
four lactations on the above mentioned population. The research concerning the
evolution of some traits of the quantitative and qualitative milk production in
dynamics by lactation reveals many aspects, which in all cases equally reflects both
the genetic potential of the biological material that can be expressed and putting
into practice of the rearing and exploitation technologies. Concerning the
quantitative milk production, by normal and total lactation an almost plane curve is
described (Table 1, Figure 1). This aspect was also reported for the collecting areas
and farms (Tables 2 and 3). Concerning the season effect, it is observed function of
the adopted technology of exploitation, that for effectives is significantly observed
only in summer (Table 4). In last part of the paper, the main traits of the milk
production in 16 familial structures of primiparous half sisters by father, classified
function of the quantity of fat and protein yield by normal lactation are emphasized
(Table 5). The obtained results are concluding.
Key words: milk, lactation, Romanian Spotted, genetic potential
Introduction
Materials and Methods
The research aimed 317 Romanian Spotted cows from six private farms
located in central part of our country. On the above mentioned population, the main
quantitative and qualitative traits of the dairy production were recorded in
dynamics by 4 lactations and within them by control time interval (28 days each).
The results were statistically processed and presented in tables and graphics. In this
context, the results were structured by three groups of factors, and in this paper we
present the effect of the lactation, season and familial structures (paternal half
sisters).
Results and Discussions
The research concerning the evolution of some quantitative and qualitative
traits of the dairy production in dynamics by lactations reveal several aspects which
in all cases equally reflect on one had the expressed genetic potential of the
biological material and on the other hand the adopted rearing and exploitation
technology. Among the reproduction indices, we mention the age at the first
calving, which even we consider acceptable is with 12.8% higher compared to the
optimal age, length of calving interval, respectively, which corresponds to an
average natality index of more than 94%. Concerning the quantitative milk
production, for both normal and total lactation, it describes an almost plate curve
(Figure 1). This aspect is clearer if we consider several interrelations in dynamics,
by lactation, as follows:
Issue
MU
Lact.I
Lact.II
Lact.III
Lact.IV Tot.lact.
a. Production compared to maximum lactation
By total lactation
%
91.30
97.65
100
98.24
b. Difference of some traits between normal and total lactation
- Duration of lactation
%
12.29
5.96
5.14
5.37
7.92
- Milk yield
%
9.20
3.50
4.30
3.69
5.54
2. Average daily milk production
-by total lactation
kg
14.11
16.45
16.65
16.08
15.58
-by normal lactation
kg
14.51
16.84
16.78
16.34
15.94
-by dif. d.l.t. d.l.n.
kg
10.85
11.18
13.95
11.12
11.12
The main quantitative and qualitative traits of the dairy production in dynamics by lactations
Trait U/M LACTATION AVERAGE/TOTAL
1 2 3 4
n head 317 265 197 131 910
BY TOTAL LACTATION (V.P.F. 934.18±8.57 days)
DIM days 328.63±2.18 301.26±3.02 305.07±3.19 310.23±3.76 312.91±2.25
Days dry days 71.60±5.11 78.97±6.22 76.83±4.48 - 75.43±5.06
Calving interval days - 396.25±4.03 380.97±4.11 382.43±9.37 388.12±7.58
Protein content % 3.27±0.01 3.27±0.01 3.25±0.01 3.24±0.01 3.26±0.01
Lactose quantity kg 215.02±2.96 228.53±3.32 236.95±4.22 230.04±5.63 225.86±1.97
Lactose content % 4.64±0.01 4.61±0.01 4.66±0.01 4.61±0.02 4.63±0.01
B NORMAL LACTATION
DIM days 292.67±1.28 284.31±1.91 290.16±2.23 294.41±2.05 289.94±0.92
Milk quantity kg 4246.77±46.50 4788.99±69.15 4869.71±110.14 4811.96±120.15 4620.89±38.89
Fat quantity kg 171.80±2.03 194.94±2.83 195.39±3.97 193.76±4.65 186.81±3.05
Fat content % 4.06±0.01 4.07±0.01 4.01±0.01 4.03±0.02 4.04±0.01
Protein quantity kg 137.91±1.58 155.89±2.13 158.02±3.17 155.75±3.86 150.07±1.42
Protein content % 3.25±0.01 3.26±0.01 3.24±0.01 3.24±0.02 3.25±0.01
Lactose quantity kg 196.69±2.32 220.18±3.18 226.46±5.17 220.57±5.89 213.41±3.02
Lactose content % 4.63±0.01 4.60±0.01 4.65±0.02 4.58±0.02 4.62±0.02
4620.89 4811.96
4869.71 4788.99
4246.77
4876.7 4989.63
5079.01 4956.76
4637.39
3800 4000 4200 4400 4600 4800 5000 5200
1 2 3 4 Average
Lactation
k
g
m
ilk
Milk quantity by normal lactation Milk quantity by total lactation
4.07 4.04
4.03 4.11
4.07
3.26 3.24
3.25 3.27
3.27
4.63 4.61
4.66 4.61
4.64
3 4 5
1 2 3 4 Average
Lactation %
Dynamics of milk fat content Dynamic of milk protein content Dynamics of lactose milk content
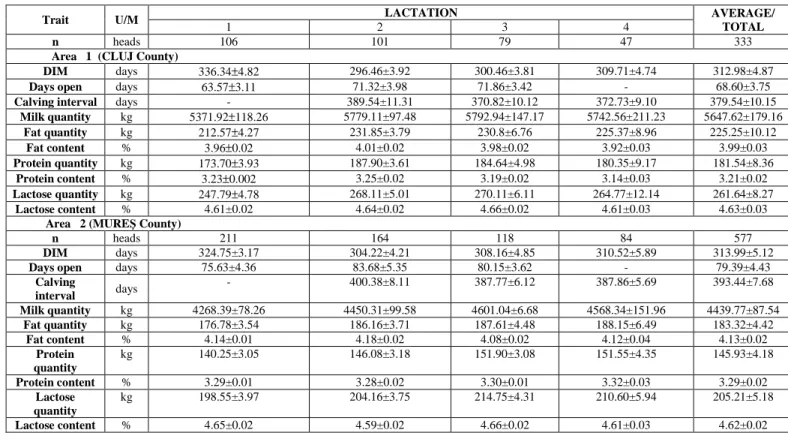
We notice that the same aspects were recorded in structure of the farms by
provenience area (Table 2) of each farm (Table 3). Between them, significant
differences concerning the qualitative and quantitative traits of the dairy production
were recorded, but their character and evolution are almost identical.
Table 4
The seasonal effect on some dairy production indices in primiparous (by normal lactation)
Issue MU Winter Spring Summer Autumn
n heads 84 107 65 61
% 26.50 33.75 20.50 19.25
Milk Kg 4882.27±56.18 4632.39±73.28 4232.73±115.63 4673.42±111.44 Fat % 4.02±0.01 3.99±0.01 3.96±0.02 3.98±0.02
Kg 196.27±2.31 184.83±3.11 167.62±3.98 186.00±2.37 Protein % 3.35±0.01 3.34±0.01 3.31±0.02 3.32±0.02
Kg 163.56±3.98 154.72±2.54 140.10±2.38 155.16±3.25 Lactose % 4.66±0.01 4.65±0.01 4.64±0.01 4.65±0.01
Kg 227.51±2.35 215.41±3.23 196.40±3.19 217.31±3.28 Reproduction indices
Days dry days 75.73±0.62 75.31±1.02 76.28± 75.75±1.37 Calving interval days 423.06±1.51 425.72±1.41 427.32± 425.09±1.78 Days open days 137.55±1.53 140.25±1.33 142.52± 139.43±1.81
Natality % 86.28 85.57 85.42 85.88
The identification of the effect of the familial structures of paternal half sisters
was performed on a total population of 496 primiparous, offspring of 16 bulls (Table 5).
The results emphasized the significant differences of the main quantitative and qualitative
traits of the dairy production. Among these we mention as maximal values the age at the
first calving (27.22%), milk production by normal lactation (59.12%) and cumulated
quantity of fat and protein (61.09%), trait function of which we performed the hierarchy
of the familial structures of paternal half sisters. These results are in a great measure
determined by the farms, and applied rearing and exploitation technologies. The effect of
this factor is very significant and conclusive.
Conclusions
In the context of the above mentioned results of our research, the conclusions
were revealed during the presentation, but we underline the expressed genetic potential of
production and adopted technology of exploitation, mentioning that such studies are
necessary in any rearing farm, which take into consideration the modality of using the
biological material by production destinations.
Bibliography
1. Velea C.
ş
i colab. (1994) – Tehnologia cre
ş
terii bovinelor, USAMV
Cluj-Napoca.
2. Velea C. (1999) - Produc
Ń
ia, reproduc
Ń
ia
ş
i ameliorarea taurinelor, vol I
ş
i II,
EdituraTehnic
ă
Agricol
ă
, Bucure
ş
ti.
Table 2
Average values of milk production by area and lactation
Trait U/M LACTATION AVERAGE/
TOTAL
1 2 3 4
n heads 106 101 79 47 333
Area 1 (CLUJ County)
DIM days 336.34±4.82 296.46±3.92 300.46±3.81 309.71±4.74 312.98±4.87
Days open days 63.57±3.11 71.32±3.98 71.86±3.42 - 68.60±3.75
Calving interval days - 389.54±11.31 370.82±10.12 372.73±9.10 379.54±10.15
Milk quantity kg 5371.92±118.26 5779.11±97.48 5792.94±147.17 5742.56±211.23 5647.62±179.16
Fat quantity kg 212.57±4.27 231.85±3.79 230.8±6.76 225.37±8.96 225.25±10.12
Fat content % 3.96±0.02 4.01±0.02 3.98±0.02 3.92±0.03 3.99±0.03
Protein quantity kg 173.70±3.93 187.90±3.61 184.64±4.98 180.35±9.17 181.54±8.36
Protein content % 3.23±0.002 3.25±0.02 3.19±0.02 3.14±0.03 3.21±0.02
Lactose quantity kg 247.79±4.78 268.11±5.01 270.11±6.11 264.77±12.14 261.64±8.27
Lactose content % 4.61±0.02 4.64±0.02 4.66±0.02 4.61±0.03 4.63±0.03
Area 2 (MUREŞ County)
n heads 211 164 118 84 577
DIM days 324.75±3.17 304.22±4.21 308.16±4.85 310.52±5.89 313.99±5.12
Days open days 75.63±4.36 83.68±5.35 80.15±3.62 - 79.39±4.43
Calving
interval days
- 400.38±8.11 387.77±6.12 387.86±5.69 393.44±7.68
Milk quantity kg 4268.39±78.26 4450.31±99.58 4601.04±6.68 4568.34±151.96 4439.77±87.54
Fat quantity kg 176.78±3.54 186.16±3.71 187.61±4.48 188.15±6.49 183.32±4.42
Fat content % 4.14±0.01 4.18±0.02 4.08±0.02 4.12±0.04 4.13±0.02
Protein quantity
kg 140.25±3.05 146.08±3.18 151.90±3.08 151.55±4.35 145.93±4.18
Protein content % 3.29±0.01 3.28±0.02 3.30±0.01 3.32±0.03 3.29±0.02
Lactose quantity
kg 198.55±3.97 204.16±3.75 214.75±4.31 210.60±5.94 205.21±5.18
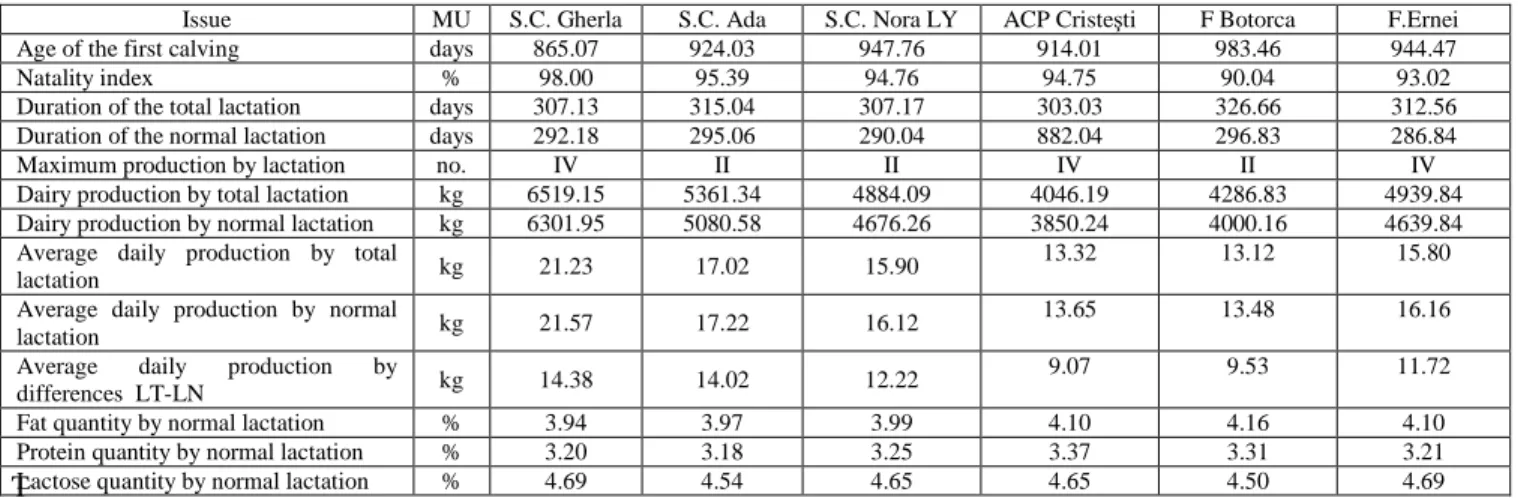
Table 3
The average values by total lactation of some dairy production indices comparative by farms
T
Issue MU S.C. Gherla S.C. Ada S.C. Nora LY ACP Cristeşti F Botorca F.Ernei Age of the first calving days 865.07 924.03 947.76 914.01 983.46 944.47
Natality index % 98.00 95.39 94.76 94.75 90.04 93.02
Duration of the total lactation days 307.13 315.04 307.17 303.03 326.66 312.56 Duration of the normal lactation days 292.18 295.06 290.04 882.04 296.83 286.84
Maximum production by lactation no. IV II II IV II IV
Dairy production by total lactation kg 6519.15 5361.34 4884.09 4046.19 4286.83 4939.84 Dairy production by normal lactation kg 6301.95 5080.58 4676.26 3850.24 4000.16 4639.84 Average daily production by total
lactation kg 21.23 17.02 15.90
13.32 13.12 15.80
Average daily production by normal
lactation kg 21.57 17.22 16.12
13.65 13.48 16.16
Average daily production by
differences LT-LN kg 14.38 14.02 12.22
9.07 9.53 11.72
Table 5. The main dairy production indices in primiparous groups of paternal half sisters
No. Bull Daught. n
AFC days
Dairy production by total lactation Dairy production by normal lactation Reproduction
DIM(days) Milk yield Kg
Fat Protein Lactose DIM (days)
Milk yield Kg
Fat Protein Lactose D.D. (days)
C.I. (days)
% Kg % Kg % Kg % Kg % Kg % Kg
1 51263 25 845.18 ±28.76 324.18 ±12.53 5725.17 ±167.57 3.98 ±0.05 227.86 ±8.17 3.25 ±0.05 186.07 ±7.9 4.60 ±0.06 263.36 ±10.05 287.99 ±4.37 5515.78 ±172.74 3.96 ±0.05 218.42 ±4.63 3.25 ±0.05 179.26 ±5.96 4.60 ±0.06 253.73 ±8.21 57.52 ±17.12 387.17 ±11.81
2 51244 15 922.14 ±13.60 341.54 ±26.55 6146.23 ±298.42 3.97 ±0.07 244.01 ±6.83 3.21 ±0.08 197.29 ±8.64 4.58 ±0.07 281.50 ±9.24 299.98 ±9.54 5363.43 ±217.35 3.95 ±0.08 211.86 ±5.54 3.20 ±0.05 171.63 ±8.36 4.58 ±0.06 245.65 ±10.24 55.72 ±12.46 401.27 ±18.33
3 51638 21 922.08 ±36.16 343.72 ±19.17 5735.42 ±285.36 3.99 ±0.06 228.84 ±10.23 3.24 ±0.07 185.83 ±6.67 4.55 ±0.004 260.96 ±8.41 297.18 ±8.22 5306.37 ±232.73 3.97 ±0.06 210.66 ±4.27 3.22 ±0.06 170.87 ±9.01 4.54 ±0.06 240.91 ±7.48 54.22 ±12.53 399.74 ±10.97
4 51263 40 ±12.44 968.60 ±10.43 323.19 5184.78 ±139.26 ±0.03 4.07 210.76 ±5.24 ±0.02 3.27 169.39 ±5.01 ±0.04 4.62 239.49 ±7.66 291.01 ±2.81 4864.08 ±120.19 ±0.03 4.04 196.75 ±4.37 ±0.02 3.27 159.11 ±4.90 ±0.04 4.62 224.92 ±7.42 ±12.28 70.49 396.72 ±14.93
5 51635 26 946.41 ±14.29 332.69 ±11.45 5237.71 ±169.32 3.99 ±0.03 209.03 ±8.46 3.22 ±0.03 168.86 ±7.36 4.60 ±0.03 240.83 ±4.98 296.75 ±2.64 4929.20 ±147.18 3.97 ±0.03 195.84 ±7.81 3.21 ±0.03 158.26 ±7.85 4.61 ±0.04 227.19 ±4.19 66.96 ±16.94 400.32 ±18.47
6 45145 28 961.14 ±20.82 330.36 ±11.53 4791.71 ±199.31 4.16 ±0.04 199.05 ±8.46 3.45 ±0.04 169.63 ±7.65 4.64 ±0.02 222.34 ±6.78 295.96 ±3.31 4473.35 ±133.88 4.14 ±0.04 184.63 ±5.20 3.52 ±0.04 157.46 ±4.93 4.63 ±0.05 207.12 ±4.79 69.88 ±15.38 402.18 ±15.22
7 50946 40 953.95 ±12.35 340.24 ±10.60 4779.74 ±157.43 4.18 ±0.06 198.74 ±6.65 3.56 ±0.03 170.00 ±5.23 4.58 ±0.03 218.91 ±5.13 297.51 ±2.59 4407.61 ±116.70 4.14 ±0.01 181.62 ±4.75 3.55 ±0.03 156.47 ±4.23 4.59 ±0.04 202.31 ±4.53 70.12 ±10.44 408.78 ±19.15
8 50817 42 997.27 ±13.62 358.88 ±11.51 5397.21 ±197.09 3.77 ±0.05 203.56 ±7.93 3.24 ±0.06 174.87 ±9.14 459 ±0.03 247.73 ±4.67 299.38 ±2.12 4802.96 ±123.33 3.76 ±0.05 179.90 ±4.71 3.19 ±0.04 153.21 ±4.83 4.58 ±0.04 219.98 ±4.97 69.38 ±8.67 401.05 ±11.34
9 50944 39 932.26 ±14.19 353.87 ±14.39 4963.76 ±198.07 4.03 ±0.05 200.52 ±9.78 3.57 ±0.04 177.21 ±10.49 4.53 ±0.03 224.86 ±5.37 296.66 ±2.89 4397.86 ±142.34 3.98 ±0.04 174.76 ±4.83 3.50 ±0.04 153.93 ±4.74 4.55 ±0.04 200.10 ±4098 69.94 ±11.31 404.32 ±12.28
10 50945 36 ±15.28 930.03 ±11.52 327.66 4505.35 ±176.30 ±0.07 4.32 193.39 ±8.17 ±0.02 3.59 165.74 ±6.83 ±0.02 4.63 208.60 ±5.83 291.11 ±4.20 4148.02 ±145.00 ±0.05 4.28 176.32 ±5.11 ±0.03 3.56 147.67 ±4.21 ±0.05 4.61 191.22 ±4.73 V9.15 71.44 398.98 ±18.22
11 51265 28 920.32 ±27.44 321.55 ±15.27 4828.44 ±165.41 4.18 ±0.04 201.86 ±6.87 3.38 ±0.03 163.20 ±8.64 4.68 ±0.02 225.97 ±9.12 287.81 ±2.87 4263.82 ±128.17 4.16 ±0.05 177.37 ±6.27 3.39 ±0.03 144.54 ±6.22 4.68 ±0.03 199.55 ±7.29 79.42 ±6.47 401.87 ±18.15 12
50943 38 948.76 ±20.65 349.11 ±11.33 4585.54 ±158.54 4.29 ±0.06 169.51 ±7.15 3.60 ±0.03 165.03 ±0.3 4.62 ±0.03 211.85 ±6.33 297.22 ±2.37 4101.20 ±108.74 4.26 ±0.06 174.19 ±4.66 3.56 ±0.03 146.00 ±4.13 4.62 ±0.05 189.48 ±5.12 66.38 ±10.11 410.22 ±14.23 13
51576 20 912.72 ±21.16 316.48 ±16.17 4603.38 ±235.11 3.90 ±0.11 179.53 ±8.68 3.20 ±0.07 147.31 ±6.42 4.56 ±0.04 209.91 ±7.47 292.16 ±8.86 4332.44 ±222.12 3.69 ±0.08 159.87 ±4.27 3.20 ±0.07 138.64 ±8.36 4.54 ±0.04 196.69 ±8.74 72.17 ±13.29 392.65 ±27.43 14
51260 18 981.36 ±23.24 328.11 ±11.89 4032.52 ±149.45 4.20 ±0.02 169.37 ±6.97 3.31 ±0.03 133.48 ±6.32 4.51 ±0.03 181.87 ±8.67 296.31 ±2.71 3740.72 ±93.74 4.18 ±0.03 156.36 ±2.73 3.30 ±0.02 123.44 ±8.47 4.53 ±0.02 169.45 ±10.26 76.46 ±7.32 405.22 ±15.64 15
50788 45 950.60 ±18.42 324.40 ±9.75 4152.85 ±170.36 3.76 ±0.02 165.82 ±6.26 2.85 ±0.02 118.36 ±4.93 4.58 ±0.04 190.20 ±5.66 291.26 ±2.52 3830.30 ±132.23 3.74 ±0.03 142.73 ±4.37 2.85 ±0.02 109.16 ±3.92 4.59 ±0.04 175.81 ±6.55 70.12 ±9.11 403.18 ±13.41 16