nProbe nBox and n2disk User’s Guide
Open Source Software and Hardware
NetFlow v5/v9 Probe
and Packet-to-Disk
Version 5.2 April 2009
Table of Contents
...
2.3 Usage 9
...
2.3.1 nProbe Command Line Options 9
...
2.4 Tuning nProbe Performance 20
...
2.5 Frequently Asked Questions 21
...
3 Using nProbe with ntop 22
...
4.1 Main Features 23
...
4.2 Usage 24
...
4.2.1 n2disk Command Line Options 24
...
4.3 Tuning n2disk performance 24
... 5.1 Usage Guidelines 25 ... 5.1.3 Configuration: ntop 33 ... 5.1.4 Configuration: nProbe 36 ... 5.1.6 Configuration: SQL Database 41 ... 5.1.7 Configuration: Firewall 42 ... 5.1.8 Configuration: License 44 ... 5.1.9 Administration: Shell 45 ... 5.1.10 Administration: Services 46 ... 5.1.11. Administration: Update 47 ... 5.1.13 Diagnostics: IPerf 50 ... 5.1.14 Diagnostics: Interfaces 51 ... 5.1.15 Diagnostics: Memory 52 ... 5.1.16 Diagnostics: Status 53 ...
5.2 nBox in pass-through mode 54
...
6. nBox models summary 57
... 7. References 59 ... 8. Credits 59 ... Appendix A 60 ...
BPF Packet Filtering Expressions 60
...
Examples 64
...
Appendix B 65
...
Text Flow Dump Format 65
...
Appendix C 66
...
NetFlow v9/IPFIX Flow Format 66
...
Appendix D 69
...
nBox Firmware Upload into a CF 69
Appendix E 70
...
Introduction
Traffic measurements are necessary to operate all types of IP networks. Network admins need a detailed view of network traffic for several reasonsand some of these could be security, accounting and management. Thetraffic compositions have to be analyzed accurately when estimating traffic metrics or when finding network problems. All of these measurements have to be made by inspecting all the packets flowing into the network trunk analyzed (such as router and/or switches). This analysis could be done on the fly or by logging all the packets and than post-processing them. But with the increasing network capacities and traffic volumes this kind of approach is not suitable for the most cases. Instead similar packets (packets with a set of common properties) can be grouped together composing what il called “flows”. As an example, a flow can be composed of all flowing packets that share the same source and destination address so a flow can be derived using only some fields of a network packet. This way, similar types of traffic can be stored in a more compact format without loosing the information we are interested in. This information can be aggregated in a flow datagram and exported to a collector able to report network metrics in a user-friendly format.
When collected this information provides a detailed view of the network traffic.
Precise network metric measurements are a challenging task so a lot of work has been done in this filed. In commercial environments, NetFlow is probably the de-facto standard for network traffic accounting and billing. NetFlow is a technology originally created by Cisco in 1996 and is now standardized as Internet Protocol Flow Information eXport (IPFIX — RFC 3917). NetFlow is based on the probe/collector paradigm. The probe, usually part of network appliance such as a router or a switch, is deployed on the measured network segment, it sends traffic information in NetFlow format towards a central collector.
nProbe is a software NetFlow v5/v9/IPFIX probe able to collect and aggregate network traffic, and export it using the standard Cisco NetFlow v5/v9/IPFIX format. It is available for most of the OSs on the market (Wndows, Solaris, Linux, MacOSX). When installed on a PC, nProbe turn it into a Network-aware monitoring appliance.
Many users, who used nProbe, realized that running a network probe on a PC is not always the best choice for several reasons:
1.
PCs have moving parts that can break making the probe unavailable.2.
PCs are large, need monitors and keyboards, whereas probes often need to be deployed on places where there is not much space available.3.
Administering PCs is not cheap and they require the purchase of an OS, its installation and maintenance.4.
In large networks divided in several trunks it is necessary to have several probes each analyzing a trunk. This requires that multiple PC running nProbe are deployed across the network.5.
The cost (for both hardware and maintenance) of a PC+nProbe is not neglectable in particular if several probes need to be deployed.6.
In many cases, no technician are available at the monitored site and something plug and play in needed.solution, nBox has been designed and developed.
nBox is based on Linux OS, and thanks to an optimized Linux kernel with the PF_RING module that significantly improves the packet capture process, nBox is able to monitor and analyze network trunks at full speed1 without the need for a hardware accelerator
card.
The nProbe application installed in the nBox server has been optimized and extended with respect to the version of the very popular open-source software. The new nProbe contains some features not included in the open version and the software has been carefully optimized to run on the nBox server.
If you are a user that does not want to bother with installing nProbe on a PC or you need to use a high performance and reliable network probe solution then you are probably an nBox user.
In some environments it would be nice to distribute light network probes on the network that send traffic information towards a central traffic analysis console such as ntop or any other NetFlow/IPFIX compliance collector. In order to satisfy the above requirements nProbe and ntop can be used together.
nBox includes both a NetFlow probe (nProbe) and a collector (ntop) for v5/v9/IPFIX NetFlow flows.
Based on you network speed and traffic volumes different nBox server could be used. Please refer to Chapter 5 of this manual to have an idea of the different nBox configuration and for the typical usage scenario.
nBox can be effectively used:
·
To analyze NetFlow flows generated by your border gateway.·
To replace the embedded, low-speed NetFlow probe available on your router/ switch·
As a NetFlow probe that sends flows towards one or more collectors either ntop or a commercial one (e.g. Cisco NetFlow Collector or HP-OV).·
Both as a probe and collector at the same time. ntop can be used as collector and analyzer for nProbe-generated flows.Finally it is worth to say that nBox is quite easy to administer using the very intuitive embedded web interface. nBox is easy to setup and it is immediately ready to use with little configuration effort. Throughout this document we are going to describe the main components of the nBox web interface.
This manual is divided in three main parts:
·
The first one covers nProbe and it shows how it can be configured and deployed on your network·
The second part covers the usage of nProbe with ntop flows collector2 nProbe
There are two main version of the nProbe probe:
1.
The one that is public available and distributed in both source and binary format (see Appendix E for the license information).2.
The one (nProbe 5.1.3x Pro) distributed only in binary format with the nBox appliance.The first version of nProbe is available for use with no further configuration. On the other hand the Pro version requires an nBox valid license in order to work (please refer to section 4.1.2 for more information about the license).
In the following sections we refer to the version included within nBox that has a different features compared with the public version, both in term of performance and functionalities.
2.1 Main Features
Some of the nProbe features include:
·
Limited memory footprint (regardless of the network size and speed) and CPU savvy.·
Designed for running on environments with limited resources (the nProbe binary < 100 Kb).·
Fully user configurable.·
Fully NetFlow v4/v5/v9 IPFIX compliant.·
High-performance probe: commercial probes included those embedded on routers and switches are often not able to keep up with high-speeds or, when able, their performance decreases dramatically handling small size packets.·
Ability to act as flow collector and proxy·
Ability to natively save flows into MySQL and SQLite, as well as text and binary.·
Native PF_RING support for high speed flow generation·
Support of acceleration cards such as Endace, Mutina Technology, and Tilera.
·
Support of detect protocols via DPI (deep packet inspection) and report protocol name in flows for precise collector protocol accounting·
Ability to forge NetFlow interface Ids based on MAC/IP addresses.·
New nprobe architecture for better performance with respect to previous versions.2.2 What’s New?
Release 5.2 (April 2009)
·
Updated nBox firmware·
Added n2disk 1.0·
Updated nProbe to 5.1x version.·
Removed nDumper Release 5.1 (November 2008)·
Updated nBox firmware·
Updated nProbe to 5.0.x version.·
Added nDumper 0.6.x version.·
Added n2nRelease 5.0 (February 2008)
·
Updated nBox firmware·
Updated nProbe with latest features.·
Updated ntop with latest 3.3.X version. Release 4.0 (July 2007)·
Updated nBox with latest 2.6 kernel series image·
Updated nProbe with 4.9 version coverage. Release 3.9 (April 2005)·
Updated nBox section Release 3.0.1 (February 2004)·
Updated nBox section Release 3.0 (January 2004)·
Added nProbe 3.0 coverage Release 2.2 (October 2003)·
Added nBox coverage Release 2.1 (June 2003)·
Added nFlow support Release 2.0.1 (February 2003)·
Added the ability to save flows on disk (-P flag) Release 2.0 (January 2003)·
Added the ability to select multiple NetFlow collectors.·
Added —p flag for ignoring TCP/UDP ports.·
Added —e flag for slowing down flow export speed.·
Added —u flag for identifying input NetFlow devices into emitted flows.·
Added —a flag for selecting the way flows are exported to several collectors (if defined).·
Added the ability to control an LCD display where the probe can report traffic statistics.·
Enhanced TCP flags support in exported flows. Release 1.3 (July 2002)2.3 Usage
The nProbe probe has to be activated on a PC from where it is possible to capture all the traffic you are interested in. For this reason, in case of switched networks, it is necessary to either mirror traffic (VLAN or port mirror) or place the probe on a location (e.g. closed to the border gateway) where most of the traffic flows.
When activated, nProbe begins to collect traffic data and emit NetFlow in the format specified by the user (v5 if none) flows towards the specified collector. A set of packets with the same (src ip & port, dst ip & port, protocol #) is called flow (note that some protocols such as ICMP have no concept of ports). Every flow, even a very long-standing ISO CD image download, has a limited lifetime; this is because the flow collector should periodically receive flow chunks for accounting traffic precisely.
In the following sections, we discuss all the nProbe 4.9.x Pro command line options and how to efficiently configure nProbe to run on your network.
2.3.1 nProbe Command Line Options
nProbe allows network administrators to precisely tune the flow generation policy. In particular, it is possible to specify a lot of command line options.
Below are listed the available options and a detailed explanation of each option:
# nprobe –h
Welcome to nprobe v.5.1.3 ($Revision: 895 $) for i686-pc-linux-gnu with native PF_RING acceleration.
Built on 01/20/08 03:39:15 PM
Copyright 2002-07 by Luca Deri <[email protected]> Usage:
nprobe -n <host:port|none> [-i <interface|dump file>] [-t <dump timeout>] [-d <idle timeout>] [-l <send timeout>] [-s <scan cycle>] [-N]
[-p <aggregation>] [-f <filter>] [-a] [-b <level>] [-G] [-O <# threads>] [-X] [-P <path>] [-F <dump timeout>] [-D <format>]
[-u <in dev idx>] [-Q <out dev idx>]
[-I <probe name>] [-v] [-w <hash size>] [-e <flow delay>] [-B <packet count>] [-z <min flow size>] [-M <max num flows>][-R <payload Len>]
[-x <payload policy>] [-E <engine>] [-C <flow lock file>] [-m <min # flows>][-q <host:port>]
[-S <sample rate>] [-A <AS list>] [-g <PID file>] [-T <Flow Template>] [-U <Flow Template Id>]
[-o <v9 Templ. Export Policy>] [-L <local nets>] [-c] [-r] [-1 <MAC>@<ifIdx>][-3 <port>]
[--collector|-n] <host:port|none> | Address of the NetFlow collector(s).
| Multiple collectors can be defined | using multiple -n flags.
| In this case flows will be sent in | round robin mode to all defined | collectors if the -a flag is used. | Note that you can specify both IPv4 | and IPv6 addresses.
| If you specify none as value, | no flow will be export; in this case
| the -P parameter is mandatory. [--interface|-i] <iface|pcap> | Interface name from which
| captured, or .pcap file (debug only)
[--lifetime-timeout|-t] <timeout> | It specifies the maximum (sec.) flow
| lifetime [default=120]
[--idle-timeout|-d] <timeout> | It specifies the maximum
(sec.) flow
| idle lifetime [default=30] [--queue-timeout|-l] <timeout> | It specifies how long expired
flows
| (queued before delivery) are emitted
| [default=30]
[--scan-cycle|-s <scan cycle>] | It specifies how often
(sec.) expired
| flows are emitted [default=30]. | If -P is used, the scan cycle will be
| set to the value of the -F parameter
[--rebuild-hash|N] | Rebuild the hash at each scan. | Useful for producing flows that
last
| as the scan cycle as netflow | collectors do. This option is ignored
| when -P is not used.
[--aggregation|-p] <aggregation> | It specifies the flow aggregation level:
|<VLAN-d>-<proto>/<IP><port><TOS>/ <AS>
| where each element can be set to
| 0=ignore or 1=take care. | Example '-p 1/0/1/1/1/1' | ignores the protocol, whereas | '-p 0/0/1/0/0/0' ignores everything
| but the IP
[--bpf-filter|-f] <BPF filter> | BPF filter for captured packets
| [default=no filter]
[--all-collectors|-a] | If several collectors are defined,
| this option gives the ability to send
| all collectors all the flows. | If the flag is omitted collectors are
| selected in round robin. [--verbose|-b] <level> | Verbose output:
| 0 - No verbose logging | 1 - Limited logging (traffic stats.)
| 2 - Full verbose logging [--daemon-mode|-G] | Start as daemon.
[--num-threads|-O] <# threads> | Number of packet fetcher threads
| [default=1].
[--dump-path|-P] <path> | Directory where dump files will be stored.
[--dump-frequency|-F] <dump timeout> | Dump files dump frequency (sec). | Default: 60
[--dump-format|-D] <format> | <format>: flows are saved as: | b : raw/uncompressed flows
| d : SQLite
| Example: -D b. Note: this flag has
no
| effect without -P.
[--in-iface-idx|-u] <in dev idx> | Index of the input device used in the
| emitted flows (incoming traffic). | If no value is set, the input device
| is dynamically set to the last two | bytes of the MAC address of the flow
[--out-iface-idx|-Q] <out dev idx> | Index of the output device used in the
| emitted flows (outgoing traffic). | If no value is set, the output device
| is dynamically set to the last two | bytes of the MAC address of the flow
| receiver.
[--vlanid-as-iface-idx] | Use vlanId (or 0 if the traffic is | not tagged) as interface index. | Note that this option supersedes | the --in/out-iface-idx options [--nprobe-version|-v] | Prints the program version. [--flow-lock|-C] <flow lock> | If the flow lock file is present
| no flows are emitted. This facility is
| useful to implement high availability
| by means of a daemon that can create
| a lock file when this instance is | standby.
[--help|-h] | Prints this help.
[--syslog|-I] <probe name> | Log to syslog as <probe name> | [default=stdout]
[--hash-size|-w] <hash size> | Flows hash size [default=4096]
[--flow-delay|-e] <flow delay> | Delay (in ms) between two flow | exports [default=0]
[--count-delay|-B] <packet count> | Send this many packets before | the -e delay [default=0]
[--min-flow-size|-z] <min flow size> | Minimum TCP flow size (in bytes). | If a TCP flow is shorter than the | specified size the flow is not
| emitted [default=unlimited]
[--max-num-flows|-M] <max num flows> | Limit the number of active flows.
| This is useful if you want to limit | the memory or CPU allocated to nProbe
| in case of non well-behaved | applications such as worms or DoS | [default=4294967295]
[--payload-length|-R] <payload Len> | Specify the max payload length
| [default: 0 bytes]
[--payload-policy|-x] <policy> | Specify the max payload export policy.
| Format: TCP:UDP:ICMP:OTHER where all
| parameters can be set to:
| 0: no payload for the selectedprotocol
| 1: payload for the selected protocol
| 2: payload for TCP sessions with SYNflag
| Example -x 2:0:0:0 [default=2:0:0:0]
[--netflow-engine|-E] <engine> | Specify the engine type and id. | The format is engineType:engineId.
| [default=0:0]
[--min-num-flows|-m] <min # flows> | Minimum number of flows per packet | unless an expired flow is queued
| for too long (see -l) [default=30
| for v5, dynamic for v9]
[--sender-address|-q] <host:port> | Specifies the address:port of the flow
| sender.This option is useful for
hosts
| with multiple interface or if flows
| must be emitted from a static port
[--sample-rate|-S] <sample rate> | Rate at which captured packets are. | processed Default: 0 [no sampling] [--as-list|-A] <AS list> | File containing the list of known ASs.
[--flow-templ|-T] <Flow Template> | Specify the NFv9 template (see below).
[--flow-templ-id|-U] <Temp. Id> | Specify the NFv9 template identifier
| [default: 257]
[--flow-version|-V] <version> | NetFlow Version: 5=v5, 9=v9, 10=IPFIX
[--flows-intra-templ|-o] <num> | Specify how many flow pkts are | exported between template exports | [default: 10]
[--local-networks|-L] <networks> | Specify the local networks (see -c
| and -r options)
[--local-hosts-only|-c] | All the IPv4 hosts outside the local
| network lists will be set to 0.0.0.0
| (-L must be specified before -c).
| This reduces the load on the probe | instead of discarding flows on the | collector side.
[--local-traffic-direction|-r] | All the traffic going towards the
| local networks (-L must also be
| specified before -r) is assumed
| incoming traffic all the rest is | assumed outgoing (see also u and -Q).
[--src-mac-address|-1] <MAC>@<ifIdx> | Flow source MAC address (see below) [--count|-2] <number> | Capture a specified number of packets
| and quit (debug only)
[--nf-collector-port|-3] <port> | NetFlow collector port: incoming port
[--remote-collector-port|-5] <port> | Remote pcap client: incoming port [--no-promisc|-6] | Capture packets in non-promiscuous
| mode
[--dump-stats|-9] <path> | Periodically dump traffic stats into
| the specified file
[--black-list]<networks> | All the IPv4 hosts inside the networks
| black-list will be discarded.
| This reduces the load on the probe
| instead of discarding flows on the
| collector side.
[--mysql] <h>:<d>:<t>:<u>:<p> | Enable MySQL database support. | h: host name
| d: database name | t: table name prefix | u: user name
| p: user password
1.
-n: collector addressesThis specifies the NetFlow collectors addresses to which nProbe will send the flows. If more than one is specified, they need to be separated with a comma or the —n flag can be repeated several times (e.g. -n 172.22.3.4:33,172.22.3.4:34 and -n 172.22.3.4:33 —n 172.22.3.4:34 are equivalent). When multiple collectors are defined, you can control the way flows are exported using the —a option (see below); if on a collector address the destination port is omitted, flows are sent to 2055 port and whereas if all the option is not specified, by default, flows are sent to the loopback interface (127.0.0.1) on port 2055. If this parameter is used, nProbe exports flows towards collector running at 127.0.0.1:2055.
2.
-i: interface nameIt specifies the interface from which packets are captured. If -i is not used, nProbe will use the default interface (if any). In case a user needs to activate nProbe on two different interfaces, then it needs to activate multiple nProbe instances once per
packets will be read.
3.
-t: maximum flow lifetimeRegardless of the flow duration, a flow that has been active for more that the specified maximum lifetime is considered expired and it will be emitted. Further packets belonging to the same flow will be accounted on a new flow.
4.
-d: maximum flow idle lifetimeA flow is over when the last packet received is older that the maximum flow idle lifetime. This means that whenever applicable, (e.g. SNMP walk) UDP flows will not be accounted on 1 packet/1 flow basis, but on one global flow that accounts all the traffic. This has a benefit on the total number of generated flows and on the overall collector performance.
5.
-l: maximum queue timeoutIt specifies the maximum amount of time that a flow can be queued waiting to be exported. Use this option in order to try to pack several flows into fewer packets, but at the same time have an upper bound timeout for queuing flows into the probe.
6.
-s: flows scan cycleThis flag specifies how often expired flows are emitted towards the specified collector.
7.
-N: rebuild the hash at each scanIn this case at each scan cycle (-s) the hash is rebuilt from scatch
8.
-p: flow aggregationFlows can be aggregated both at collector and probe side. However probe allocation is much more effective as it reduces significantly the number of emitted flows hence the work that the collector has to carry on. nProbe supports various aggregation levels that can be selected specifying with the —p flag. The aggregation format is <vlanid>/ <proto>/<IP>/<port>/<TOS>/<AS> where each option can be set to 0 (ignore) or 1 (take care). Ignored fields are set to a null value. For instance the value 0/0/1/0/0/0 is useful for creating a map of who’s talking to who (network conversation matrix).
9.
-f: packet capture filterThis BPF filter (see the appendix for further information about BPF filters) allows nProbe to take into account only those packets that match the filter (if specified).
10.
-a: select flow export policyWhen multiple collectors are defined (see —n option), nProbe sends them flows in round robin. However it is possible to send the same flow to all collectors as a flow redirector does if the —a option is used.
11.
-b: enable verbose loggingUsing this flag, nProbe generates verbose output that can be used to tune its performance (see chapter 2.4). Zero is the lowest level (little information is printed), 1 displays traffic statistics, 2 is really verbose. Example of traffic statistics:
04/Jul/2007 18:16:00 [nprobe.c:1129] Average traffic: [1.7 pkt/sec][1 Kb/sec] 04/Jul/2007 18:16:00 [nprobe.c:1134] Current traffic: [1.9 pkt/sec][1 Kb/sec] 04/Jul/2007 18:16:00 [nprobe.c:1140] Current flow export rate: [0.9 flows/sec] 04/Jul/2007 18:16:00 [nprobe.c:1144] Buckets:
[active=13][allocated=21][free=8][toBeExported=0][frags=0] 04/Jul/2007 18:16:00 [nprobe.c:1149] Fragment queue: [len=0]
04/Jul/2007 18:16:00 [nprobe.c:1153] Num Packets: 111 (max bucket search: 0) 04/Jul/2007 18:16:00 [nprobe.c:1170] 115 pkts rcvd/0 pkts dropped
12.
-G: start nprobe as a daemon. Useful when starting nprobe as daemon.13.
-O: set the number of threads that fetch packets out of the network interface. In general: the more threads are available, the better is the performance. However it is not suggested to have too many threads as in some platforms this can slow down the probe. Start with 1 and increase it if necessary.14.
-P: dump flowsThis path specifies the directory where flows will be dumped. The dump format is a 4 bytes number that specifies the flow length and then the raw flow. nProbe comes with a simple file for reading dumped flows. This option is useful for saving flows on disks for further processing with tools such as flow-tools.
15.
-F:It specifies the frequency at which files are dumped on disk
16.
-D: dump flows formatFlows stored on disks can be stored in two formats: text with user-specified format or SQLite format. Using flow SQLite format (-D d) can significantly reduce the size of stored files, although all the collectors might not support this format. Text flows (-D b) are the safest setting if you want to use a standard collector able to read flows dump on disk. In order to let the user specify the more appropriate format, nProbe allows users to define the flow format similar to what C programmers do. The available options are specified in Appendix B. Note that this flag has no effect unless —P is used.
17.
-u: input device indexThe NetFlow specification contains a numeric index in order to identify flows coming from different interfaces of the same probe . As multiple nProbe instances can be started on the same host but on different devices, the collector to divide flows according to interface number can use this flag. If —u is not used, then nprobe will use as interface index the last two bytes of the mac address of the flow sender.
18.
-Q: output device indexSimilar to —u but for the output interface.
19.
-v: print versionThis flag is used to print the nProbe version number and date.
20.
-C: flow export lockThis is a simple way to implement high-availability. Start two probes capturing the same data. The master probe emit flows, the slave probe is started with —C <path>. As long as <path> exists, the slave works but no flow is emitted. If the <path> file is deleted (e.g. using an external program for controlling the master/slave such as heartbeat) the slave starts emitting flows. If the file is restored, the slave is silent again.
22.
-I: log to syslognProbe logs on stdout unless the —g flag (see above) is used. If the syslog needs to be used instead of a file, this flag instruments nProbe to log on it using the specified name (this is useful when multiple nProbe instances are active on the same host). Please note that —g is ignored if —I is used, and this option is not available on nProbe for Win32.
23.
-w: size of the hash that stores the flowsThe default size is 16384 and it should be enough for most of networks. In case flows are not emitted often and with strong traffic conditions it would be necessary to increase the hash. In general, it is a good practice to set hashes whose size is a multiple of the original size (i.e. do not extend the hash to 17000, but rather make it 32000 buckets large). See the following chapter for knowing more about nProbe tuning.
24.
-e: flow export delaySome collectors cannot keep up with nProbe export speed. This flag allows flows to be slow down by adding a short delay (specified in ms) between two consecutive exports. The maximum allowed delay is 1000 ms.
25.
-B: packet count delayIt specified how many flow packets need to be sent before —e is applied,
26.
-z: minimum TCP low sizePeer-to-peer applications, attacks or misconfigured applications often generate a lot of tiny TCP flows that can cause significant load on the collector side. As most collector setups often discarded those flows, it is possible to instrument nProbe via the —z flag not to emit such flows. Note that the —z flag affects only the TCP protocol (i.e. UDP, ICMP and other protocols are not affected).
27.
-M: maximum number of active flowsIt is used to limit the maximum number of concurrent flows that the probe can sustain. This is useful for preventing the probe from creating as many flows as needed and hence to take over all the available resources.
28.
-R/-x: used to specify how to handle packet payload.This is useful for tuning those plugins (e.g. VoIP) that need payload inspection.The —R flag specifies the maximum length of the payload that can be stored into a flow. The — x option allows to tune the payload export . Its format is a:b:c:d where a is the export policy for TCP, b for UDP, c for ICMP and d for other protocols (e.g. IGMP). Each format value can be set to 0 (no payload export for the selected protocol) and 1 (export payload for the selected protocol). For TCP it is also possible to specify 2 to enable payload export for TCP sessions with SYN flag (e.g. export the initial payload of a TCP connection).
29.
-E: netflow engineSpecify the netflow engineType:engineId into the generated flows.
In order to minimize the number of emitted packets containing flows, it is possible to specify the minimum number of flows that necessarily need to be contained in a packet. This means that the packet is not emitted until the specified number of flows is reached.
31.
-q: flow sender addressThis option is used to specify the address and port from which the packets containing flows are coming from. Usually the operating systems prevents people from sending packets from addresses different from those assigned to the network interfaces.
32.
-S: sample ratenProbe uses all the captured packets for calculating flows. In some situations (e.g. strong traffic conditions) it is necessary to reduce the number of packets that need to be handled by nProbe. This option specifies the sampling rate, i.e. the number of packets that are discarded between two packets used to produce flows.
33.
-A: AS fileNetwork probes are usually installed on systems where the routing information is available (e.g. via BGP) in order to specify the AS (Autonomous System) id of the flow peer. As nProbe has no access to BGP information, users need to provide this information by means of a static file whose format is <AS>:<network>. AS information can be retrieved from routers using publicly available tools (e.g. Juniper routers allow BGP information to be retrieved using JunoScript) and saved on a file for nProbe access. The file can be stored in both plain text and gzip format.
34.
-g:It specifies the path where nProbe will save the process PID.
35.
-T: flow template definitionContrary to NetFlow v5 where the flow format is fixed, NetFlow V9 and IPFIX flows have a custom format that can be specified at runtime using this option as specified in appendix C.
36.
-U: flow template idNetFlow v9 and IPFIX flows format is specified in a template whose definition is sent by nProbe before to start sending flows. The flow format is defined by —T, where —U is used to set the template identifier. This option should not be used unless the default template value (257) needs to be changed.
37.
-V: flow export versionIt is used to specify the flow version for exported flows. Supported versions are 5 (v5), 9 (v9) and 10 (IPFIX).
38.
-o: intra templates packet export.It specifies the number of flow packets that are exported between two templates export.
39.
-L: local networksUse this flag to specify (format network/mask, e.g. 192.168.0.10/24) the list of networks that are considered local (see —c).
This is useful when it is necessary to restrict the traffic analysis only to local hosts.
41.
-r: set traffic directionWhen this option is used (-L must be specified before —r), all the traffic that goes towards the local networks is considered incoming, all the rest is outgoing. This has effect on the —u/-Q that are then forced with —r.
42.
-1: specify a mapping between MAC address/Interface indexIn mirrored environments, it is possible to simulated a switched environment by playing with MAC addresses. This option allows users to bind a MAC address to a specified interfaceId. For instance AA:BB:CC:DD:EE:FF@3 binds the MAC address AA:BB:CC:DD:EE:FF to port 3. This way it is possible for instance to simulate the fact that the all the traffic (regardless of the IP address) that is routed by a router with MAC AA:BB:CC:DD:EE:FF is flowing through interfaceId 3. Note that -1 can be specified multiple times.
43.
-2: debug onlyLet the probe capture only up to the specified number of packets.
44.
t-3 NetFlow collector portIt is now possible to use the nProbe as NetFlow proxy. With -3 we can se the incoming NetFlow port on which flows are received instead of sniffing packets. nProbe is able to convert flows from various versions. For instance “nprobe -3 2055 —i 192.168.0.1:2056 —V 10” converts each flow received on port 2055 to IPFIX and sends them to 192.168.0.1:2056.
45.
-5:Let the probe to receive captured packets from a remote pcap client.
46.
-6:With this option nProbe does not use promiscuous mode to capture packets.
47.
-9:dump some flow statistics on filePeriodically dump NetFlow statistics on the specified file. The format of the file is: <time when the flow was emitted,total packets,total bytes,total flows>
48.
- -vlanid-as-iface-idx:Using this option you tell nProbe to use the VLAN id as NetFlow interface index.
49.
- -black-list:With this option you can specify a list of networks or hosts from which all the incoming packets will be discarded by the probe. The accepted notation can be CIDR format or the classical network/netmask format.
50.
- -mysql: enable MySQL database support configuration.Using this option the emitted flows will be dumped on the specified MySQL database.
As some people prefer to have a configuration file containing the options that otherwise would be specified on the command line, it is also possible to start nProbe as follows:
where the configuration file contains the same options otherwise specified on the command line. The only difference between the command line and the configuration file is that different options need to be specified on different lines. For instance:
nprobe —n 127.0.0.1:2055 —i en0 —a -p
is the same as:
nprobe /etc/nprobe.conf
where /etc/nprobe.conf contains the following lines:
# cat /etc/nprobe.conf
-n=127.0.0.1:2055 -i=en0
-a= -p=
Note that flags with no parameter associated (e.g. —a) also need to have ‘=’ specified. Any standard NetFlow collector (e.g. ntop) can be used to analyze the flows generated by nProbe. When used with ntop, the nProbe can act as a remote and light traffic collector and ntop as a central network monitoring console. See chapter 3 for further information about this topic.
2.3.2 nProbe on Windows
Some Windows versions NT/2K/XP/Vista support the concept of service. nProbe is activated as service or application depending on the Windows version. The nProbe installer registers the service and creates an entry on the Start menu. On Windows 95/98/ ME, nProbe can activated only on a console or on a batch file, whereas on NT/2K/XP/ Vista can also be activated as a service (default).
E:\ntop\Source\nprobe\Debug>nprobe /h
Available options:
/i [nprobe options] - Install nprobe as service /c [nprobe options] - Run nprobe on a console /r- Deinstall the service
Example:
Install nprobe as a service: 'nprobe /i -i 0 -n 192.168.0.1:2055' Remove the nprobe service: 'nprobe /r'
Notes:
1.
Type 'nprobe /c -h' to see all options2.
In order to reinstall a service with new options it is necessary to first remove the service, then add it again with the new options.3.
Services are started/stopped using the Services control panel item.If nProbe is started on the console, the /c flag needs to be used (e.g. nprobe /c —n 127.0.0.1:2055). If used as service, the command line options need to be specified at service registration and can be modified only removing and adding the service. The nProbe installer registers nProbe as a service with the default options. If you need to change the nProbe setup, you need to do as follows:
nprobe /r Remove the service
nprobe /i <put your options here> Install the service with the specified options.
Services are started and stopped using the Services application part of the Windows administrative tools.
As network interfaces on Windows can have long names, a numeric index is associated to the interface in order to ease the nProbe configuration. The association interface name and index is shows typing the ‘nprobe /c —h’
C:\ntop\nprobe\Debug>nprobe.exe/c -h Running nProbe for Win32.
Welcome to nprobe v.5.1.3 for Win32 Built on 05/03/07 10:35:28
Copyright 2002-07 by Luca Deri <[email protected]> […]
Available interfaces:
[index=0] 'Adapter for generic dialup and VPN capture' [index=1] 'Realtek 8139-series PCI NIC'
For instance, in the above example the index 1 is associated to the interface Realtek 8139-series PCI NIC, hence in order to select this interface nprobe needs to be started with —i 1 option.
2.4 Tuning nProbe Performance
As nProbe can be deployed on very different environments, it is necessary to tune it according to the network where is active. In order to achieve a good probe setup, it is necessary to understand how nProbe is working internally. Each captured packet is analyzed, associated to a flow, and stored onto a hash. Periodically, the hash is analyzed and expired flows are emitted2. The hash size is static (-w flag)3 as this allows nProbe to:
·
Allocate all the needed memory at startup (this is compulsory on embedded systems where memory is limited and it is necessary to know at startup whether a certain application can operate with the available resources).·
Avoid exhausting all the available memory in case of attacks that can produce several flows.Selecting the hash size is a matter of trade-off between efficiency (an efficient hash is at least 1/3 empty) and memory usage. This statement does not mean that a huge hash is always the solution as the flow export process can be slower (and more CPU cycles are needed) as a large hash needs to be explored.
On the other hand, the hash size is just a part of the problem. In fact, the hash fill percentage can be also controlled by other factors such as:
·
Reducing the flow lifetime (-t)·
Reducing the maximum flow idle time (-d)·
Increasing how often the hash is walked searching expired flows (-s)nProbe allows users to ease the tuning process by printing the status of internal hashes using the —b flag. Users who experience severe nProbe performance problems, packet loss or high CPU usage, should start nProbe with —b in order to find out whether their probe setup is optimal.
2 It is worth to remark that packets are captured while nProbe performs flow export (i.e. packet
capture is not stopped during flow export).
3 Note that as of nProbe 4.x the basic hash has a static size specified by –w that can grow as needed
2.5 Frequently Asked Questions
1.
Q: I’m sending 60 bytes ping packets using ‘ping —s 60’ but nProbe reports 92 bytes packets.2.
A: nProbe counts the packet size at IP level. An ICMP Echo Request packet with 60 bytes payload is 92 bytes long.3.
Q: I need to capture traffic from several interfaces but nProbe allows just one interface to be used. What can I do?4.
A: You can start several instances of nProbe, each on a different network interface.5.
Q: nProbe is exporting flows too fast and my collector cannot keep up with it. How can I slow down nProbe export rate?6.
A: nProbe has been for high-speed networks (1Gb and above) so its export rate can be high due to traffic conditions. There are several solutions available:a.
Specify a minimum intra-flow delay (-e flag)b.
Use several collectors and send them flows in round robin (-n flag) in order to balance load among the collectors.3 Using nProbe with ntop
On the Internet there are several NetFlow collectors (see Reference paragraph) that can be used to handle flows generated by nProbe. Among them ntop is included. This section explains how to configure ntop to take advantage of nProbe.
Fig. 1— Using ntop with nProbe
Suppose to run ntop on host whose IP address is a.b.c.d and nProbe on host e.f.g.h (note: both ntop and nProbe can run on the same host).
ntop Configuration
From the ntop menu select the entry Plugins, than NetFlow and than the View/ Configure link. Note that you have to enable the NetFlow plugin by clicking on the Activate link on the same menu. On the plugin you need to specify the collector port, i.e. the UDP port on which nProbe will send the flows. If you want ntop to display NetFlow data it receives from nProbe, you must specify the UDP port to listen to. The default port used for NetFlow is 2055, if you want you can choose this port or another port you like. It is important to explicit set the port and click on the Set Port button. You are done: ntop will now wait for flows sent by nProbe. Remember that ntop will collect flows on a virtual NetFlow interface and not on the default interface. If you want to select this interface you need to go into the Admin menu and select Switch Interface and click on the desired NetFlow interface.
nProbe Configuration
The nProbe configuration is the simplest is possible: nprobe —n a.b.c.d:2055 where a.b.c.d is the IP address where ntop is running. If needed, you can add further flags (e.g. —i to select a different interface from which flows are captured).
4 n2disk
N2disk is a network traffic disk recorder application. With n2disk you can capture full-sized network packets at gigabit rate from a live network interface, and write them into files without any packet loss. N2disk has been designed to write files into disks for very long periods, you have to specify a maximum number of distinct file that may be written during the execution, and if n2disk reaches the maximum number of files, it will start recycling the files from the oldest one. This way you can have a complete view of the traffic for a fixed temporal window, knowing in advance the amount of disk space needed.
n2disk uses the industry standard PCAP file format to dump packets into files so the resulting output can be easily integrated with existing third party or even open/source analysis tools (like Wireshark or nTop).
n2disk has been designed and developed mainly because most network security systems rely on capturing all packets (both header as payload), since any packets may have been responsible for the attack or could contain the problems that we are trying to find. Netflow information is more manageable and requires less disk space to be stored, but in some cases, like deep-packet-inspection analysis or controlled traffic regeneration, it is not useful. When we need to collect the entire packet, because we need all the information, n2disk have to be used.
n2disk can be effectively used to perform numerous activities, among these:
·
Off-line network packets analysis by feeding a specialized tools line Snort or nTop·
Reconstruct particular communication flows or network activities·
Reproduce the previous captured traffic to a different network interface4.1 Main Features
Some of the n2disk features include:
·
Fully user configurable.·
Use of the standard PCAP file format.·
High-performance packet to disk recording.·
Support for timed disk dumping based on network throughput condition
(both Mbits and pps).
·
BPF filters supports (using the same format as in the popular tcpdump tool)
to filter out the unwanted network packets from the recording process.
·
Multi-core support. n2disk has been designed with multicore architectures
in mind. It uses 2 threads: one for the packet capture and one for the disk
writing. The communication between the two threads has been careful
optimized.
·
PF_RING kernel module acceleration. n2disk exploit the packet capture
acceleration offered by the PF_RING linux kernel module.
·
Direct-IO disk access. n2disk uses the Direct IO access to the disks in order
to obtain maximum disk-write throughput.
4.2 Usage
In order to save all the traffic into disks, the n2disk application has to be
activated on an interface from which it is possible to see/capture all the traffic you
are interested in. Once activated
,n2dsik will save the traffic data into the specified
directory recycling the files already written starting from the oldest one, this in case
the maximum number of created files is reached.
In the following sections, we discuss all the n2disk 1.x command line options
and how to efficiently configure n2disk to capture all the traffic flowing in your
network.
4.2.1 n2disk Command Line Options
Below are listed the available options and a detailed explanation of each option:
n2disk v.1.0 ($Revision: 962 $) [-v] [-V] [-h] [-i <device>] [-s <snaplen>] [-f <filter>] [-b <buffer len>] -o <dir>
-p <pcap file len> [-t <sec>] [-a] [-m <max files>] [-n <max dirs>]
[-x <file prefix>] [-y <sample rate>] [-r]
Usage:
-v | Verbose
-V | Print application version -h | Help
-i <device> | Ingress packet device -s <snaplen> | Max packet capture length
-f <filter> | BPF (tcpdump-like) ingress packet filter -b <buffer len> | Buffer length (MBytes)
-o <directory> | Directory where dump files will be saved -p <pcap file len>| Max pcap file length (MBytes)
-t <seconds> | Max pcap file duration (sec).
| Default is 0 that means no max duration -a | Archive pcap file (rename to .old) instead | of overwriting if already present on disk -m <max files> | Max number of files before restarting file name -n <max dirs> | Max number of nested dump sub-directories -x <file prefix> | Dump file prefix
-y <sample rate> | Packet sample rate (e.g. 100 means 1:100 sampling) -r | Disable Direct I/O (experts only)
Example:
# ./n2disk -o /tmp/dumper -p 10
4.3 Tuning n2disk performance
In order to achieve a good n2disk setup able to obtain the maximum performance on a given nBox appliance, it is important to take into account the following aspects.
network interface, so it is particularly important, especially in case of many small packets per second, to reserve enough ring buffer space inside the kernel. Furthermore, in order to reduce the number of clock-cycles needed to capture the packets and cross the network stack, it is possible to turn off the PF_RING Transparent Mode flag. Please refer to the General configuration section to see how to change these values.
Regarding the n2disk start-up parameters particularly important are the following options:
·
-bThe buffer lenght has to be big enough. 1Gbytes is sufficient in most cases.·
-cThe write chunk size has to be greater than of equal to 64Kbytes.·
-p. The maximum file size should be not very small. A good value is greater than 64Mbytes.·
-m The number of files per directory should be not very high.Finally, turn on the IRQ Affinity radio button in the n2disk configuration page, in order to send the disk interrupts to the CPU core where the disk-dumper thread is running.
5. Using the nBox
This section describes how to use the nBox web interface. nBox is a customized version of the Linux operating system (based on GNU/Linux Debian) modified to use the PF_RING kernel module that acts as a packet capture accelerator. nBox hosts the ntop collectorand the nProbe Pro network probe.
5.1 Usage Guidelines
Using the nBox is very simple. Startup the box and connect an Ethernet cable to it. From another PC open a web browser and go to http://192.168.160.10/ (this is the default IP address of your nBox), otherwise use SSH to connect to your box.
Fig. 2— Initial nBox web page
The default nBox configuration is the following:
1.
IP address 192.168.160.102.
Default SSH user is root with password nbox3.
Default Web user is admin with password nboxYou can change the nBox configuration using the web interface, or if you are a power user using the command line interface.
When you enter the box main page you can find on the left side a list of links divided in three main sections: Configuration, Administration and Diagnostics.
The Configuration section includes the following links:
1.
General: general nBox configuration (network, DNS, timezone,etc)2.
Users: add remote and manage web and console users3.
ntop: basic ntop configuration page4.
nProbe: allows to fully configure nProbe on the box5.
n2disk: allows to fully configure n2disk6.
n2n: Network-2-Network VPN configuration9.
High-Availability: allows to configure nBox in High-Availability service10.
Firewall: nBox firewall configuration11.
License: allows registering the license or finding out the nBox license code. The Administration section includes the following links:1.
Shell: jave-based nBox shell2.
Logout: logout from the web interface3.
Reboot: allows to restart the nBox4.
Shutdown: allows to power-off the nBox5.
Services: allows to start/stop/restart the nBox services6.
Update: packages update7.
Configuration: backup/restore system configuration The Diagnostics section includes the following links:1.
IPerf: network performance measure tool2.
Network: simple network diagnostic tools3.
Interfaces: network interface information (historical graphs)4.
Memory: shows memory usage (historical graph)5.
Live Graphs: shows cpu and network interfaces utilization6.
Information: report nBox system information7.
Status: allows to download the current status of the system configuration In the following pages we describe the most important things related to each section.5.1.1 Configuration: General
your nBox. In particular you can specify and configure the following things:
·
The host name of the box.·
The time zone.·
A list of NTP servers to use to keep the box synchronized.·
Enable or disable SSH access (enabled by default).·
Telent/FTP access (both services are disabled by default).·
PF_RING Acceleration (enabled by default).·
The IP address of the management interface (the address could be a static address or a dynamic one by enabling the DHCP service).·
Enable or disable IP forwarding for the management interface (disabled by default).·
Enable or disable pass-through mode (disabled by default).·
Enable or disable network aggregation also known as Bonding (disabled by default).·
The address for all network interfaces installed on your box other then the management one.·
The primary and secondary DNS service and the nBox domain name·
The remote syslog serverPlease refer to paragraph 4.2 to know the “pitfalls” related to the configuration of the nBox in pass-through mode.
In the section PF_RING Acceleration of the General configuration page you can change the number of ring slots in the PF_RING internal buffer and disable the Transparent Mode behavior. Note that by disabling Transparent Mode, you might improve packet capture performance, but you can only use the interface, on which PF_RING has been enabled, for capturing packets and not for transmitting data.
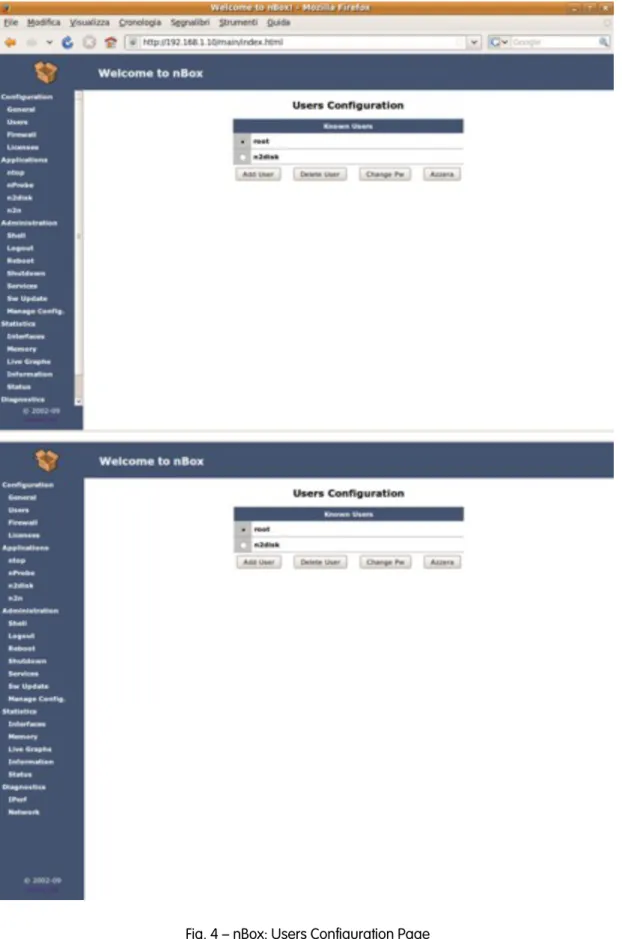
5.1.2 Configuration: Users
Users (both web and shell) can be added or removed using the Users configuration menu.
Fig. 4 — nBox: Users Configuration Page
By default there is only the root user enabled in your Box for console or shell access and the admin user enabled for web access.
·
Add a new user·
Remove a user·
Change the password for a user.·
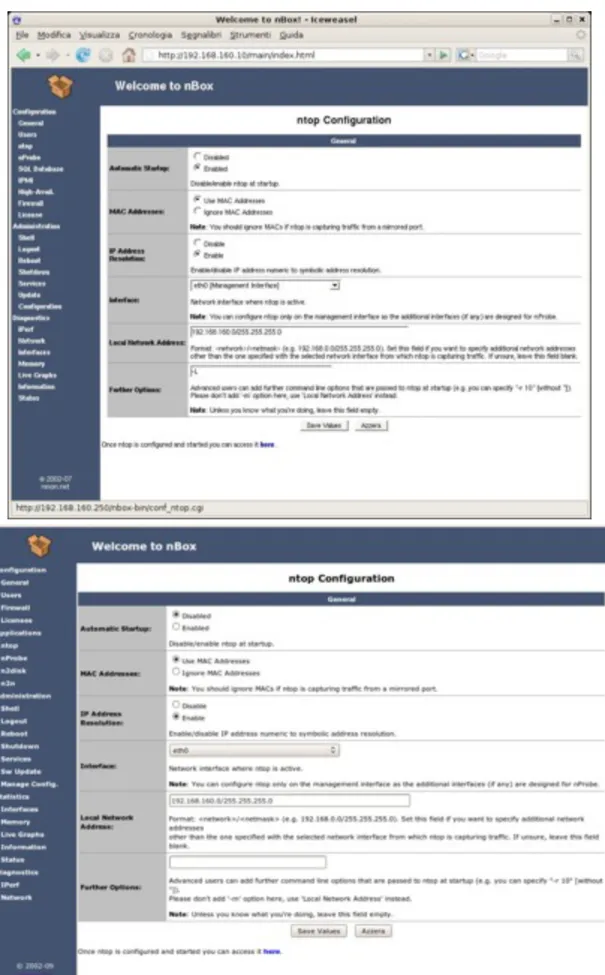
Reset the password for a user (next time the user will access the box he will be prompted to insert a new password).5.1.3 Configuration: ntop
A simple configuration page for ntop allows you to configure the basic ntop start-up parameters and also access the ntop GUI, if it is enabled and running.
Important notes about ntop usage:
·
The ntop included into the nBox has been designed mostly as a network debugging tool as the box (usually) lacks of a hard disk hence ntop cannot save persistent data.·
In case the box does not have an hard-disk installed, ntop saves temporary data in a ramdisk mounted on the /var/log/ntop directory. If this directory gets full ntop stops as it cannot operate. The default ramdisk size is around 64 Mbytes. If you want to increase its size edit the file /etc/fstab.Note that for fine tuning ntop configuration, you have to use the embedded ntop configuration page.
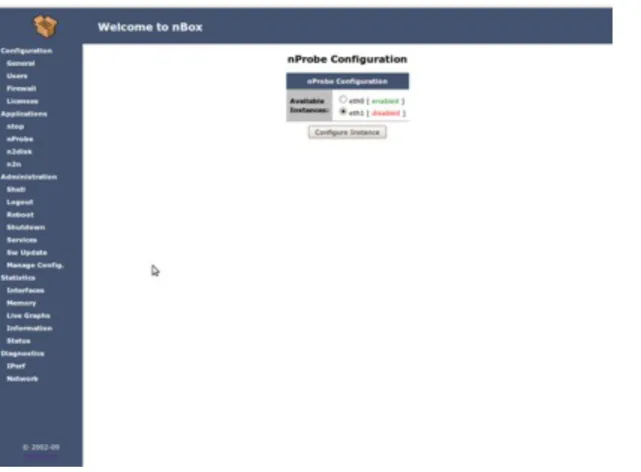
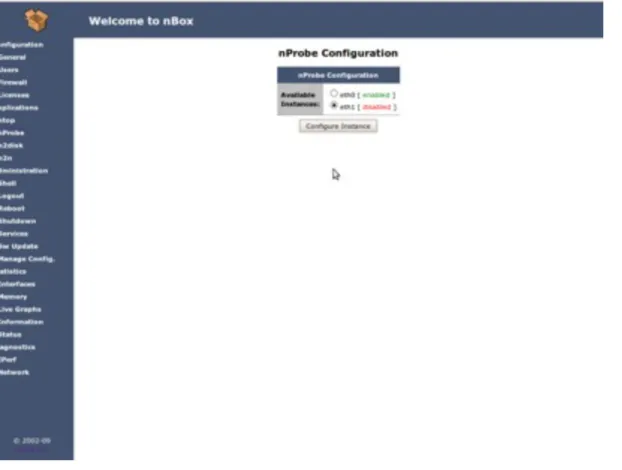
5.1.4 Configuration: nProbe
The nProbe configuration page allows you to enable and fully configure the probe on one or more network interface of your box.
Fig. 6 — nBox: nProbe Configuration Page, selection of the network interface.
Once you have selected the network interface where you want nProbe to listen to for incoming packets, you can set, using the web interface, all the nProbe start-up options described in Section 2.3.1. Note that nProbe can be configured on more then one network interfaces.
You can configure nProbe to act like a v5, v9 or IPFIX probe by selecting the radio button in the “NetFlow Version” web page section. By default nProbe is configured to manage v5 flows.
If you want that nProbe manages v9 or IPFIX flows you have to check the v9/IPFIX radio-button in the “NetFlow Version” section and than save the configuration. Next you have to return back to the configuration page of the interface that you are configuring and specify all the NetFlow parameters you want to be exported in the v9/IPFIX format.
It is worth to say that not all the NetFlow collectors can handle the v9/IPFIX flows protocol.
Fig. 7 — nBox: nProbe Configuration Page for the selected network interface.
By default, in the v9 flows export format, nProbe is configured to export the following packet fields:
Incoming flow bytes, Incoming flow packets, IP protocol byte, Type of Service byte, Cumulative of all flow TCP flags, IPv4 source port, IPv4 source address, Input Interface SNMP idx, IPv4 destination port, IPv4 destination address, Output Interface SNMP idx, SysUptime (msec.) of the last flow pkt, SysUptime (msec.) of the first flow pkt.
If you want to specify NetFlow v9 flows in a format similar to v5 flows you have to select the following fields:
IPv4 source address, IPv4 destination address, IPv4 next hop address, Input Interface SNMP idx, Output Interface SNMP idx, Incoming flow packets, Incoming flow bytes, SysUptime (msec.) of the last flow pkt, SysUptime (msec.) of the first flow pkt, IPV4 source port, IPV4 destination port, Cumulative of all flow TCP flags, IP protocol byte, Type of Service byte, Source BGP AS, Dstination BGP AS, Source subnet mask, Dest subnet mask.
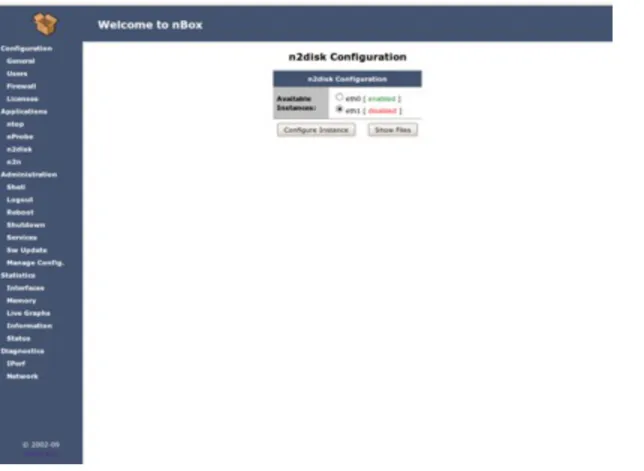
5.1.5 Configuration: n2disk
The n2disk configuration page allows you to enable and fully configure the n2disk application in order to capture packets and write them into disks, for one or more network interface of your box.
Fig. 8 — nBox: main n2disk Configuration Page, selection of the network interface.
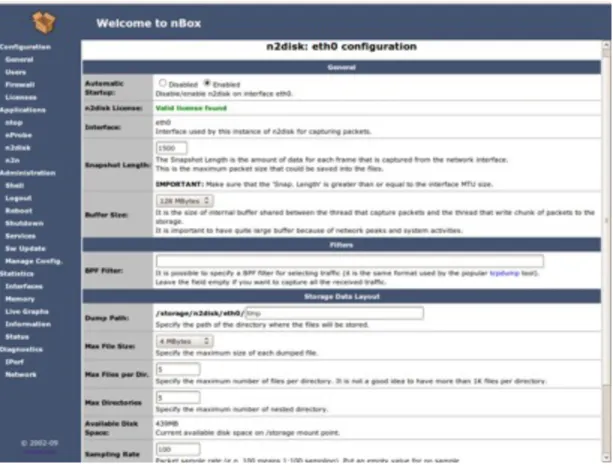
In you want to configure n2disk on a specific interface, you have to select the interface using the radio button and then clicking on the ‘Configure Instance’. Once you have selected the network interface where you want n2disk to listen to for incoming packets, you can set, all the n2disk start-up options described in Section 4.2.1. In Fig. 9 is shown a screenshot of the first part of the n2disk configuration page for the interface eth0. Note that n2disk can be activated and configured on more then one network interfaces.
Fig. 9 — nBox: n2disk Configuration Page for the selected network interface (eth1).
As already said, in the configuration page you can set and tune all the command line options available in the n2disk application. In particular you can enable the dumping only during certain time period and/or when the throughput reaches a specified value. It is worth saying, that if you enable timed dumping and/or dumping on throughput conditions, you can view the n2disk status from the Activity Report web page accessible from the ‘Show Stats’ button (see Fig. 9). Furthermore, in the configuration, you can specify a set of BPF filters in order to prevent the unwanted network packets to be dumped into files.
All the dumped files are stored in the /storage/n2disk/<network-interface> directory (in the following n2disk root directory) where <network-interface> is the name of the network interface where n2disk is listening to for incoming packets. Inside the n2disk root directory there are a set of subdirectories each of them saves the dumped files.
Particularly important is the snapshot length parameter (Snap. Length). In order to capture the entire packet you have to specify a snapshot length value big enough so that each flowing packets has a length less than or equal to the snapshot length.To be sure to capture the whole packets you have to specify a length greater than or equal to the MTU size.
Note that using very large snapshot length values reduce the amount of buffering space available.
You can add to each dumped file a Tag string (by default no Tag is specified) just to distinguish some files from the others or because you want to re-start n2disk and do not
want to overwrite any previously written files. A particular case is when you want to regenerate some files or you want to open them within nTop and you want to be sure that the files are not overwritten during that operation, so you can change or add a Tag string and restart (or start) n2disk.
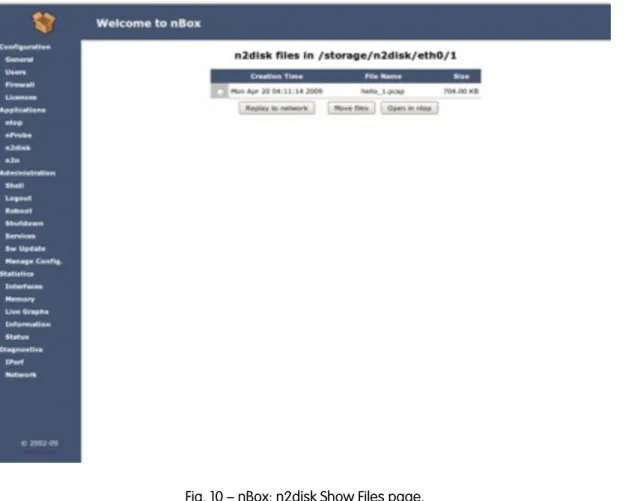
Fig. 10 — nBox: n2disk Show Files page.
Clicking on the ‘Show Files’ button in the n2disk page, you can access the Show Files page (Fig. 10) where you can browse the directories created in the n2disk root directory. Each directory may contain, at most, double the number of files specified in the configuration page (if archiving option is enabled). The number of subdirectories inside the root directory, is given by dividing the total number of files allowed by the maximum number of files per directory.
Once you have selected the files you are interested in, you can perform the following operations:
·
Open the files within nTop to view packets statistics (Open in nTop)·
Regenerate the packets contained in the selected files (Replay files):o
into a different network interface using the tcpreplayapplication (Replay into network)files moved into a specified directory by accessing the nBox via FTP or SSH using the user ‘n2disk’.
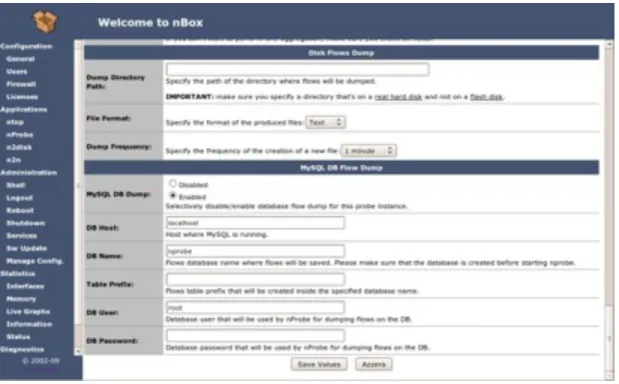
5.1.6 Configuration: SQL Database
It is possible to export nProbe flow in a MySQL database. If you want that nProbe stores the flow on a SQL database you have to enable the database service on your nBox.
Fig. 12 — nBox: SQL Database Configuration Page, remote service
Entering the SQL Database configuration page, you have to choose between two options:
1.
Activate MySql on the local box.2.
Configure the parameters to access a remote database service.In the first case you have to define: database-name, the user and the password to access the database. In the second case, you have to specify also the hostname and the port where the DB service is waiting to receive connections. When you enable the MySQL support in the nProbe configuration page, the database connection settings you specify in the SQL Database page will be used automatically.
Important notes about DB usage:
·
It is safe to enable the DB services locally on the box only if you have an nBox with a hard-disk on-board because of the limited size of the flash-disk. The database root directory is /storage/mysql. If this directory gets full the system could hang.5.1.7 Configuration: Firewall
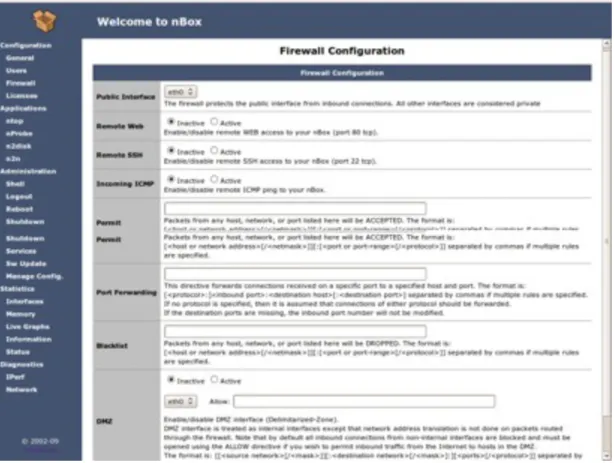
The Firewall link in the left frame allows you to enable or disable a simple firewall to protect access to your nBox.
Fig. 13 — nBox: Firewall Configuration Page
Once you have enabled the firewall you can access to the Firewall configuration page where you can specify the following settings:
·
Public network interface. This is the interface that is protected by the firewall. You want to restrict access on that interface.·
Enable/Disable remote web access (port 80). If it is disabled you cannot manage to access to the nBox web GUI from the public network interface.·
Enable/Disable SSH access (port 22). If it is disabled you can not manage to access the nBox via any ssh clients from the public network interface.·
Enable/Disable incoming ICMP. The box doesn’t reply to ICMP requests.·
Permit. Allows you to specify a list of networks or hosts from which allpackets will be ACCEPTED.·
Port Forwarding. Allows you to forward connections to a port to a specific host and port.·
Blacklist. Allows you to specify a list of networks or hosts from which all packets will be DROPPED.If you want to know the rules added by the firewall you can connect with a shell to the box as root user and type the command iptables-save. By redirecting the output to a file, you can
modify the rules and than reload the whole rule by typing:cat filename | iptables-restore.
In he following we have reported the rules added by the firewall in case where only SSH and WEB access is allowed from the public network interface eth0.
nBox:~# iptables-save *mangle :PREROUTING ACCEPT [40:2740] :INPUT ACCEPT [39:2688] :FORWARD ACCEPT [0:0] :OUTPUT ACCEPT [21:2253] :POSTROUTING ACCEPT [21:2253] COMMIT *nat :PREROUTING ACCEPT [1:100] :POSTROUTING ACCEPT [0:0] :OUTPUT ACCEPT [0:0]
-A POSTROUTING -o eth0 -j SNAT --to-source 192.168.160.10 COMMIT *filter :INPUT DROP [8:452] :FORWARD DROP [0:0] :OUTPUT ACCEPT [24:2585] :TRUSTED - [0:0]
-A INPUT -m state --state RELATED,ESTABLISHED -j ACCEPT
-A INPUT -p tcp -m state --state NEW -m tcp --dport 80 -j ACCEPT -A INPUT -p tcp -m state --state NEW -m tcp --dport 22 -j ACCEPT -A INPUT -i eth1 -m state --state NEW -j ACCEPT
-A INPUT -i eth1 -p udp -m state --state NEW -m udp --dport 67 -j ACCEPT -A INPUT -i lo -j ACCEPT
-A INPUT -m state --state NEW -j TRUSTED
-A FORWARD -m state --state RELATED,ESTABLISHED -j ACCEPT -A FORWARD -i eth1 -m state --state NEW -j ACCEPT
-A FORWARD -m state --state NEW -j TRUSTED -A OUTPUT -o eth1 -p icmp -j ACCEPT
-A OUTPUT -p icmp -m state --state INVALID -j DROP -A TRUSTED -j DROP
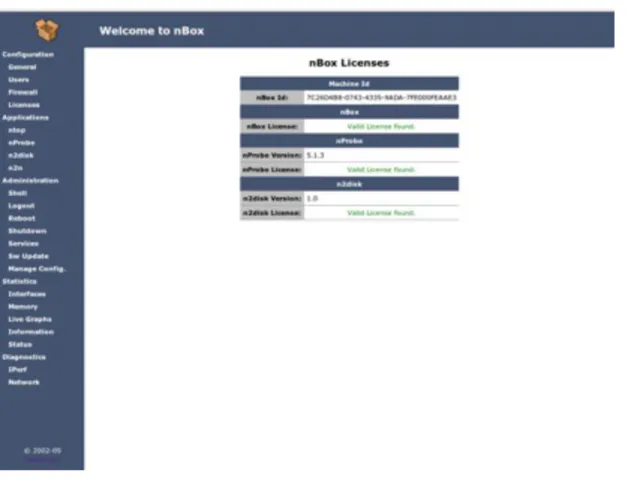
5.1.8 Configuration: License
In order to use all the nBox features, the nBox must have a valid license. A valid license is required:
To the new nProbe 5.x Pro releases to run (either nProbe and n2disk).
To have access to the nBox repository in order to get updates via Internet (see
Configuration: Update section for details).
Fig. 14 — nBox: License Configuration Page
The license codes are written in the /etc/ directory and different text files are used for each service (nbox.license, nprobe.license, n2disk.license). When nProbe starts, it searches for its license file in
the /etc directory. If nProbe does not find any valid license or the license code is invalid it won’t start.
The license file (and by consequent the flash card) could not be moved from one nBox to another one because the license code is strictly tied to the underling machine.
A license never expires so you can run nProbe 5.x Pro without any limitation. On the other hand, in order to get continuous package updates from the nBox Internet repository (www.nmon.net/update), you need to renew the license year-by-year.
If for some reason you loose the license file, you can send the nBox serial-id via e-mail to the mailbox [email protected] asking for the license code. The nBox serial-id can be retrieved using the Information page (nBox-id field) or by typing in the nBox console the following command as root user :license -s .
and n2disk) has to be updated in order to keep the these features fully functional.
5.1.9 Administration: Shell
As not everybody has an SSH client installed, the web interface contains a Java applet that implements an SSH client that allows you to access the nBox via SSH without the need to use an SSH client.
Fig. 15 — nBox: nBox Java-based SSH Shell
In order to use the java-based SSH client you have to enable Java plugins in your browser.
5.1.10 Administration: Services
The available services can be managed from the web interface by selecting the radio-button corresponding to the service you want to manage and clicking on the radio-buttons below (start, stop, restart).
Fig. 16 — nBox: Service Management Page
nProbe and ntop start with a watchdog program named runsv. If for some reason they crash, runsv restarts the service in a few seconds.
Note that the services are shown in running state only if the corresponding configuration has been enabled and if the service has been started. If you try to start or restart a disabled service it won’t start.
rrdnet is a internal service that is enabled by default. The rrdnet service produce the data needed to display the network and memory usage graphs like those shown in the Memory page and in the Interfaces page respectively. If you disable the rrdnet service, the only effect is that the graphs aforementioned won’t be displayed.