IBM Tivoli Monitoring
Version 6.3
Troubleshooting Guide
IBM Tivoli Monitoring
Version 6.3
Troubleshooting Guide
Note
Before using this information and the product it supports, read the information in “Notices” on page 339.
This edition applies to version 6, release 3 of IBM Tivoli Monitoring (product number 5724-C04) and to all subsequent releases and modifications until otherwise indicated in new editions.
Contents
Figures . . . xiii
Tables . . . xv
About this information . . . xvii
Chapter 1. Introduction to
troubleshooting . . . 1
Sources of troubleshooting information . . . 1
Problem classification . . . 1
Viewing the IBM Support Portal . . . 2
Subscribing to IBM support notifications . . . 2
Starting Manage Tivoli Enterprise Monitoring Services . . . 3
Chapter 2. Logs and data collection for
troubleshooting . . . 5
Appropriate IBM Tivoli Monitoring RAS1 trace output . . . 5
Running snapcore to collect information . . . 5
Locating the core file . . . 6
Getting Dr. Watson dumps and logs . . . 7
KpcCMA.RAS files . . . 7
Monitoring agent LG0 log . . . 8
Sources of other important information . . . 8
Chapter 3. Common problem solving
11
About the tools . . . 11I am trying to find out what software is supported 11 Workspaces are missing or views are empty . . . 12
Diagnosing that workspaces are missing or empty . . . 12
Resolving application support problems . . . . 13
Resolving monitoring server problems . . . . 14
Resolving monitoring agent problems . . . . 14
Status of a monitoring agent is mismatched between the portal client and tacmd command . . . 15
Diagnosing that the status of a monitoring agent is mismatched between the portal client and tacmd command. . . 15
Resolving monitoring agent problems . . . . 16
Resolving monitoring server problems . . . . 16
The portal server does not start or stops responding 17 Diagnosing that the portal server does not start or stops responding . . . 17
Resolving database problems - missing table or portal server database . . . 18
Resolving database problems - user ID and password . . . 18
Resolving database problems - instance not started . . . 19
Diagnosing that portal server logon fails. . . . 20
The portal client does not respond. . . 20
Diagnosing that the portal client does not respond . . . 20
Resolving storage or memory problems . . . . 21
Resolving client configuration problems . . . . 21
Historical data is missing or incorrect . . . 22
Diagnosing that historical data is missing or incorrect . . . 22
Resolving warehouse proxy connection problems 23 Resolving warehouse proxy agent problems -configuration . . . 23
Resolving warehouse proxy agent problems -connectivity . . . 24
Resolving summarization and pruning agent problems . . . 24
Resolving persistent data store for z/OS problems . . . 25
Historical data does not get collected at the z/OS-based agent . . . 27
A situation does not raise when expected . . . . 27
Diagnosing that a situation does not raise when expected . . . 27
Resolving situation-specific problems . . . 28
A reflex automation script does not run when it should . . . 30
Diagnosing that a reflex automation script does not run when it should . . . 30
Resolving format and variable problems . . . . 31
High CPU usage on a distributed system . . . . 31
Diagnosing high CPU usage on a distributed system . . . 31
Resolving situation problems - diagnostic actions 32 Resolving situation problems - corrective actions 33 Resolving firewall problems - diagnostic actions 33 Resolving firewall problems - corrective actions 34 Resolving Oracle DB Agent problems - diagnostic actions . . . 34
Resolving Oracle DB Agent problems - corrective actions . . . 34
Chapter 4. Tools. . . 37
Trace logging . . . 37
Log file locations . . . 37
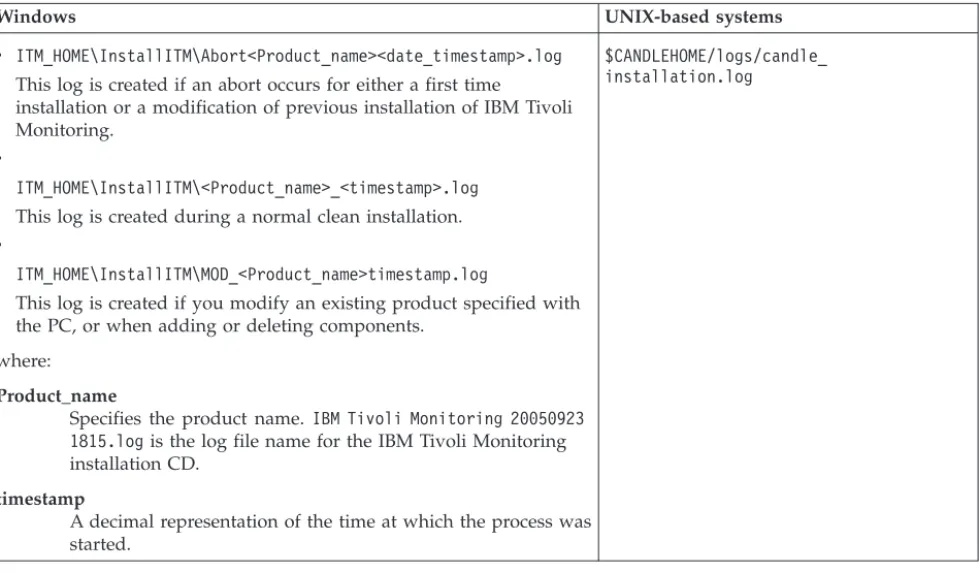
Installation log files. . . 42
Reading RAS1 logs . . . 45
Setting traces . . . 46
Dynamically modify trace settings for a Tivoli Monitoring component . . . 61
IBM Tivoli Monitoring Service Console . . . . 61
Starting the IBM Tivoli Monitoring service console . . . 62
Service console RAS1 interface . . . 63
Blocking access to the IBM Tivoli Monitoring Service Console . . . 65
Displaying portal server tasks in the command prompt . . . 66
KfwSQLClient utility . . . 66
Clearing the JAR cache . . . 67
Using the UAGENT application . . . 67
pdcollect tool . . . 68
ras1log tool . . . 68
Backspace Check utility . . . 69
Common logging facility . . . 69
ITMSuper . . . 69
Chapter 5. Installation and
configuration troubleshooting. . . 71
Frequently asked questions . . . 71
General installation frequently asked questions 71 Windows installation frequently asked questions 71 Linux and UNIX-based systems installation frequently asked questions . . . 72
General installation problems and resolutions . . . 74
Agent Builder application support is not displayed in listappinstallrecs output if it is manually installed without recycling the monitoring server . . . 74
Debugging mismatched application support files 75 Startup Center . . . 75
Tivoli Enterprise Monitoring Agents . . . 77
Upgrade SQL file not found when installing application support on the standby hub . . . . 79
Many files in the First Failure Data Capture log directory . . . 79
Monitoring agents fail to start after agent support or multi-instance agents are installed . . . 79
Incorrect behavior after an uninstallation and re-installation . . . 80
Where Remote Deployment of agents is not supported . . . 80
Application Support Installer hangs . . . 81
An agent bundle is not visible from the Tivoli Enterprise Portal. . . 81
Agent Management Services fails after deployment on Linux Itanium and xLinux with kernel 2.4 systems . . . 81
Watchdog utility requires Windows Script Host 5.6 . . . 81
Unable to deploy monitoring agents from the Tivoli Enterprise Portal . . . 82
Installing application support with a silent installation response file fails . . . 82
Unable to run gsk7ikm.exe . . . 82
*_cq_*.log files appear . . . 83
SPD: Installing a bundle on the wrong operating system, architecture, or kernel . . . 83
Installing a Software Package Block (SPB) on top of an existing, running IBM Tivoli Monitoring agent . . . 83
Problems with the SPB file . . . 83
Installation was halted and receive message about active install . . . 83
Receive an install.sh error when installing two components or agents in the same installation directory . . . 84
When attempting to install IBM Java 1.5.0 on Backup failure message during a remote monitoring server upgrade . . . 84
Remote configuration of deployed Monitoring Agent for DB2 agent fails. . . 84
Monitoring Server cannot find your deployment depot . . . 85
The agent installation log shows error AMXUT7502E . . . 85
Failure occurs when sharing directories for the agent deploy depot . . . 86
You receive a KFWITM290E error when using deploy commands with a z/OS monitoring server . . . 86
Running deployment in a hot-standby environment . . . 86
Difficulty with default port numbers . . . 86
Selecting Security Validation User displays a blank popup . . . 86
When installing a monitoring agent on top of the Systems Monitor Agent, you receive an error . . 86
The monitoring server and portal server automatically start after running Application Support Installer. . . 87
Errors occur during installation of Event IBM Tivoli Monitoring Event Forwarding tool . . . 87
Missing LSB tags and overrides warning message at the end of installation . . . 87
Self-describing capability . . . 87
Windows installation problems and resolutions . . 90
On Windows systems, the installation fails randomly when installing different features . . 90
Problems that are cleared by rebooting the Windows system . . . 90
When installing and configuring the Tivoli Enterprise Monitoring Server on Windows Server 2008, a number of popups and errors occur. . . 90
After an upgrade, the Tivoli Enterprise Portal Server is in the 'stop pending' state and cannot be manually started . . . 91
When running the setup.exe, an unknown publisher error message displays . . . 91
The error “Could not open DNS registry key” occurs . . . 92
Agent not connecting to Tivoli Enterprise Monitoring Server . . . 92
InstallShield displays the error “1607: Unable to install InstallShield Scripting Runtime” during installation on Windows from a network-mounted drive . . . 92
Extracting the nls_replace script causes remote deployment to fail . . . 92
Deploying an agent instance gives a KUICAR020E error . . . 92
Uninstallation is not available for Application Support on Windows systems . . . 93
Problems installing directly from the .zip file . . 93
Installation hangs or loops after presenting initial splash screen . . . 93
UNIX-based system installation problems and resolutions. . . 93
Self-describing capability might be overwritten by UNIX monitoring server application support . 93 On a RHEL6 64-bit system, the Tivoli Monitoring installer fails with errors . . . 95 Application agent remote deployment on
workload partition fails . . . 96 Message is received about the Korn Shell after running theinstall.shfile . . . 97 Linux OS agent fails to load shared libraries . . 97 UNIX and Linux install.sh command fails with error code: 99 and error code: 4. . . 98 Receive KUIC02101W error . . . 98 Receive JVMDG080 or JVMXM012 Java errors . . 98 Receive KCIIN2363E error during non-root
upgrade . . . 99 On HP-UX systems with a host name different from nodename, the upgrade installation fails to stop running processes . . . 99 Installation Manager is suspended during
upgrade . . . 99 EIF Slot Customization does not work on
upgraded zlinux systems . . . 100 KfwSQLClient utility fails on Linux and AIX
systems . . . 100 Failed to attach to the DB2 instance db2inst1
ERROR: Unable to create TEPS, return code = 3 . 100 Installation on SLES9 terminates with install.sh failure:KCI1008E terminating... license declined . 100 Command line interface program of the
Application Support Installer is not currently available . . . 101 Silent installation on UNIX-based systems
returns an encryption key setting error . . . . 101 The error “Unexpected Signal: 4 occurred at
PC=0xFEC3FDE4” occurs during installation . . 101 Installing IBM Tivoli Monitoring on Red Hat 5 and see the following error: “KCI1235E terminating ... problem with starting Java
Virtual Machine” . . . 101 Installation on the Linux S390 R2.6 64-bit
operating system fails with the message “LINUX MONITORING AGENT V610Rnnn unable to install agent” where nnn is the release number . . . 102 AIX . . . 102 Troubleshooting z/OS-based installations . . . . 104 Tivoli Monitoring z/OS initialization checklist 104 z/OS-based installations problems and
resolutions . . . 111 Uninstallation problems and workarounds. . . . 115
Unable to uninstall multi-instance agent from a managed system on windows 64bit . . . 115 Prompted for .msi file during uninstallation
process started from 'Add/Remove Programs' on systems with v6.2.2 installed . . . 115 Uninstallation is blocked by another process that is using the IBM Tivoli Monitoring Eclipse help server . . . 116 Uninstallation of an agent occurring more than once stops the OS agent . . . 116
After uninstallation, Tivoli Enterprise
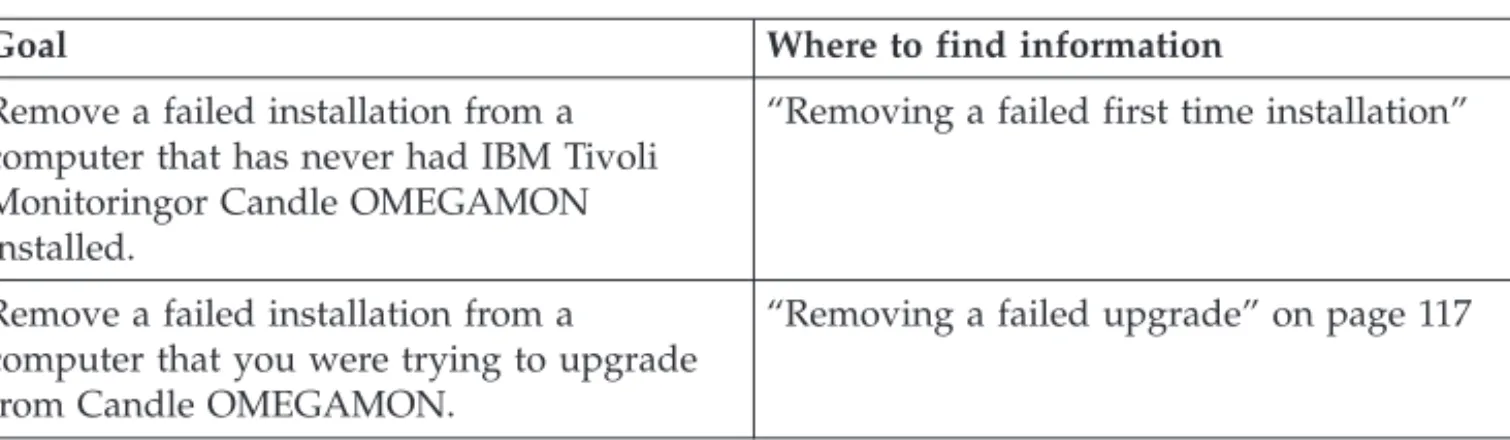
Monitoring Server folder is not deleted . . . . 116 Removing a failed installation on Windows . . 116 Incorrect behavior after an uninstallation and reinstallation . . . 120 Tivoli Data Warehouse database does not
uninstall . . . 120 The agent installation log shows error
AMXUT7512E . . . 120 Prompted to uninstall a database that was not running during uninstallation . . . 121
Chapter 6. Connectivity
troubleshooting . . . 123
Cannot log on to the portal server . . . 123 Cannot connect to the portal server . . . 125 Dashboard data provider connection issues . . . 128 Cannot launch the portal client on Windows XP after installation (message KFWITM215E) . . . . 130 Portal server is initializing and is not ready forcommunications . . . 130 Portal server is unavailable during a portal client work session . . . 130 Portal server does not start after installation . . . 130 Portal server is not connecting with the hub
monitoring server . . . 131 DB2 errors when opening a Tivoli Enterprise Portal workspace . . . 132 A monitoring process fails to start on Linux or
UNIX after changing a .profile for root . . . 133 Heartbeat issues when running on a Linux guest using VMware . . . 133
Chapter 7. Portal client
troubleshooting . . . 135
Portal client startup . . . 135 No logon request in Firefox . . . 135 Oracle Java download page is displayed . . . 135 IBM Java 7 installation on Linux does notsucceed . . . 136 Browser client startup on Linux using Firefox is not successful . . . 136 Java exception logging onto the browser client 137 "Do you want to run this application?" message when starting Java Web Start client . . . 137 "Do you want to run this application?" security message when starting Java Web Start or
browser client . . . 137 "Do you want to install the following software?" message when starting Java Web Start or
browser client . . . 138 Certificate validation failure when starting Java Web Start client . . . 138 "Do you want to run this application?" message when starting Java Web Start client . . . 139 Java discovered application components that
could indicate a security concern . . . 139 Portal desktop client called from Java Web Start does not work properly after adding agent
Portal desktop client does not work when
exporting DISPLAY . . . 140
Password problem using the LDAP Security option on Active Directory system . . . 141
Logon name not accepted after hub monitoring server change . . . 141
Using an administrator name with non-latin1 characters, cannot log onto the Tivoli Enterprise Portal . . . 141
On an Active Directory Server, sysadmin cannot logon to the Tivoli Enterprise Portal client . . . 142
Workspaces . . . 142
Workspaces opened in browser tabs are not displayed correctly . . . 142
Data in the portal client is missing and you receive an error. . . 144
Several enterprise workspaces are returning an error, KFWITM217E:Request Error,SQL1_CreateRequest Failed, rc=350 . . . 145
Link from Managed System Status workspace 145 Historical data . . . 146
At the bottom of each view, you see a historical workspace KFWITM217E error . . . 146
Historical UADVISOR situations are started on the agent if historical collection is configured to collect data . . . 146
Clicking on the Timespan icon for one view brings up the data for another view . . . 146
Historical Collection Configuration window error after changing warehouse database from Oracle to DB2 on Linux or UNIX . . . 146
Situations. . . 147
Situations are not firing . . . 147
Restarting a situation for pure event does not clear it from console . . . 147
Multiple events that occur at the same time are loaded too slowly . . . 148
You cannot paste non-ASCII characters in the Situation editor . . . 148
Situation editor cannot display advanced advice help files . . . 148
Installation of situation data fails due to I/O on VSAM data sets . . . 148
Help is not displayed. . . 149
Data is not returned to the portal client . . . . 149
Cannot select the Create new group icon within the Object group editor . . . 150
Monitoring agents show in an unexpected position in the Navigator . . . 150
HEAPDUMPs and JAVACore files are placed on desktops when running in browser mode . . . . 151
Category and Message field of the universal message does not accept DBCS . . . 153
Agents display offline in the portal client but they are still started . . . 153
Browser client locale configuration . . . 153
Cannot load a ws_pres.css file in order to select a language other than English . . . 154
Chapter 8. Portal server
Performance impacts of the HTTP and HTTPS protocols . . . 155Users who run the IBM HTTP Server do not have permission to the content directory . . . 155
tacmd exportWorkspaces or importWorkspaces receives an out of memory error . . . 155
The portal server and Warehouse Proxy Agent fail to connect to the database on a 64-bit Windows system . . . 156
Failed to log on as sysadmin with portal server LDAP enabled . . . 156
On AIX systems, newly created users with auto-expire passwords cause installation failures . 156 Linux portal server unable to FTP catalog/attribute files . . . 156
Upgrading the Tivoli Enterprise Portal Server takes a long time . . . 156
Running the Tivoli Management Services Discovery Library Adapter, results in a book that does not contain the fully qualified host name . . 156
Portal server performance is slow . . . 157
Cannot create a Tivoli Enterprise Portal Server database . . . 157
You receive a KFW error when a query is sent to more than 200 managed systems . . . 158
Non-hub situations are not associated at the Tivoli Enterprise Portal Server level . . . 159
Non-root stopping or starting agents causes problems . . . 159
Root password is not accepted during non-root Tivoli Enterprise Portal Server configuration . . . 159
Corba user exception is included in the portal server log when creating situations . . . 159
Stopping or starting the eWAS subcomponent of the portal server . . . 159
Setting the TEPS/e maximum heap size . . . . 160
Chapter 9. Monitoring server
troubleshooting . . . 161
Installed packages exceed the 512 maximum . . . 161
Messages related to the index file are displayed when the agent fails back to a remote monitoring server . . . 162
A generic RPC communications error is received when issuing a long-running tacmd execute command . . . 162
Troubleshooting monitoring server problems on distributed systems . . . 162
SOAP command failures . . . 162
Exposure of passwords in the clear . . . 163
Receive a seeding failed message . . . 163
High monitoring server CPU after restarting with Warehouse Proxy Agents configured . . . 163
High virtual memory usage on Linux 64-bit systems . . . 164
Upgrade inconsistency between the History and Object windows . . . 165
Attribute groups started for collection on the managed systems should not be available on the monitoring server list. . . 165
To decrypt a password,
KDS_VALIDATE_EXT='Y' is required . . . . 165 Remote Tivoli Enterprise Monitoring Server
consumes high CPU when large number of
agents connect . . . 165 Unable to start the Tivoli Enterprise Monitoring Server after the kdsmain process is terminated abnormally . . . 166 THRESHOLDS.XML and Tivoli Enterprise
Monitoring Server table not cleaned when
managed system override is removed . . . . 166 Situations fail to trigger for attributes by
applying group function. . . 166 Monitoring server application support
completes all seeding functions but might crash as the program is exiting . . . 166 Some agents are displayed in the Service
Console list that are not accessible from that
user interface . . . 167 The system crashes when attempting a bulk
import or export command . . . 168 Monitoring server fails to start, but then does after a reboot . . . 168 Remote monitoring server lost connection to the hub and all agents display offline . . . 168 After the set timeout, the Tivoli Enterprise
Monitoring Server is still pending . . . 168 Providing the wrong path to configuration files during LDAP configuration causes the Tivoli Enterprise Portal login window to hang . . . 169 Crash on Linux remote monitoring server
during hub failover to Hot Standby . . . 169 HUB Tivoli Enterprise Monitoring Server
quiesce prevents the display of the data collected by the attached Tivoli Enterprise
Monitoring Agents . . . 169 During installation of a remote Tivoli Enterprise Monitoring Server on a Windows system, the agent support is applied, but fails . . . 170 Using a Deploy Group with addSystem or
updateAgent commands. . . 170 Tivoli Enterprise Monitoring Server requires
restart if you issue itmcmd server stop/start
commands when you are already logged on . . 170 Log indicates hub monitoring servers are down when they are up . . . 170 The Platform view in the Manage Tivoli
Enterprise Monitoring Services panel shows the Tivoli Enterprise Monitoring Server as running as a 32 bit application, but my agents are shown as running as 64 bit applications . . . 171 Tivoli Enterprise Monitoring Server does not
release memory after running a large SQL query 171 SQL queries with more than 200 OR predicates do not complete . . . 172 Tivoli Enterprise Monitoring Server aborts
unexpectedly when exiting the telnet session
used to start it . . . 172 KCIIN0084E Timeout appears while waiting for Tivoli Enterprise Monitoring Server to start on AIX 5.3 . . . 172
Kshsoap client failure on UNIX-based systems 172 tacmd login fails after hub monitoring server is recycled . . . 173 tacmd and SOAP are not able to connect . . . 173 tacmd login fails when monitoring server is
configured with LDAP authentication . . . . 174 Correcting tacmd login error after failover to
standby monitoring server . . . 175 Tacmd login command fails with error
KUIC00017E. . . 175 In a hot standby (FTO) environment, commands to a mirror hub might not return hub records after reconnection . . . 176 A deleted object is redisplayed when two hot standby (FTO) hubs reconnect . . . 176 Troubleshooting monitoring server problems on z/OS systems . . . 176
Receive Program KDFCINIT and Program
FAXCMON messages. . . 177 The Tivoli Enterprise Monitoring Server start task (CANSDSST default) encountered error message 'KLVST044 LOADLIST MEMBER NOT FOUND IN RKANPAR DATASET (KDSLLIST) KppLLIST KLVST001 CANDLE ENGINE INITIALIZATION ERROR(S), ABEND U0012' in the RKLVLOG at startup . . . 177 KDS Parameters not generated from the batch parm deck . . . 178 Cannot encrypt text. A call to CSNBSYE failed. Cannot encrypt contents of keyfile . . . 178 The error “KLVST005 MVS JOBSTEP
AUTHORIZATION REQUIRED KLVST001 CANDLE ENGINE INITIALIZATION
ERROR(S), ABEND U0012 CSV019I - Required module KLVSTWTO not accessed, it is not APF Authorized (RKANMODL) CSV028I - ABEND 306-0C” occurs in the z/OS monitoring server RKLVLOG during startup . . . 179 The error “KLVSQ000 carved mode in effect for extended storage” occurred in the RKLVLOG during startup . . . 179 Error message 'KDSMA013 OPEN VTAM for VDM1APPL failed with status 8' occurs in the Tivoli Enterprise Monitoring Server start task (CANSDSST default) . . . 179
Chapter 10. Automation server
troubleshooting . . . 181
Log and environment files . . . 181 OSLC-PM service provider fails to connect toRegistry Services application . . . 182 OSLC-PM service provider fails to start . . . . 184 Linux automation server fails to start when quickly recycled . . . 185 Shutdown takes a long time . . . 185
Chapter 11. Authorization Policy
Server troubleshooting . . . 187
Trace and log information . . . 187Setting a trace for the dashboard data provider
or policy client . . . 187
Authorization Policy Server trace setting . . . 188
pdcollect tool . . . 189
Audit logs for the Authorization Policy Server 191 Validate correct configuration and operation . . 193
Authorization Policy Server startup failure . . . 194
Authorization failures using the Policy CLI commands . . . 195
CLI tivcmd commands for dashboard authorization diagnostics . . . 195
Policy distribution issues . . . 197
Chapter 12. Infrastructure
management dashboards
troubleshooting . . . 203
Server dashboard trace settings . . . 203
Authentication is required in web application . . 204
Resource not available or not authorized to see dashboards . . . 204
Situation event results don't display . . . 206
Dashboards and portal client show different resources . . . 207
No data or only partial data is displayed . . . . 208
User's authorization policy updated but not showing in dashboards . . . 209
Situation events not updated after changes to security policy or group membership . . . 210
Unable to communicate with data provider . . . 210
Chapter 13. Monitoring agent
troubleshooting . . . 211
Startup failure with older agents . . . 211
Command-line interface . . . 212
Historical data . . . 213
Historical data is not collected for Agent Operations Log and ITM Audit . . . 213
Take action commands and reflex automation . . 213
Workspaces . . . 214
A workspace view is showing an error . . . . 215
OS agents . . . 215
Linux OS agent fails to start . . . 215
OS agent start command fails . . . 215
Specific events are not monitored by the Windows OS agent . . . 215
32-bit Agent Builder agent will not start on 64-bit Windows with System Monitor Agent-installed OS Agent . . . 216
OS agent restarted unexpectedly on heavily loaded systems . . . 216
Binary Path attribute of the Windows OS agent does not show a value . . . 216
Tivoli Enterprise Portal data for UNIX OS and Linux OS agents is not updated after stopping the disk . . . 216
Installing backlevel Windows OS agent on existing environment causes monitoring server not to start . . . 217
The target host name, platform, and version information is not displayed for the deployment status in the CLI or the workspace . . . 217
Deploy cannot tell if the installation failed. . . 217
Warehouse agents . . . 218
Unable to configure the Warehouse Proxy agent with modified parameters from the Tivoli Enterprise Portal GUI . . . 218
Self-describing agent . . . 218
Getting diagnostic information . . . 219
Solving common problems . . . 220
Self-describing agent operations no longer function for remote monitoring server in a hot standby environment . . . 221
Local history migration tools move the agent operation logs to multiple agent history locations . 222 Unreadable tool tip information for Available EIF Receivers list of the Situation editor . . . 222
Unable to locate the file name of an exported situation that begins with numerals . . . 223
Testing the connection to the Tivoli Data Warehouse database is valid even with an invalid password. . . 223
Configured non-root user agent starts up as root 223 Large historical collections slow monitoring agents 223 Unable to access History Collection Configuration for any agent . . . 223
Agent names and icons are displayed incorrectly 224 64 bit monitoring agents are not started . . . . 224
Errors in the configuration xml file . . . 224
Subnode Limitations for autonomous function . . 225
Installing pre-v6.2.1 Monitoring Agent for Windows OS onto a v6.2.1 or later monitoring server inadvertently unconfigures the monitoring server . . . 226
Calendar entries overlap. . . 226
Receive an error when deploying an System Service Monitor agent . . . 226
The Agent Service Interface is not globalized . . . 227
Some attribute group names are unintelligible from the History Collection Configuration window . . 227
History collection fails to display the most recent 24 hours of data . . . 227
Situations with attributes from more than 1 group not supported with autonomous agent . . . 227
Failure when importing situation xml file edited with WordPad . . . 227
Printer details of another system are displayed on the Tivoli Enterprise Portal . . . 228
CTIRA_MAX_RECONNECT_TRIES environment variable is now obsolete . . . 228
Agent goes offline after removing history path . . 228
Override button is not present for a situation. . . 228
Agent's Management Definition View columns are not showing data . . . 228
There is a situation distribution discrepancy if there is a hub monitoring server outage when one or more remote monitoring servers remain active . 229 Installing v6.2.2 agent application support on a monitoring server for a prior release causes agents to fail . . . 229
SNMP trap Sendto fails . . . 229 Situation overrides cannot be used to disable
situations on specific systems at specific times . . 229 Situation or calendar name in thresholds.xml file appears incorrect . . . 229 BAROC file is missing for IBM Tivoli Monitoring 5.x Endpoint situations . . . 230 Agent upgrade and restart using non-root . . . . 230 After installing and configuring a monitoring
agent, it fails to start . . . 232 situation_fullname slot missing for delete events 232 Logs are using the situation ID string instead of the display name . . . 232 If a managed system list is removed for a situation, the situation stops . . . 232 Descriptions are not displayed for default
situations . . . 233 Agent configuration failed on remote deployment while using single quotes for configuration
properties . . . 233 New attributes missing . . . 233 Unable to receive summarized data for the last
hour in the Tivoli Enterprise Portal . . . 233 Summarization for CCC logs is not allowed . . . 233 Receive errors when modifying the JAVA HEAP SIZE for the Summarization and Pruning Agent . . 234 When associating situations, they fire, but cannot be viewed . . . 234 The Summarization and Pruning agent fails when processing an index created in a previous release of the product . . . 234 Summarization and Pruning agent schedule not affected by daylight saving time . . . 234 Attribute names must be kept under 28 characters long . . . 234 Agent deployment operations are not completing before the TIMEOUT expires . . . 235 An agent does not display in the portal client or in the output from the listSystems command . . . . 236 One monitoring agent's workspaces are listed
under another agent node on the portal client . . 238 Issues with starting and stopping an agent as a
non-Administrator user . . . 238 UNIX-based systems Log agent was deployed,
configured, and started but returns the
KFWITM290E error . . . 238 KDY1024E error is displayed when configuring the run-as user name for an agent . . . 239 Interface unknown messages in ras1 logs . . . . 239 When upgrading a System Service Monitors agent from 3.2.1 to 4.0, receive KDY3008E message . . . 239 The Tivoli Data Warehouse fails and you either
lose data or have memory problems . . . 239 Error list appears in warehouse logs. . . 241 When configuring the Monitoring Agent for Sybase and the Warehouse Proxy Agent, receive message to use CandleManage . . . 241 listSit command with the type option fails with a KUIC02001E message on Japanese Systems . . . 241 Creating a situation from a group member does not copy the distribution list . . . 241
A changed situation name does not show up . . . 242 New agents do not display in the portal client
Navigator view. . . 242 An agent displays unavailable in the portal client 242 CTIRA_HOSTNAME has no effect on log file
names . . . 242 The Summarization and Pruning Agent and the
Warehouse Proxy Agent do not work with DB2 9.1 Fix Pack 2 . . . 242 An error of 'can bind a LONG value only for
insert' appears . . . 242 Errors in either the Warehouse Proxy Agent or
Summarization and Pruning Agent logs . . . . 242 Receive a message saying that the statement
parameter can only be a single select or a single stored procedure . . . 243 Custom defined workspace views do not handle symbol substitution as expected . . . 243 Unresolved variables in custom queries . . . . 243 A message appears after accepting the license . . 245 Adding agent help files requires a restart of the
Eclipse Help Server and the Tivoli Enterprise
Portal Server . . . 245 Unable to create historical collection directory for ud:db2inst1 . . . 245 Receive a large amount of data back from the
warehouse for a baseline command . . . 245
Chapter 14. Command
troubleshooting . . . 247
Command line interface cannot be found or started 247 The krarloff command returns an error message 247 Receive a busy monitoring server message when using the getfile, putfile, or executecommandcommands . . . 247 Problems with Take Action commands and curly brackets . . . 248 Take Action command names do not accept
non-English characters . . . 248 Using the kinconfig command and remotely
starting, stopping or recycling agents fails on
Windows 2000 systems . . . 248 Take Action commands do not work if unrequired values are left blank . . . 248 Take Action commands do not display messages when run from a Navigator Item or from a
workspace view . . . 248 wsadmin commands' output indicates the wrong server name . . . 248 Commands fail when a situation name consists of characters . . . 248 tacmd commands . . . 249 Prerequisite checks . . . 249 Slow tacmd command response in large scale environments . . . 249 KDH1_RequestActivity unsuccessful, rc:
0x7c4c8001D, in a long-running tacmd . . . . 249 tacmd exportnavigator -o not behaving correctly 250 Installing an exported agent bundle using
Situations deleted from the CLI are still listed on Tivoli Enterprise Portal Situation editor . . 251 The tacmd addBundles command returns an
unexpected KUICAB010E error message . . . 251 Missing options for login -stdin results in
unexpected behavior . . . 251 A system error occurs with the tacmd
editsystemlist -e command . . . 251 Problem running the tacmd listsystemlist -d
command on Linux systems . . . 252 Problem running the tacmd listSystems
command on Linux and UNIX . . . 252 You receive a message when using a tacmd
command related to agents . . . 253 Improving tacmd command response time when using VMWare . . . 253 Commands with embedded single quotation
marks fail . . . 253 Reconfiguring an agent and then getting the
deploy status yields a port number message . . 253 tacmd removeBundles command returns
unnexpected KUICRB010E error message . . . 253 The suggestbaseline or acceptbaseline
commands fail . . . 254 Overrides set against an agent cannot be deleted from the command line . . . 254 Unexpected KUIC02013E error message . . . 254 Corrupted tacmd responses are displayed in the command-line interface . . . 255 TACMD xxxxAction commands fail on Japanese systems . . . 256 tacmd executecommand command run against subnode fails . . . 256 tacmd getfile or putfile command is failing . . 257 Temporary files remain when tacmd getfile or putfile is interrupted . . . 257 tacmd listsit -m UX Managed System gives no result . . . 257 Receive an OutOfMemory exception when using the import or export commands . . . 257 addBundles command times out . . . 257 tacmd createNode . . . 258 tacmd suggestbaseline minimum, maximum,
and average function values are ignored . . . 259 tacmd suggestbaseline command receives an
error . . . 259 You receive a message when trying to use the tacmd maintagent command . . . 259 listSit command with the type option fails with a KUIC02001E message on Japanese Systems . . 259 When using the listSystems command, the last two digits for the version appear as 'XX' . . . 259 The command tacmd restartAgent fails if the agent is already stopped. . . 260 tacmd addSystem fails if agent already exists 260 The addSystem command fails with error
message KUICCR099E . . . 261 The addbundles command fails . . . 261 The exportBundles command does not work for patches . . . 261
Endpoint fails to connect to monitoring server when running createnode from a monitoring
server in a different domain . . . 261 The tacmd getdeploystatus command is not
returning status return codes . . . 262 tacmd createSit does not send errors if you
mistype the name of an attribute . . . 262 tacmd viewUser . . . 262 itmcmd commands . . . 262
The itmcmd config -A hd command asks for
Database Table Partitioning. . . 263 tivcmd commands. . . 263
Chapter 15. Performance Analyzer
troubleshooting . . . 265
Enabling logging for the agent . . . 265 Enabling logging for the monitoring portal . . . 266 Installation and configuration issues. . . 266 Problems after upgrading . . . 267 Tivoli Performance Analyzer graphical userinterface for Tivoli Enterprise Portal fails when
downloading tasks list . . . 268 When tasks are started and when you should see data in the workspaces . . . 268 No data is displayed in the workspaces . . . . 269 The Tivoli Performance Analyzer workspaces are not available or not displayed . . . 269 No chart is visible on the Forecast Details
workspace . . . 269 The Performance Analyzer Agent Statistics
workspace shows database errors indicating that some tables or views are missing . . . 269 Nonlinear tasks take too long to complete . . . . 270 Agent never connects to the monitoring server . . 271 The Tivoli Enterprise Monitoring Server does not restart after installation of Domain Support . . . 271
Chapter 16. Database troubleshooting 273
Data loss prevention . . . 273Backing up the TEPS database for recovery
purposes . . . 273 Restoring the original database contents . . . 273 If you modify your password or if it expires . . . 273 DB2 pureScale environment . . . 274 Receive First Steps error at the end of a DB2
installation . . . 275 Windows portal server cannot connect to the
database . . . 275 Oracle problem with JDBC drivers prior to 11.1.0.7 276 Database contents are incorrect after installation 276 Migration script fails on DB2 for Linux, UNIX and Windows . . . 277 Errors when migrating non-partitioned tables to partitioned tables . . . 277 Using DB2 V9.1 for z/OS, Warehouse Proxy agent encounters a large number of disconnections . . . 281 Historical data is not warehoused . . . 282 Historical data for logs is incorrect . . . 282 Incorrect data is collected in the warehouse for
Too much historical data is collected . . . 283 Warehouse Proxy agent failed to export data . . . 283 There are ORACLE or DB2 errors in the
khdras1.log file . . . 283 SQL0552N “ITMUSER” does not have the privilege to perform operation “CREATE BUFFERPOOL” SQLSTATE=42502 . . . 284
Chapter 17. Event synchronization
troubleshooting . . . 285
Event synchronization installation andconfiguration troubleshooting . . . 285 Errors occur during installation of IBM Tivoli Monitoring event synchronization . . . 285 Netcool/OMNIbus Probe for Tivoli EIF does not start after configuring the probe to use
monitoring rules . . . 285 Netcool/OMNIbus integration troubleshooting . . 286
Log files for Netcool/OMNIbus Event
Synchronization . . . 286 Unable to send situation events from the hub monitoring server to Netcool/OMNIbus . . . 287 Event status updates in Netcool/OMNIbus are not forwarded to Tivoli Monitoring . . . 289 Monitoring events in Netcool/OMNIbus do not have expected values for the Summary attribute or other attributes set by the IBM Tivoli
Monitoring probe rules . . . 293 After an event is cleared in Netcool/OMNIbus, the event's severity is changed back to its
original severity . . . 295 Tivoli Enterprise Console integration
troubleshooting. . . 296 General event synchronization troubleshooting . . 296
Editing the default destination server information from the command line does not work . . . 296 tacmd refreshTECinfo -t all shows no results on console . . . 297 Changing the TCP/IP timeout setting on your event server . . . 297
Chapter 18. Tivoli Common Reporting
troubleshooting . . . 299
Installation and configuration . . . 299 Java out of memory error after installation . . 299 Failure to extract reports from TAR on AIXserver . . . 300 OS agent reports fail after repeat installations 301 Schema Publication Tool errors . . . 301 Localized reports . . . 302 Locations of log files . . . 302 Running OS Cognos Reports with Tivoli Common Reporting 2.1.1 on 64-bit AIX 6.1 results in error DPR-ERR-2056 . . . 303 Displaying data for Situations History report
results in error . . . 303 The generated report displays an incorrect date
and time format . . . 303
The generated report does not display report
legend. . . 303 Receive a 'statement is too long' error message
when running a report . . . 304 Running COGNOS reports against a DB2 database is slow . . . 304 You are missing drivers after the Tivoli Common Reporting installation. . . 304 You receive message CTGTRW1000E . . . 305 The report fails to generate because the SQL query was not valid . . . 305 Message “SQL Statement does not return a
ResultSet object” displayed . . . 305 Your report fails to generate with unexpected error messages displayed . . . 305 Reports against many agents fail with Out of
Memory Error . . . 306 The generated report displays the message “SQL Error” . . . 307 The report fails with a SQLSTATE:22003 arithmetic overflow error . . . 307 No data is plotted in graph, or some columns in the table are blank. . . 308 The generated report displays the message “The requested data is not available” . . . 309 Lineage option shows an exception . . . 309 You receive the message “serverName is unknown host” . . . 309 You receive the message “Empty Data Set” . . . 310
Chapter 19. Auditing facility
troubleshooting . . . 311
Audit Log workspace shows only 100 of the most recent audit records . . . 311 Audit Log workspace does not display recordsbefore the latest component startup . . . 311
Chapter 20. OMEGAMON Enhanced
3270 user interface troubleshooting. . 313
No data condition on the OMEGAMON enhanced 3270 user interface. . . 313 Possible causes for the no data condition . . . . 317 No custom log on profiles have been created or the hub monitoring server settings have not beenconfigured . . . 318 The hub monitoring server settings in the log on profile do not match the hub monitoring server
configured values . . . 319 There are no OMEGAMON Enhanced 3270 user interface data retrieval agents registered . . . . 320 The hub monitoring server is off line; verify
initialization and data request reception . . . . 321 Application product support (seed data) has not been added to the hub monitoring server . . . . 322 The OMEGAMON monitoring agent is off line or has not been started . . . 323 The OMEGAMON Enhanced 3270 user interface local registry does not contain required agent
Data retrieval delays/time-outs causing no data
conditions . . . 326
Appendix. IBM Tivoli Monitoring
processes . . . 329
Documentation library
. . . 331
IBM Tivoli Monitoring library . . . 331
Documentation for the base agents . . . 332
Related publications . . . 333
Other sources of documentation . . . 333
Support information . . . 335
Notices . . . 339
Figures
1. OMEGAMON configuration including deployment of the enhanced 3270 interface components . . . 315 2. OMEGAMON Enhanced 3270 user interface
workspace depicting a case of no data after the initial log on . . . 317 3. Tivoli Enterprise Monitoring Server
information with no settings specified . . . 318 4. Current hub Tivoli Enterprise Monitoring
Server settings . . . 319
5. The current hub Tivoli Enterprise Monitoring Server information with the correct server
name . . . 320 6. Sample display of local registry with
available data sources . . . 321 7. Only Managed Systems panel listing the
available names of the local registry . . . . 323 8. Online Managed Systems Lists panel of the
Tables
1. Installation log files . . . 42 2. Upgrading from Tivoli Distributed
MonitoringTivoli log file . . . 44 3. Setting the trace option for the Tivoli
Monitoring upgrade toolkit . . . 57 4. IBM Tivoli Monitoring Service Index . . . . 61 5. General frequently asked questions . . . . 71 6. Windows installation frequently asked
questions . . . 71 7. Frequently asked questions for Linux and
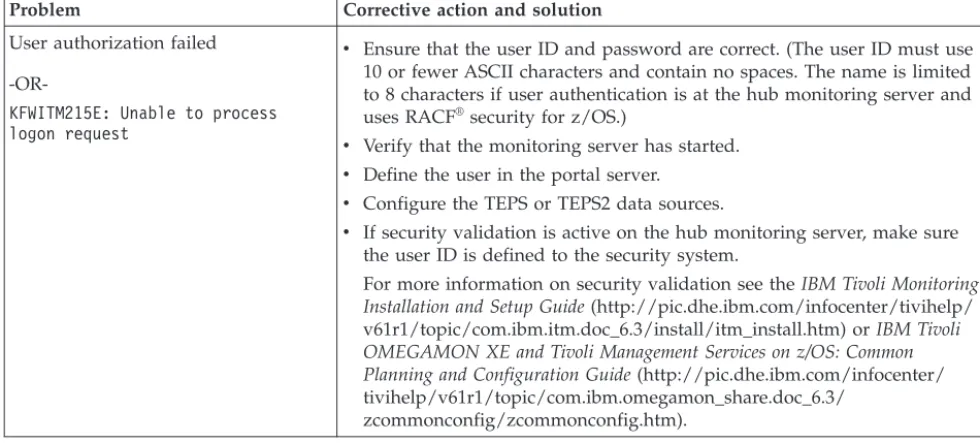
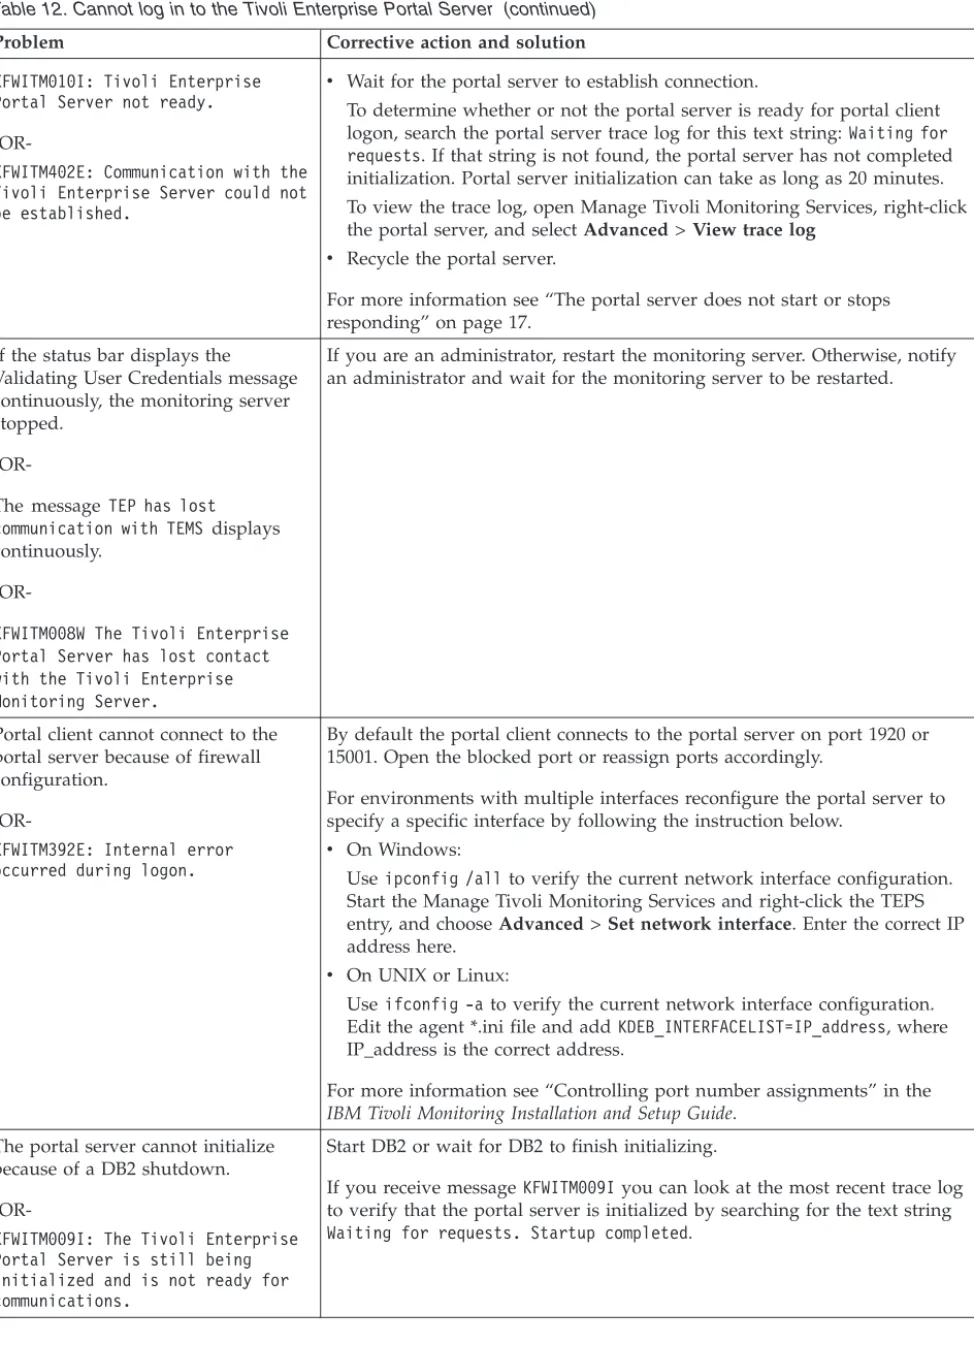
UNIX-based systems installation . . . 72 8. lcfd log file. . . 85 9. Removing a failed installation on Windows 116 10. Installation logs . . . 121 11. Uninstall OS command . . . 121 12. Cannot log in to the Tivoli Enterprise Portal
Server . . . 123
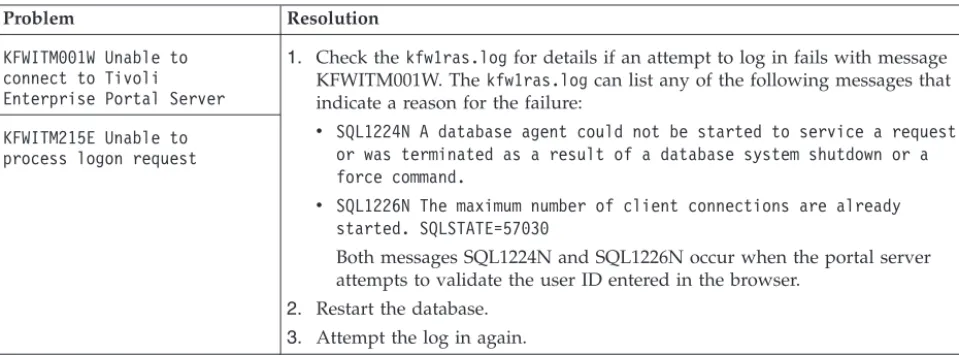
13. Cannot connect to Tivoli Enterprise Portal
Server . . . 126 14. Control interface publishing . . . 131 15. KDEBE_V3_CIPHER_SPECSvalid values . . . . 183 16. Audit log messages that might alert you to an
agent-related self-describing problem . . . 220 17. Resolutions for agent deployment operations
that TIMEOUT . . . 235 18. Resolving problems sending events to
Netcool/OMNIbus. . . 287 19. Event status updates in Netcool/OMNIbus
are not forwarded to Tivoli Monitoring . . . 290 20. Monitoring events in Netcool/OMNIbus do
not have expected values . . . 293 21. IBM Tivoli Monitoring processes by operating
About this information
This guide provides problem determination and resolution information for the issues most commonly encountered with IBM®Tivoli®Monitoring components and related products.
Chapter 1. Introduction to troubleshooting
To troubleshoot a problem, you typically start with a symptom or set of symptoms and trace back to the cause.
Troubleshooting is not the same as problem solving, although during the process of troubleshooting, you can obtain enough information to solve a problem, such as with end-user errors, application programming errors, and system programming errors.
You might not always be able to solve a problem yourself after determining its cause. For example, a performance problem might be caused by a limitation of your hardware. If you are unable to solve a problem on your own, contact IBM Software Support for a solution. See Chapter 2, “Logs and data collection for troubleshooting,” on page 5 for information on the types of data to collect before contacting Support.
Sources of troubleshooting information
The primary troubleshooting feature is logging. Logging refers to the text messages and trace data generated by the software. Messages and trace data are sent to an output destination, such as a console screen or a file.
Typically, text messages relay information about the state and performance of a system or application. Messages also alert the system administrator to exceptional conditions when they occur. Consult the explanation and operator response associated with the displayed messages to determine the cause of the failure. See the document IBM Tivoli Monitoring Messages for message information.
Trace data capture transient information about the current operating environment when a component or application fails to operate as designed. IBM Software Support personnel use the captured trace information to determine the source of an error or unexpected condition. See “Trace logging” on page 37 for more information about tracing.
Problem classification
The first task in troubleshooting is to determine the origin of the problem, or which component or function is experiencing a problem. To assist you in determining the origin of the problem, collect documentation at the time of the error.
You might experience problems with IBM Tivoli Monitoring in the following areas:
v Installation v Upgrading v Configuration v Connectivity
v Tivoli Enterprise Portal v Tivoli Enterprise Portal Server v Tivoli Enterprise Monitoring Server v Tivoli Authorization Policy Server
v Tivoli Enterprise Monitoring Automation Server v Tivoli Enterprise Monitoring Agent deployment v Tivoli Data Warehouse
v Databases
v Command-Line Interface v Event synchronization
v Infrastructure Management Dashboards for Servers v Performance Analyzer
v Auditing facility
v Tivoli Common Reporting
Viewing the IBM Support Portal
The IBM Support Portal is a unified, customizable view of all technical support tools and information for your IBM systems, software, and services. It brings all the support resources available for IBM hardware and software offerings together in one place.
About this task
Perform the following actions to access technotes for this product:
Procedure
1. Open the http://ibm.com website and selectSupport & downloads>
Technical support. You can also launch an IBM support website, such as http://www.ibm.com/support/us.
2. Enter your IBM user ID when prompted or, in the Quick start page or Support home, clickSign into sign in with your IBM user ID or to register if you have not yet registered.
3. Enter a keyword or keywords for the information you want to find in the
Quick FindorSearch supportfields. You can also browse through the other
Supporttabs.
Subscribing to IBM support notifications
You can subscribe to e-mail notification about product tips and newly published fixes through the Support portal.
In the Support portal, you can specify the products for which you want to receive notifications; choose from flashes, downloads, and technotes; and set up to receive email updates.
About this task
Perform the following actions to subscribe to Support emails.
Procedure
1. Open the http://ibm.com website and selectSupport & downloads>
Technical support. You can also launch an IBM support website, such as http://www.ibm.com/support/us.
2. In the Quick start page or Support home, clickSign into sign in or to register if you have not yet registered.
3. In the Notifications area of Support home, clickManage all my subscriptions.
4. In the SubscribeandMy defaultstabs, select a product family and continue setting your preferences to specify the information you want in your emails.
5. If you have not yet added an email address to your profile, clickMy IBM>
Profile>Editand add it to your personal information.
Results
You begin receiving “IBM My notifications” emails about the products you have selected and at the interval you specified.
Starting Manage Tivoli Enterprise Monitoring Services
Manage Tivoli Enterprise Monitoring Services is a Tivoli Monitoring utility with a graphical user interface for starting, stopping, and configuring monitoring
components on a Windows, Linux or UNIX computer. Many diagnostic and problem-solving tasks are done in Manage Tivoli Enterprise Monitoring Services.
About this task
Start Manage Tivoli Enterprise Monitoring Services using one of the following methods:
Procedure
v Click Start>Programs>IBM Tivoli Monitoring >Manage Tivoli Enterprise Monitoring Services
v Change to the install_dir/bindirectory and run./itmcmd manage
[-hinstall_dir]where -h install_diris optional and used to specify the installation directory if it is not the one in which the script is located.
Results
Manage Tivoli Enterprise Monitoring Services is started and a list of the components that are installed on the computer is displayed.
Chapter 2. Logs and data collection for troubleshooting
If you have a problem that you are unable to solve using the information in this guide or on the IBM Support Portal, gather the information that relates to the problem and contact IBM Software Support for further assistance.
Appropriate IBM Tivoli Monitoring RAS1 trace output
IBM Software Support uses the information captured by trace logs to trace a problem to its source or to determine why an error occurred.
The reliability, availability, and serviceability (RAS) trace logs are available on the Tivoli Enterprise Monitoring Server, the Tivoli Enterprise Portal Server, and the monitoring agent. By default, the logs are stored in the installation path for IBM Tivoli Monitoring.
The following links to sections in this document supply more information on these files:
v For information on where they are stored, see “Log file locations” on page 37 v For information on setting the trace option for an IBM Tivoli Monitoring
component, see “Setting traces” on page 46.
v For information on dynamically setting the trace settings, see “Dynamically
modify trace settings for a Tivoli Monitoring component” on page 61.
v For information on reading RAS1 logs, see “Reading RAS1 logs” on page 45. v For information on the ras1log tool, see “ras1log tool” on page 68.
Running snapcore to collect information
Use the snapcorecommand for collecting information for use in identifying and resolving problems with an application.
The snapcorecommand gathers a core file, program, and libraries used by the program and compresses the information into a pax file. The file can then be downloaded to disk or tape, or transmitted to a remote system.
About this task
Take the following steps to run thesnapcorecommand and collect information you might need to debug and analyze the problem:
Procedure
1. Change to the directory where the core dump file is located:
# ls -l total 84176
-rw-r--r-- 1 root system 2704 Feb 21 09:52 core.18048.01084144 2. Run the snapcorecommand to collect all needed files:
# snapcore -d /tmp/myDir core.18048.01084144
Thesnapcore command gathers all information and creates a new compressed pax archive in the/tmp/myDirdirectory. If you do not specify a special directory
using the -d flag, the archive will be stored in the/tmp/snapcoredirectory. The new archive file will be named assnapcore_$pid.pax.Z:
# ls -l /tmp/myDir total 5504
-rw-r--r-- 1 root system 2815081 Feb 21 09:56 snapcore_20576.pax.Z 3. To check the content of the pax archive, run theuncompresscommand:
# uncompress -c snapcore_20576.pax.Z | pax core.18048.01084144 README
lslpp.out errpt.out vi
./usr/lib/libc.a ./usr/lib/libcrypt.a ./usr/lib/libcurses.a ./usr/lib/nls/loc/en_US ./usr/lib/libi18n.a ./usr/lib/libiconv.
Locating the core file
You can read the core file for information related to system stops on UNIX-based systems. Use theerrpt -acommand to get a summary of the most recent system stoppages and the location of the core file.
If the system stops on UNIX-based systems, collect the core file from the directory that stores the binary file, to which the process belongs. For example, if the failing process is the Tivoli Enterprise Portal Server server process, KfwServices, the core is created in the/opt/IBM/ITM/archtype/cq/bin/directory.
Procedure
To retrieve information on where the core file is created, enter the errpt -a
command.
Results
A summary of information is displayed about the most recent crashes and also the location of the core file:
---LABEL: CORE_DUMP IDENTIFIER: A63BEB70
Date/Time: Tue Jun 30 15:38:47 DFT 2009 Sequence Number: 1229
Machine Id: 0056536D4C00 Node Id: nc114062
Class: S
Type: PERM
Resource Name: SYSPROC Description
SOFTWARE PROGRAM ABNORMALLY TERMINATED Probable Causes
SOFTWARE PROGRAM User Causes
USER GENERATED SIGNAL Recommended Actions
Failure Causes SOFTWARE PROGRAM
Recommended Actions
RERUN THE APPLICATION PROGRAM
IF PROBLEM PERSISTS THEN DO THE FOLLOWING CONTACT APPROPRIATE SERVICE REPRESENTATIVE Detail Data
SIGNAL NUMBER 11 USER’S PROCESS ID:
32248
FILE SYSTEM SERIAL NUMBER 10
INODE NUMBER 655367 PROCESSOR ID 0 CORE FILE NAME
/opt/IBM/ITM/aix533/cq/bin/core PROGRAM NAME
KfwServices
STACK EXECUTION DISABLED
---Getting Dr. Watson dumps and logs
Use the Dr. Watson debugger to get the information needed by IBM Support to diagnose problems on Windows systems.
If you encounter errors or failures on your Windows system, collect the
drwtsn32.logand user.dmpfiles if they are available. Thedrwtsn32.logand
user.dmp files are located in: \Documents and Settings\All Users\Documents\ DrWatson.
About this task
Take the following steps to enable Dr. Watson and configure it to create a detailed dump file:
Procedure
1. To enable Dr. Watson as the default debugger, at the command prompt, enter the following command: drwtsn32 –i.
2. To open the Dr. Watson configuration dialog, at the command prompt, enter the following command:drwtsn32
3. Set the following fields:
a. Set theCrash dump Type to FULL.
b. Clear theDump Symbol Tablecheck box.
c. Enable theDump all Thread Contextscheck box.
d. Enable theCreate Crash Dump Filecheck box.
K
pc
CMA.RAS files
IBM Tivoli Monitoring on Windows systems has ( wherepcis the two-character product or component code) KpcCMA.RAS files in thec:\windows\system32directory to collect information about monitoring process failures.
For example, KNTCMA.RASis the Monitoring Agent for Windows OS the reliability, availability, and serviceability file. These files contain system dump information similar to thedrWatson.log, but are generated by the IBM Tivoli Monitoring infrastructure.
Monitoring agent LG0 log
Review and agent's LG0 file in the logs directory for log entries relating to
connection to the Tivoli Enterprise Monitoring Server, the situations that are started and stopped, and other events while the agent is running.
Log file location
install_dir\TMAITM6\logs
install_dir/logs
LG1 backup
A new version of LG0 file is generated every time the agent is restarted, and one backup copy of the file is kept with extension LG1. View the LG1 file to learn the following details regarding the previous monitoring session:
v Status of connectivity with the monitoring server v Situations that were running
v The success or failure status of Take Action commands Note:
1. If instance_name:host_name.domain_nameis greater than 32 characters, the characters beyond that number are truncated from the domain name.
2. Messages related to the self-describing agent show the status code with no description if the message was from a later version of IBM Tivoli Monitoring than the agent version. For example, you run thetacmd addsdainstalloptions
command on your V6.2.3 monitoring agent but it does not succeed and you review the LG0 file for that agent. The log file has an entry with SDA status code 1024, which was introduced in V6.3.0. What shows as the message description, 0x400, should beSDA Install Blocked.
Self-Describing Agent Register/Install failed with STATUS (1024/0x400)
for PRODUCT "NT", with TEMS "TVT6048:CMS", VERSION_INFO "product_vrmf=06230100; tms_package_vrmf=06230100;tps_package_vrmf=06230100;tpw_package_vrmf=06230100;".
Sources of other important information
You can collect important information from log files, such as trace or message logs that report system failures. Also, application information provides details on the application that is being monitored, and you can obtain information from messages or information on screen.
The following sources provide additional information to aid in troubleshooting:
v Monitored application file as specified on the SOURCE FILE statement, if
applicable.
v Description of the operation scenario that led to the problem.
v Incorrect output, such as Tivoli Enterprise Portal screen captures or a description
of what you observed, if applicable.
v Log files collected from failing systems. You can collect all logs or logs of a
certain type such as, RAS trace logs or message logs.
v Information about the application that you are monitoring, such as DB2 or SAP.
This information includes the version number, patch level, and a sample application data file if you are monitoring a file.
v Operating system version number and patch level.
v Version number of the following members of the monitoring environment:
– IBM Tivoli Monitoring and the patch level, if available. – Monitoring Agent version number .
– Tivoli Enterprise Portal (SelectHelp>About Tivoli Enterprise Portal) Note: The version number of the Tivoli Enterprise Portal and theTivoli Enterprise Portal Server must always be synchronized.
Chapter 3. Common problem solving
Customers using IBM Tivoli Monitoring products or the components of Tivoli Management Services can encounter problems such as missing workspaces or historical data, or a reflex automation script that does not run when it should. In many cases you can recover from these problems by following a few steps.
Note: Use the trace settings indicated in these troubleshooting instructions only while you are trying to diagnose a specific problem. To avoid generating excessive trace data, go back to the default trace settings as soon as the problem is solved.
About the tools
You can access several troubleshooting tools, such as the Log analyzer or pdcollect tool to help you troubleshoot your IBM Tivoli Monitoring product or the
components of Tivoli Management Services.
ITMSuper Tools
The ITMSUPER Tools give you information about the health of your managed systems, situations, and environment configuration. You can find the tools by searching for “ITMSUPER” in the IBM Integrated Service Management Library (http://www.ibm.com/software/brandcatalog/ ismlibrary).
pdcollect tool
The pdcollect tool collects the most commonly used information from a system. It gathers log files, configuration information, version information, and other data. You can also use this tool to manage the size of trace data repositories. For more information see “pdcollect tool” on page 68.
IBM Support Assistant
The IBM Support Assistant is a free, stand-alone application that you can install on any workstation. Then, you can enhance the application by installing product-specific plug-in modules for the IBM products you use. For more information see “Support information” on page 335.
I am trying to find out what software is supported
Use resources in the IBM Tivoli Monitoring Installation and Setup Guideand the IBM website to determine the software that is supported. This enables you to find platform or database information for specific products.
The following resources are available to determine the software that is supported:
v For specific information about the supported software for IBM Tivoli
Monitoring, see “Hardware and software requirements” in theIBM Tivoli Monitoring Installation and Setup Guide
v For platform and database support information for most Tivoli products, consult
the matrix at Tivoli Supported Platforms (http://www-306.ibm.com/software/ sysmgmt/products/support/Tivoli_Supported_Platforms.html)
Workspaces are missing or views are empty
You can encounter a problem that Tivoli Enterprise Portal workspaces are missing or views are empty. For example, you may have workspaces that return no data. Symptoms of the problem:
v The workspaces return no data.
v There are no child Navigator items under the agent node in the Navigator view.
See “Resolving application support problems” on page 13.
v The Navigator items are labeled with internal names, such asKnt:KNT1076
instead of the correct names (such as Disk). See “Resolving application support problems” on page 13.
v You receive message KFWITM217E: Request error: SQL1_CreateRequest failed,
rc=209. See “Resolving application support problems” on page 13.
v You receive message KFWITM220E: Request failed during execution.See
“Resolving monitoring agent problems” on page 16.
For more information on workspaces that relate to historical data, see “Historical data is missing or incorrect” on page 22.
To diagnose the problem that workspaces are missing or empty, see “Diagnosing that workspaces are missing or empty.”
Diagnosing that workspaces are missing or empty
You can diagnose that workspaces are missing or empty by verifying that the monitoring agent has been started and that the configuration is correct. You can also check that application support has been added.
About this task
To diagnose that workspaces are missing or empty, perform the following steps:
Procedure
Preliminary diagnostics
1. Refresh the Navigator by clickingView>Refresh.
2. Verify that the monitoring agent has been started. Restart if necessary. In the Tivoli Enterprise Portal, right-click the Navigator item of the monitoring agent and click Start or Restart
3. Verify that the monitoring agent configuration is correct.
4. If your data is missing in an Oracle Agent workspace, see “Resolving Oracle DB Agent problems - diagnostic actions” on page 34. Similar problems might exist for other monitoring agents.
5. Check that application support has been added. See “Resolving application support problems” on page 13.
What to do next
For more information on actions that relate to these diagnostics, see the problem resolution tasks.
Resolving application support problems
Application support problems are caused by a lack of application support or an application support level mismatch among the components: monitoring server, portal server, desktop and Java™Web Start clients, and monitoring agents. Check the installed level of application support or run the ITMSUPER Tivoli Enterprise Monitoring Server analysis tool (or both) to get more information.
Before you begin
Complete one or both of the following tasks to ensure that this is an application support problem:
v “Diagnosing that workspaces are missing or empty” on page 12 v “Diagnosing that a situation does not raise when expected” on page 27
About this task
To resolve application support problems, you perform diagnostic and corrective actions. These actions include checking application support on the servers and client and running the Tivoli Enterprise Monitoring Server tool to ensure that application support is installed consistently in your environment.
Procedure
Diagnostic and corrective actions
1. Check application support on the monitoring server, portal server, and portal client:
v Run the kincinfo.exe -icommand in the%CANDLE_HOME\InstallITM
directory to show what is installed.
v Run the./cinfo –icommand in the$CANDLEHOME/bin directory to
show what is installed.
v (monitoring server) Look in the&rhilev.&rte.RKANDATV data set where
&rhilev is the high-level qualifier and &rte is the mid-level qualifier of the libraries for the runtime environment where the monitoring server is configured for files namedKppCATand KppATRwhereppis the two-character product or component code.
2. You can also run the Tivoli Enterprise Monitoring Server analysis tool provided by ITMSUPER against the hub monitoring server to ensure that application support is installed consistently throughout your environment.
3. If application support is missing, add the appropriate application support to the portal server and monitoring server for the monitoring agents.
4. If the desktop client or Java Web Start client is being used, ensure application support is installed on the portal client.
What to do next
For more information and instructions on installing application support see
“Configuring application support for nonbase monitoring agents” in theIBM Tivoli
support on a z/OS monitoring server, see “Adding application support to a monitoring server on z/OS” in Configuring the Tivoli Enterprise Monitoring Server on z/OS.
Resolving monitoring server problems
Monitoring server problems are caused by a monitoring server that is not started or connectivity that is lost either between servers or between servers and agents. You can restart the Tivoli Enterprise Monitoring Server, and you can also run the ITMSUPER Topology tool to get more information.
About this task
To resolve monitoring server problems, you perform diagnostic and corrective actions. These actions include running tools, such as the Topology or Connectivity tool and correcting communication failures in logs.
Procedure
Diagnostic and corrective actions
1. If you are an administrator, restart the monitoring server. Otherwise, notify an administrator and wait for the monitoring server to be restarted.
2. Running the following ITMSUPER tools might also provide more information:
v Topology tool v Connectivity tool
v Tivoli Enterprise Monitoring Server analysis tool v Tivoli Enterprise Portal Server
3. Check the portal server logs for messages indicating communication failures to the monitoring server.
4. Check the monitoring server logs for messages indicating communication failures to the remote monitoring servers or to monitoring agents.
5. Correct the communication failures indicated in the logs.
Resolving monitoring agent problems
If the monitoring agent is running but data is not being returned or if you receive an error message from an agent log, such as Endpoint unresponsive, verify that the agent is connected and online. You can also verify that application support has been installed correctly.
About this task
To resolve monitoring agent problems, you perform diagnostic and corrective actions. These actions include verifying that the agent is running and that application support has been installed correctly. For information on monitoring agents on z/OS® see each product'sProblem Determination Guide.
Procedure
Diagnostic and corrective actions
1. Verify that the agent is connected. Check the monitoring server log for messages similar to Remote node <SYS:MQIRA> is ON-LINE.
2. If the agent is online, check to see whether subnodes are online in the agent log. For example: KMQMI171I Node JSG1:SYS:MQESA is online.