STATE OF NEBRASKA
FY2013-14 / FY2014-15
BIENNIAL BUDGET
As Enacted in the
103rd Legislature-First Session
State of Nebraska Biennial Budget (2013 Legislative Session) Page i
Table of Contents
I. Introduction
... 1II. Highlights
... 2III. General Fund Financial Status
... 5A. General Fund Financial Status – July 2013 Tax Rate Review Committee ... 6
B. General Fund Financial Status – End of 2013 Legislative Session (June 2013) ... 7
C. Chronology of the Financial Status ... 8
D. Estimated Financial Status for the Following Biennium ... 15
E. Cash Reserve Fund ... 19
IV. General Fund Revenues
... 22A. Revenue Forecasts ... 23
B. Chronology of Revenue Forecasts ... 25
C. Historical Revenues ... 26
D. General Fund Transfers-Out ... 28
E. General Fund Transfers-In ... 29
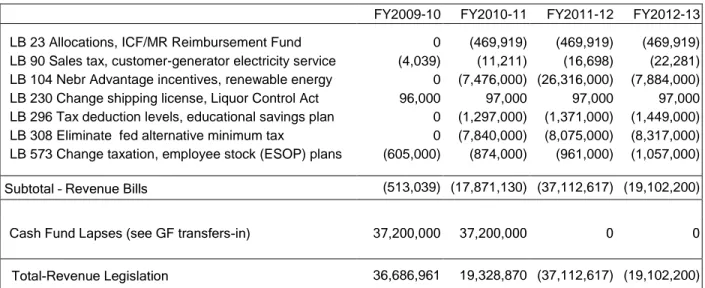
F. 2013 Session Revenue Legislation ... 30
V. General Fund Appropriations
... 32A. Overview ... 33
1. State Totals and Summary by Operations and Aid ... 33
2. Historical Appropriations (state totals) ... 36
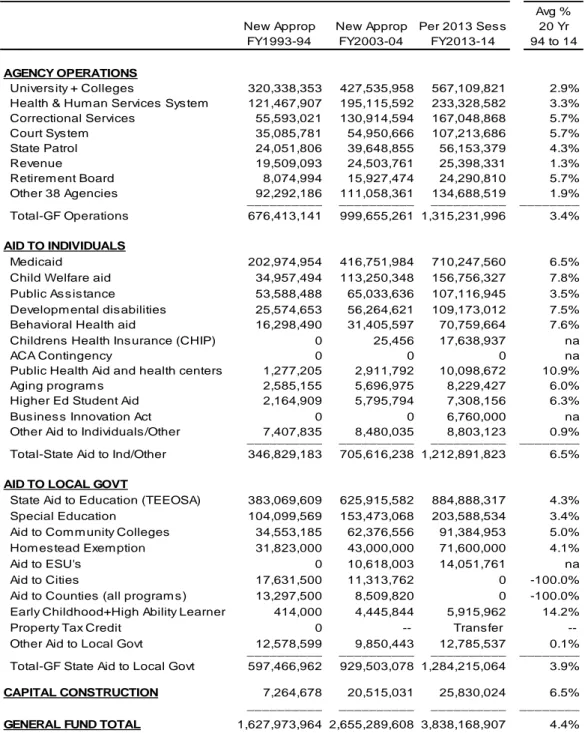
3. Breakdown of Historical Appropriations (FY94, FY04, FY14) ... 37
B. Significant Increases and Reductions ... 38
C. Highlights-General Fund State Aid to Individuals ... 40
1. Affordable Care Act (ACA) ... 40
2. Behavioral Health Aid ... 43
3. Community Based Developmental Disabilities ... 44
4. Children’s Health Insurance Program (SCHIP) ... 45
5. Public Assistance ... 46
6. Child Welfare Aid ... 47
7. Medicaid ... 49
8. Community Health Center and Public Health Dept aid ... 50
9. Health aid ... 50
10. Aid to Aging Services ... 51
11. Higher Education Student Aid... 51
D. Highlights-General Fund State Aid to Local Governments... 52
1. Aid to K-12 Schools ... 52
a. Special Education... 52
b. High Ability Learner program ... 53
c. Early Childhood program ... 53
e. Learning Community Aid ... 53
f. LB 366 Diploma of High School Equivalency Assistance Act ... 53
g. Other K-12 aid programs ... 54
h. State Aid to Schools (TEEOSA) ... 54
2. Aid to ESU's ... 56
3. Homestead Exemption ... 57
4. Governors Emergency Program ... 57
5. Community Base Juvenile Services aid ... 58
6. Aid to Community Colleges ... 58
E. Highlights-General Fund Agency Operations ... 59
1. Court System ... 59
2. Secretary of State ... 61
3. Dept. of Education ... 61
4. Dept. of Health and Human Services System ... 62
5. Dept. of Correctional Services ... 64
6. State Colleges ... 65
7. University of Nebraska ... 66
8. State Patrol ... 66
9. State Employee Salary Increases ... 66
10. State Employee Health Insurance ... 67
11. Defined Benefit / Cash Balance Retirement Plans ... 68
F. General Fund Appropriations By Agency ... 70
G. General Fund State Aid by Individual Aid Program ... 73
H. General Fund Appropriations by Bills ... 75
I Governor Vetoes and Overrides ... 76
VI. Appropriations – All Funds
... 77A. State Totals and Summary ... 78
B. Cash Funds ... 79
1. Dept of Roads ... 79
2. Health Care Cash Fund ... 80
3. Securities Act Cash transfer-Legal Aid, Homeless Shelter, Affordable Housing ... 82
C. Federal Funds ... 82
D. Revolving Funds ... 83
E. Appropriations by Bill - All Fund Sources ... 84
F. Historical Appropriations-All Fund Sources ... 86
G. Appropriations by Agency - All Fund Sources ... 87
VII. Capital Construction
... 97A. Summary ... 98
B. Listing of General Fund & NCCF Construction Projects ... 99
C. Project Listing - Reaffirmations ... 103
D. Project Listing - New Construction ... 104
VIII. FY2012-13 Appropriation Adjustments (Deficits)
... 106A. Description of Major General Fund Items ... 107
B. Listing – Adjustment of Current Year (FY2012-13) General Fund Appropriations ... 108
State of Nebraska Biennial Budget (2013 Legislative Session) Page iii
D. Listing - Adjustment of Current Year (FY2012-13) Appropriations - All Funds ... 109
E. Chronology of FY2012-13 Appropriations ... 110
IX. DEFINITION OF TERMS
... 111A. State Biennial Budget ... 112
B. Fiscal Year ... 112
C. Fund Types ... 112
D. Operations, State Aid, Construction ... 113
E. Agency and Program Structure ... 114
F. Budget Process and Chronology ... 114
X. LEGISLATIVE FISCAL OFFICE STAFF & ASSIGNMENTS
... 117A. Agency Assignments (agency numerical order) ... 118
Introduction
This report contains a summary of the initial appropriations and budget actions for the FY2013-14 and FY2014-15 biennium as enacted during the 2013 Legislative Session. These are not the final
appropriations as both fiscal years numbers can be changed during the 2014 Legislative Session, and FY2014-15 can further be changed during the 2015 Legislative Session. The following is a brief description of what can be found in the various sections of this report.
General Fund Financial Status
The state’s General Fund financial status is displayed here, both the projected status at the end of 2013 Session in June (referred to as Sine Die) as well as the current status incorporating changes that have occurred since that time. Also included is a detailed chronology of the Financial Status for both the FY14/FY15 Biennium and projected for the FY16/FY17 Biennium.General Fund Revenues
This section details General Fund revenue projections, an overview of the growth in revenue both projected and historical, and lists legislation enacted during the 2013 Legislative Session that impact revenues.General Fund Appropriations
This section provides detailed information on General Fund appropriations as enacted during the 2013 Legislative Session including state totals, agency totals, historical appropriations, various breakdowns by state agency operations and state aid to individuals and local governments, and state aid listed by individual aid programs. This section also includes anextensive listing of the major changes in the budget as well as narrative descriptions of some of the major spending areas, both agency operations and state aid programs. A listing of General Fund “A” bills and vetoes and overrides is also included.
Appropriations-All Fund Sources
While previous sections relate to the General Fund, this section provides a summary of appropriations from all fund sources (General, Cash, Federal, and Revolving) including state totals, by agency, and by bill enacted.Capital Construction
A complete listing of all new and reaffirmed construction projects, from all fund sources, is included in this section.FY2012-13 Deficit Appropriations
This section provides a detailed listing of all FY2012-13 deficiency appropriations. Also included is a chronology of FY2012-13 appropriations from when first enacted in the 2011 Session, changed during 2012 Session, and the final appropriations after the 2013 Session.Definition of Terms
This section of the report provides descriptions of the various terms used in this report as well as a complete chronology and description of the states’ budget process.Legislative Fiscal Office Staff
The last section includes a numerical listing of all state agencies and the Legislative Fiscal Office staff assigned to that agency. Also included are phone numbers and email addresses of the LFO staff.Highlights
This report contains a summary of the FY2013-14 and FY2014-15 biennial budget as enacted during the 2013 Legislative Session. Details as to specific funding items, revenues, and balances are contained in the following sections. However, there are several highlights to address at the start.
General Fund Financial Status
At the end of the 2013 session (Sine Die) the enacted budget results in a $237.7 million unobligated ending balance at the end of the FY14/FY15 Biennial Budget which is $964,205 above the minimum 3% reserve. This variance from the minimum reserve has fluctuated substantially over the past four months from the $619 million shortfall projected at the end of the last legislative session, to a $195 million shortfall based on October revenue forecasts and a projected budget based on agency requests, to a $15.9 million positive balance based on the Appropriations Committee preliminary budget to $41 million above the minimum reserve with the Appropriations Committee recommendation. A more complete chronology is on page 8 and highlights the various actions taken that contributed to the rise and fall of the projected shortfalls. In terms of the following biennium, the enacted showed a balance just slightly below the minimum 3% reserve.
Since Sine Die the FY2012-13 fiscal year was completed with actual receipts $52.4 million above the Sine Die forecast. This amount was above the July certified forecast and by law is transferred to the Cash Reserve Fund. With changes in the reserve calculation and an estimate for lapsed appropriations, the current financial status yields a projected ending balance that is $7.4 million above the minimum reserve.
Revenue Forecasts
The budget and financial status at Sine Die of the 2013 Session were based on the Nebraska Economic Forecast Advisory Board (NEFAB) April revenue forecasts adjusted by revenue legislation enacted in the 2013 Session. Rate and base adjusted revenue growth implied by these forecasts was 5.4% growth in FY12-13, 3.6% in FY13-14 and 4.7% in FY14-15 for an average growth of about 4.6% over the three years that affected the financial status. This reflects modest growth considering the 32 year average is 5.1% but is very close to the 4.5% average growth for the last ten years.
While the FY14 and FY15 rate and base adjusted revenue growth was 4.2% average, the nominal or unadjusted average revenue growth, which is what is actually available for budget purposes, is only 1.7%. The difference is that the revenue forecasts for the FY14/FY15 biennium incorporate the full impact of two revenue bills enacted in 2011 (LB84 Build Nebraska Act) and 2012 (LB970 income tax reduction) which had minimal impacts in the FY12/FY13 biennium but much larger impacts in the FY14/FY15 biennium The opposite occurs with respect to FY2012-13 where $125 million of estimated one-time capital gains tax is treated as a unique item and is an adjustment for purposes of calculating rate and base adjusted growth. In FY2012-13 the adjusted growth is 5.4% but the nominal unadjusted growth is 8.2%. For the “following biennium”, revenue growth is calculated at 5.4% per year, rate and base adjusted, using the historical average methodology. These calculated amounts are higher than preliminary, unofficial estimates prepared by the Nebraska Dept of Revenue (NDR) and Legislative Fiscal Office (LFO) using Global Insight forecasting information but lower than those derived using Moody’s. As noted above, since the end of the 2013 Legislative Session actual receipts for FY2012-13 ($4,052,358,610) were $52.4 million above the $4,000,000,000 projection at 2013 Sine Die in June. Adjusted revenue growth for FY12-13 is calculated at 6.7% compared to 5.4% at Sine Die. AT THIS TIME THERE IS NO CHANGE IN THE FY13-14 AND FY14-15 REVENUE FORECASTS as the
their current revenue forecasts. In light of the $52.4 million above forecast revenues in FY12-13, the level of growth in FY13-14 to achieve the current forecast has declined from 3.6% to 2.3%.
Budget Growth
Budget growth in the enacted budget is 5.7% in FY14 and 5.3% in FY15 for a two year average of 5.5%. The largest increase on a percentage basis is in capital construction where the funding is for one-time items.
Growth in operations and aid to individuals is somewhat misleading as $23.4 million is shifted
from child welfare aid to the Supreme Court operations as part of the LB561 juvenile service delivery project. While the funds may be used for similar things, it’s listed as operations under the courts to allow for full flexibility. This shift understates the FY15 and 2 year average for aid to individuals by 1% and overstates the same for operations.
TEEOSA School Aid
The budget includes funding for state aid to schools (TEEOSA) at the funding level required by the formula as amended by LB 407 as enacted in the 2013 session. The overall net change in total TEEOSA aid is an increase of $62.6 million (7.4%) in FY2013-14 followed by a $26.0 million (2.8%) increase in FY14-15. The General Fund amounts (excluding the amount financed by allocated Insurance Premium Tax monies) reflect a $61.9 million (7.4%) increase in FY13-14 followed by a $22.6 million (2.5%) increase in FY14-15.
Over the two years of the biennium, TEEOSA school aid funded with the LB407 changes is approximately $78.4 million less than what was projected under law without LB407 changes. Under that prior law TEEOSA school aid was projected to increase by $96 million (11.3%) in FY13-14 and an additional $27.9 million (3.3%) in FY14-15.
Affordable Care Act (ACA)
The Patient Protection and Affordable Care Act (referred to here as ACA) made many changes regarding individuals, employers, health plans; and health coverage. Beginning in 2014, individuals will be required to maintain health insurance. Also several coverage reforms are made such as prohibition against lifetime benefit limits and coverage for preexisting health conditions. These various changes is estimated to have an impact on state funding based on existing programs and existing state law. A summary of the projected impact, including savings in behavioral health aid and allocation for a contingency, are shown below while a detail on the estimates can be found on page 40.
General Fund Impact ACA FY2013-14 FY2014-15 Two Yr Total Children’s Health Insurance (SCHIP) 2,600,000 6,100,000 8,700,000 Medicaid 9,900,000 27,400,000 37,300,000 Behavioral Health aid 0 (15,000,000) (15,000,000) ACA Contingency 0 10,000,000 10,000,000
_____________ _____________ _____________
Total Aid 12,500,000 33,500,000 46,000,000 Administrative / Operating Costs 4,964,999 5,018,412 9,983,411
____________ _____________ _____________
Total General Funds 17,464,999 38,518,412 55,983,411
On the revenue side, the guarantee coverage provision under the ACA is assumed to virtually eliminate the need for people to enroll in the Nebraska Comprehensive Health Insurance Pool (CHIP) program. Under current law, funds not needed for the CHIP program are run back through the statutory allocation
Gen Fund % Change FY2013-14 FY2014-15 2 Yr Avg Agency Operations 4.4% 6.1% 5.2% State Aid to Individuals 6.8% 5.4% 6.1% State Aid to Local Govt 5.6% 4.3% 4.9% Capital Construction 24.3% 9.6% 16.7%
_______ _______ ______
million in FY14 and $7.2 million in FY15) has already been incorporated into the current General Fund revenue forecasts. For K-12 schools, TEEOSA school aid is first certified and then that amount is financed by both the proceeds from the premium tax and General Funds. The budgeted General Fund amounts for TEEOSA school aid already recognize the additional amount of insurance premium tax ($3 million in FY14 and $5.4 million in FY15).
Expand Nebraska Juvenile Service Delivery Project statewide (LB 561)
The Nebraska Juvenile Service Delivery Project (Project) began in January 2009 in Judicial District #4 (Douglas County). The Office of Probation Administration (Probation) and the Department of Health and Human Services (DHHS) worked together to provide services and options to juveniles and families in Nebraska’s juvenile justice system. The Project provided funding for needed rehabilitative services, allowing juveniles to stay in their home while being served in the community on probation. In 2012, LB985 expanded the Project to include Judicial District #11 (North Platte) and Judicial District #12 (Gering/Scottsbluff), in addition to Judicial District #4 (Douglas County)
LB561 enacted in the 2013 session, expands the Project statewide in a three step, phase-in process beginning July 1, 2013 with full implementation by July 1, 2014. The transfer of the cases and funding from the Office of Juvenile Services (OJS) to the Nebraska Juvenile Service Delivery Project (Project) will reduce costs in DHHS and increase costs in Probation. In FY14, $15,756,126 is reduced from HHS and added to Probation. Additional funding of $4,000,000 is provided to Probation to cover transition and infrastructure costs. In FY15 when all cases will be under the jurisdiction of Probation, the DHHS appropriation is reduced by $39,131,653 and provided to Probation. Additional funding of $4,833,670 is also provided to Probation for ongoing infrastructure costs and cost differences between HHS and Probation.
The bill also increases state aid for community based juvenile services programs by $1,522,425 in FY14 and $3,522,425 in FY15 bringing the total amount of aid funding to $3,000,000 in FY14 and $5,000,000 in FY15. A more detailed explanation can be found on page 60
Developmental Disability Aid
Funding for developmental disability aid has one of the largest percent growth in the budget. Funding was included for three specific areas of increase: (1) rate methodology, (2) transition clients, and (3) waiting list and amounted to a two year average growth of 11.3%
Defined Benefit Retirement Plans
Each fall, actuaries provide an assessment as to the status of the defined benefit plans to which the state provides funding. These are K-12 school employees, judges and the State Patrol. Other state
employees have a defined contribution or cash balance which is in essence a defined return plan. The fall 2012 report showed an investment return of 1% or less for the various plans leading to actuarial projected additional contributions of $52.7 million in FY14 and $67.7 million in FY15 or $120 million over the biennium.
These projected increases were largely negated due to changes enacted in LB553 passed this session. The net two year amount of additional contributions under LB 553 is $22.5 million most related to the increase in the state contribution rate from 1% to 2% of total compensation beginning July 1, 2014 for the school plan. Although there are additional costs incurred under LB553, the amounts are significantly less than what would have been necessary with no statutory change.
GENERAL FUND
General Fund Financial Status
Tax Rate Review Committee
(July 23, 2013)
Current Yr Biennial Budget Following Biennium July 25, 2013 FY2012-13 FY2013-14 FY2014-15 FY2015-16 FY2016-17
1 BEGINNING BALANCE
2 Beginning Cash Balance 498,526,356 814,678,170 257,921,459 252,557,794 218,860,862
3 Cash Reserve transfers-automatic (104,789,781) (285,292,610) 0 0 0
4 Carryover obligations from FY13 0 (294,682,194) 0 0 0
5 Lapse FY12 / FY13 reapproriations 0 20,000,000 0 0 0
6 Allocation for potential deficits 0 0 (5,000,000) (5,000,000) (5,000,000) _____________ _____________ _____________ _____________ _____________
7 Unobligated Beginning Balance 393,736,575 254,703,366 252,921,459 247,557,794 213,860,862
8 REVENUES
9 Net Receipts (April 2013 NEFAB+Hist Avg+bills) 4,047,001,258 4,020,687,000 4,157,329,000 4,349,887,000 4,609,898,000
10 General Fund transfers-out (current law ) (114,700,000) (121,300,000) (116,800,000) (117,050,000) (117,050,000)
11 General Fund transfers-in (current law ) in forecast in forecast in forecast 0 0
12 Cash Reserve transfers (current law ) 78,000,000 (53,000,000) 0 0 0
13 2014 Cash Reserve transfers 0 0 0 0 0
14 2014 General Fund transfers-out 0 0 0 0 0
15 2013 General Fund transfers-in 0 0 0 0 0
16 2014 Revenue Bills 0 0 0 0 0 _____________ _____________ _____________ _____________ _____________
17 General Fund Net Revenues 4,010,301,258 3,846,387,000 4,040,529,000 4,232,837,000 4,492,848,000
18 APPROPRIATIONS
19 Appropriations (2013 Session) 3,589,359,663 3,838,168,907 4,040,892,665 4,040,892,665 4,040,892,665
20 Projected budget increases, follow ing biennium -- -- -- 220,641,267 393,661,361
21 2014 Midbiennium Budget Adjustments 0 5,000,000 0 0 0
22 2014 State Claims 0 0 0 0 0
23 2014 "A" Bills 0 0 0 0 0 _____________ _____________ _____________ _____________ _____________
24 General Fund Appropriations 3,589,359,663 3,843,168,907 4,040,892,665 4,261,533,932 4,434,554,026
25 ENDING BALANCE
26 Dollar ending balance (Financial Status as show n) 814,678,170 257,921,459 252,557,794.00 218,860,862 272,154,836
27 Dollar ending balance (at Minimum Reserve) 228,633,379 -- 245,134,997 -- 261,502,217
28 Excess (shortfall) from Minimum Reserve 586,044,791 -- 7,422,797 -- 10,652,618
29 Biennial Reserve (%) 11.6% 3.1% 3.1%
General Fund Appropriations
30 Annual % Change - Appropriations (w /o deficits) 4.7% 5.7% 5.3% 5.5% 4.1%
31 Tw o Year Average 3.3% -- 5.5% -- 4.8%
General Fund Revenues
32 Est. Revenue Grow th (rate/base adjusted) 6.7% 2.3% 4.6% 5.3% 5.4%
33 Tw o Year Average 6.1% -- 3.5% -- 5.4%
34 Unadjusted change over prior year 9.6% -0.8% 3.4% 4.6% 6.0%
35 Unadjusted Tw o Year Average 7.6% - 1.3% - 5.3%
36 On-Going Revenues vs Appropriations 217,941,595 56,218,093 (363,665) (28,696,932) 58,293,974
CASH RESERVE FUND FY2012-13 FY2013-14 FY2014-15 FY2015-16 FY2016-17
General Fund Financial Status
End of 2013 Session
(Sine Die June 5, 2013)
Current Yr Biennial Budget Following Biennium July 25, 2013 FY2012-13 FY2013-14 FY2014-15 FY2015-16 FY2016-17
1 BEGINNING BALANCE
2 Beginning Cash Balance 498,526,356 472,744,719 243,028,773 237,664,978 203,968,429
3 Cash Reserve transfers-automatic (104,789,781) (232,934,000) 0 0 0
4 Carryover obligations from FY12 (267,812,760) 0 0 0 0
5 Lapse FY12 / FY13 reapproriations 3,846,613 0 0 0 0
6 Allocation for potential deficits 0 0 (5,000,000) (5,000,000) (5,000,000) _____________ _____________ _____________ _____________ _____________
7 Unobligated Beginning Balance 129,770,428 239,810,719 238,028,773 232,664,978 198,968,429
8 REVENUES
9 Net Receipts (April 2013 NEFAB+Hist Avg+bills) 4,000,000,000 4,020,686,961 4,157,328,870 4,349,887,383 4,609,897,800
10 General Fund transfers-out (current law ) (114,700,000) (121,300,000) (116,800,000) (117,050,000) (117,050,000)
11 General Fund transfers-in (current law ) in forecast in forecast in forecast 0 0
12 Cash Reserve transfers (current law ) 78,000,000 (53,000,000) 0 0 0
13 2014 Cash Reserve transfers 0 0 0 0 0
14 2014 General Fund transfers-out 0 0 0 0 0
15 2014 General Fund transfers-in 0 0 0 0 0
16 2014 Revenue Bills 0
_____________ _____________ _____________ _____________ _____________
17 General Fund Net Revenues 3,963,300,000 3,846,386,961 4,040,528,870 4,232,837,383 4,492,847,800
18 APPROPRIATIONS
19 Appropriations (2013 Session) 3,620,325,709 3,838,168,907 4,040,892,665 4,040,892,665 4,040,892,665
20 Projected budget increases, follow ing biennium -- -- -- 220,641,267 393,661,361
21 2014 Midbiennium Budget Adjustments 0 5,000,000 0 0 0
22 2014 State Claims 0 0 0 0 0
23 2014 "A" Bills 0 0 0 0 0 _____________ _____________ _____________ _____________ _____________
24 General Fund Appropriations 3,620,325,709 3,843,168,907 4,040,892,665 4,261,533,932 4,434,554,026
25 ENDING BALANCE
26 Dollar ending balance (Financial Status as show n) 472,744,719 243,028,773 237,664,978.00 203,968,429 257,262,203
27 Dollar ending balance (at Minimum Reserve) 227,264,410 -- 236,700,773 -- 261,068,451
28 Excess (shortfall) from Minimum Reserve 245,480,309 -- 964,205 -- (3,806,249)
29 Biennial Reserve (%) 6.4% 3.0% 3.0%
General Fund Appropriations 964,205 -- (3,806,249)
30 Annual % Change - Appropriations (w /o deficits) 4.7% 5.7% 5.3% 5.5% 4.1%
31 Tw o Year Average 3.3% -- 5.5% -- 4.8%
General Fund Revenues
32 Est. Revenue Grow th (rate/base adjusted) 5.4% 3.6% 4.7% 5.3% 5.4%
33 Tw o Year Average 5.5% -- 4.2% -- 5.4% Five Year Average 2.1% -- 5.7% -- 5.1%
34 Unadjusted change over prior year 8.2% -0.4% 3.9% 6.0% 5.5%
35 Unadjusted Tw o Year Average 6.9% - 1.7% - 5.8%
36 On-Going Revenues vs Appropriations 139,974,291 56,218,054 (363,795) (28,696,549) 58,293,774
CASH RESERVE FUND FY2012-13 FY2013-14 FY2014-15 FY2015-16 FY2016-17
Chronology of the
General Fund Financial Status
E
ND OF
2012
S
ESSION
(S
INE
D
IE
)
At the end of the 2012 legislative session, the projected financial status for the FY14/FY15 biennium reflected a $619.4 million projected shortfall from the minimum reserve. At that point, FY14/FY15 was the “out year” in the five year financial status and there was no projection for FY16/FY17 biennium. At the July 2012 meeting of the Tax Rate Review Committee (TRR), the General Fund financial status declined slightly to $624.4 million below the minimum reserve. FY2011-12 revenues were $52.9 million above forecast but under current law revenues above the certified forecast are transferred to the Cash Reserve Fund.
July 2012 TRR Committee Impact on Variance from Min Reserve (Millions of Dollars) FY13 FY14 FY15 Total Carryover obligations from FY10-11 0.2 0.0 0.0 0.2 FY12 vs Est General Fund Net Receipts 52.9 0.0 0.0 52.9 FY12 vs Est CRF transfers-automatic (52.9) 0.0 0.0 (52.9) FY12 vs Est Accounting adjustment (5.0) 0.0 0.0 (5.0) ______ ______ ______ ______ Total Change – July 2012 TRR Committee (4.6) 0.0 0.0 (4.6)
2012
I
NTERIM
The financial status improved significantly in November 2012 when the TRR committee again met. The shortfall from the minimum reserve declined from $624.4 million to $195 million due to a variety of revenue and spending items. Original Nebraska Economic Forecasting Advisory Board (NEFAB) forecasts for FY14 and FY15 were a combined $238 million above the previously used preliminary Legislative Fiscal Office (LFO) revenue estimates. Also the NEFAB increased their FY12-13 forecast by $57.9 million however these amounts are shown as transferred to the Cash Reserve Fund as prescribed under current law for revenues above certified forecast.
In addition to higher revenues, lower spending projections were used. Those projected appropriation levels used the latest estimates for TEEOSA school aid and information from the agency budget request.
November 2012 TRR Committee Impact on Variance from Min Reserve (Millions of Dollars) FY13 FY14 FY15 Total Revenue Forecasts (revised / original Oct 2012) 57.9 97.7 140.2 295.8 "Above certified" FY13 forecast to CRF 0.0 (57.9) 0.0 (57.9) Change in Minimum Reserve 0.0 0.0 (6.7) (6.7) ______ ______ ______ ______
Subtotal-Revenue 57.9 39.7 133.4 231.1
Revised TEEOSA aid estimates (Oct 2012 Joint Meeting) 0.0 87.3 114.5 201.8 Public Assistance+Child Welfare (8.2% to adjusted request) 0.0 23.1 39.2 62.3 Medicaid (7.5% to adjusted request) 0.0 3.4 21.7 25.1 Health Insurance increase (10% to 5% and Higher Ed request) 0.0 9.6 16.3 25.9 Operations cost increases (est to 24/7 facility request) 0.0 4.6 10.0 14.6 Replace onetime cash, fund shifts (HHS) 0.0 6.4 6.4 12.8 Behavioral health (3% to 0% request) 0.0 2.0 4.3 6.3 Defined benefit retirement funding (est to request) 0.0 (30.8) (55.8) (86.6) Health Care Reform 0.0 (12.3) (26.7) (39.0) Inmate per diem costs (6% vs request) 0.0 (3.6) (3.6) (7.3) Homestead exemption (3% to request) 0.0 (1.8) (2.3) (4.1) Revised estimate of budget increases, all other 0.0 (1.8) (1.7) (3.5) Developmental Disability aid (3% to transition only) 0.0 (1.2) (2.0) (3.2)
November 2012 TRR Committee Impact on Variance from Min Reserve (Millions of Dollars) FY13 FY14 FY15 Total FY13 Transfers-Out (EPIC cancelled per DAS email) 1.0 0.0 0.0 1.0 Deficit requests vs $5M (7.8) 0.0 0.0 (7.8)
______ ______ ______ ______ Subtotal-Appropriations (6.8) 84.8 120.3 198.3 Total Change – November TRR Committee 51.1 124.6 253.7 429.4
A
PPROPRIATIONS
C
OMMITTEE
P
RELIMINARY
B
UDGET
The earlier projected “shortfall” was eliminated in the committee preliminary budget by a combination of cash fund transfers, lapse of prior year carryover appropriations, and lower than projected increases in the budget. The projected status for the FY14/FY15 biennium shows an ending balance of $15.9 million above the minimum 3% reserve.
About 1/3 of the actions to balance are on the revenue side of which the bulk are transfers-in from several different cash funds. The other two-thirds of budget actions were on the spending side. Of these
spending actions the two largest items could be considered “cost avoidance”. In the case of TEEOSA aid and costs for defined benefit retirement plans the preliminary budget assumes passage of legislation which would partially negate the increases that had previously been projected and incorporated into the financial status for the November meeting of the Tax Rate Review Committee.
Committee Preliminary Budget Impact on Variance from Min Reserve (Millions of Dollars) FY13 FY14 FY15 Total General Fund transfers-in (not in pre-session) 0.0 37.2 37.2 74.4 General Fund transfers-out (interest in Prop Tax Credits) 0.0 2.0 2.0 4.0
Lapse reappropriations 5.0 0.0 0.0 5.0
Change in Minimum Reserve 0.0 0.0 (2.9) (2.9) ______ ______ ______ ______
Subtotal - Revenue 5.0 39.2 36.3 80.6
Aid to K-12 Schools (TEEOSA), to 5% per year 0.0 45.3 57.2 102.6 Retirement contributions, presession vs $21M 0.0 38.1 39.0 77.1 General Increases (University+State Colleges) 0.0 7.7 13.1 20.8 Employee Health Insurance 0.0 4.3 8.8 13.1
Homestead Exemption 0.0 5.1 4.6 9.7
Medicaid (w/o ACA, provider rate 0.0 2.0 2.0 4.0 Early Childhood Aid, back to GF 0.0 1.7 1.7 3.4 ACA Health Care Reform (oper+aid) 0.0 (7.5) (13.5) (21.0) DHHS provider rate increase 0.0 (14.6) (29.7) (44.4) Special Education 0.0 (4.8) (10.1) (14.9) Developmental Disability aid 0.0 (4.8) (9.6) (14.4) Restore staffing,housing units (Corrections) 0.0 (2.8) (2.8) (5.5) All Other appropriation changes 1.3 (1.2) 1.1 1.2 Deficits and Claims vs Nov TRR 14.5 0.0 0.0 14.5 Allocation for Post Hearing adjustments 0.0 (8.0) (8.0) (16.0) ______ ______ ______ ______ Subtotal - Appropriations 15.8 60.5 54.0 130.3 Total Change – Appropriations Committee Prelim Budget 20.9 99.7 90.3 210.9
R
EVISED
R
EVENUE
F
ORECASTS
-
F
EBRUARY
2013
In February the Nebraska Economic Forecasting Advisory Board (NEFAB) increased their revenue forecasts by a cumulative total of $120 million over the three fiscal years; $53 million for FY12-13, $40 million for FY13-14 and $27 million for FY14-15. This included increase in both the base forecasts as well as increases attributed to federal tax changes enacted in December 2012. In fact slightly over half of the increased forecast is attributed to the federal tax changes.
Fund. At the present time, FY2012-13 is the year applicable to the certified forecast and the $53 million increase would be considered above certified and is thus shown as a subsequent transfer to the Cash Reserve Fund.
Revised Revenue Forecasts Impact on Variance from Min Reserve (Millions of Dollars) FY13 FY14 FY15 Total Revenue Forecasts (Feb 2013) - Fed Tax Changes 10.4 25.5 26.7 62.6 Revenue Forecasts (Feb 2013) - Base Forecast Changes 42.6 14.5 0.3 57.4 "Above certified" FY13 forecast to CRF 0.0 (53.0) 0.0 (53.0) Change in Minimum Reserve 0.0 0.0 (2.0) (2.0) ______ ______ ______ ______ Total Change – February 2012 Forecast revisions 53.0 (13.0) 25.0 65.0
A
PPROPRIATIONS
C
OMMITTEE
P
OST
H
EARING
A
DJUSTMENTS
After weeks of budget hearings, the Appropriations Committee finalized their recommendation with a variety of funding and transfer adjustments totaling $39.7 million over the three year period. This included reductions to current FY13 appropriations in the deficit bill, funding of TEEOSA at the dollar level of LB407, and funding higher education at a 4% per year level as compared to the preliminary budget. The $39.7 use of funds when coupled with the $65 million gain from the February forecast results in an increase in the variance from the minimum reserve from $15.9 million to $41.3 million.
Committee Proposed Budget Impact on Variance from Min Reserve (Millions of Dollars) FY13 FY14 FY15 Total
Change in deficits 11.6 0.0 0.0 13.8
Transfer to NCCF 0.0 (4.0) 0.0 (4.0)
Cash Reserve Fund Transfer In 2.2 (4.0) 0.0 2.2 Change in Minimum Reserve 0.0 0.0 (1.0) (1.0) ______ ______ ______ ______ Subtotal - Revenue 13.8 (4.0) (1.0) 8.8 Remove allocation for post hearing adjustments 0.0 8.0 8.0 16.0 TEEOSA to modified LB407 level 0.0 (20.0) (1.3) (21.3) University, Colleges and Comm Colleges 4% per year 0.0 (9.8) (17.5) (27.4) Capital construction projects 0.0 (4.3) (8.8) (13.1) Early Childhood Education Endowment 0.0 (4.0) (4.0) (8.0) Decline in FY15 Medicaid match rate (includes ACA) 0.0 0.0 (7.5) (7.5) Fully fund DD rate methodology 0.0 2.5 (4.3) (1.8) Lower estimates, Medicaid eligibility/utilization 0.0 4.8 10.1 14.9 ACA behavioral health savings net of contingency 0.0 0.0 5.0 5.0 All other spending items 0.0 (2.1) (3.1) (5.3) ______ ______ ______ ______ Subtotal - Appropriations 0.0 (25.1) (23.4) (48.5) Total Change – Appropriations Committee Proposed Budget 13.8 (29.1) (24.4) (39.7)
R
EVISED
R
EVENUE
F
ORECAST
–
A
PRIL
2013
After the Appropriations Committee submitted their budget recommendations to the Legislature, the Nebraska Economic Forecasting Advisory Board (NEFAB) held their statutorily required April meeting to evaluate their revenue forecasts. At that meeting the NEFAB increased the revenue forecasts for all three years; $122 million in FY12-13, $22 million in FY2013-14 and $31 million in FY14-15. Included in the FY12-13 adjustment was an estimated one-time $125 million which is thought to be income taxes on capital gains related to the uncertainty and late revision in the federal laws regarding taxation of capital gains.
For FY12-13 revenue forecasts had been previously “certified” and by law any revenues above this certified amount are to be transferred to the Cash Reserve Fund. Therefore for purposes of the financial
status, the $122 million increase in the FY12-13 forecast is subsequently shown as transferred to the Cash Reserve Fund.
Revised Revenue Forecasts Impact on Variance from Min Reserve (Millions of Dollars) FY13 FY14 FY15 Total Revenue Forecasts (April 2013) - onetime income tax 125.0 0.0 0.0 125.0 Revenue Forecasts (April 2013) – base change (3.0) 22.0 31.0 50.0 "Above certified" FY13 forecast to CRF 0.0 0.0 (122.0) (122.0) Change in Minimum Reserve 0.0 0.0 (1.5) (1.5) ______ ______ ______ ______ Total Change - April 2013 NEFAB forecasts 122.0 22.0 (92.5) 51.5
F
LOOR
A
CTIONS
–
2013
S
ESSION
Budget actions from the time the Appropriations Committee submitted their recommendations to final enactment of the budget consist of (1) floor amendments, (2) Governor vetoes and overrides, and (3) enactment of revenue and spending legislation.
The first action taken was an Appropriations Committee amendment that transferred $53 million from the General Fund to the Cash Reserve Fund (CRF). This was the amount of the increased April revenue forecasts for FY13-14 and FY14-15. Since the FY13 increase would automatically by transferred to the CRF the amendment only related to the FY14 and FY15 forecast revisions. This action then left the financial status at the same level as the committee recommendation prior to the forecast changes. There were only four floor amendments affecting General Fund appropriations. Two were Appropriations Committee adjustments to the TEEOSA School aid amount; one to adjust the amount to match a
compromise amendment adopted to the formula changes, and the second was related to the amount of insurance premium taxes available for school aid. TEEOSA is financed with both an insurance premium tax allocation and General Funds. Another amendment removed $2.2 million from the deficit bill for replacement of a state plane. With the adoption of this amendment, an amendment was adopted to cancel a Cash Reserve Fund transfer to the General Fund that was the source of funding for the plane replacement.
The Governor line-item vetoed a total of $7.8 million General Funds from the mainline budget bills over the three years Of this amount, the Legislature overrode $6.5 million. The Governor also vetoed $11.8 million of transfers from the Securities Act Cash Fund to the General Fund and other funds. These vetoes were all overridden.
A total of $53.1 million was utilized over the two year period for new revenue and spending bills that were enacted. The largest items were LB 308 which eliminated the state federal alternative minimum tax ($7.8 million) and LB 561 which made significant changes to the juvenile justice system ($14.5 million)
2013 Floor Actions Impact on Variance from Min Reserve (Millions of Dollars) FY13 FY14 FY15 Total Committee Amendment - higher forecast to CRF 0.0 (53.0) 0.0 (53.0) Committee Amendment - TEEOSA (to compromise level) 0.0 8.1 0.5 8.7 Floor amendments - TEEOSA (insurance premium) 0.0 5.7 0.0 5.7 Floor amendments - other appropriations 2.2 0.0 (0.0) 2.1 Floor amendments - cancel CRF transfer (2.2) 0.0 0.0 (2.2)
Error in deficits (3.2) 0.0 0.0 (3.2)
Adjustment-state claims (0.3) 0.0 0.0 (0.3) Mainline vetoes-appropriation 0.2 3.6 4.0 7.8 Mainline veto overrides 0.0 (3.0) (3.5) (6.5) 2013 Revenue bills enacted 0.0 (0.5) (17.9) (18.4) 2013 A Bills enacted (1.0) (13.0) (20.7) (34.7)
FY2012-13
A
CTUAL
D
ATA
Receipts for FY2012-13 were $52.4 million above the forecast used at the end of the 2013 Legislative Session. As noted in other places, FY13 revenues in excess of the July 2012 certified forecast are to be transferred to the Cash Reserve Fund.
The amount of the minimum reserve increases by $8.4 million due to a technical change in the calculation of the reserve attributed to assuming 100% expenditure of funds in FY13 at Sine Die versus less than 100% expenditure with FY13 data but offsetting carryover of unexpended appropriations at the start of the next year. In this instance, in the reserve calculation both the numerator (available funds) and denominator (amount of appropriations) both increase by $275 million resulting in the $8.4 million difference.
With respect to the unexpended FY13 appropriations, all operations amounts were reappropriated while only encumbered state aid (and selected unexpended balances) are reappropriated. The certification of encumbrances is not completed until the end of August so at this point an estimated $20 million of lapsed unexpended appropriations is used based on an evaluation of individual aid programs.
Lastly, the $5.4 million of accounting adjustments include several transfers to other funds not previously accounted for under “transfers-out”. These are transfers out that are authorized in statute but not in specific amounts or occur on a deficit basis like the Omaha Convention Center support and tax amnesty allocation to the Dept of Revenue.
FY22012-13 Actual Data Impact on Variance from Min Reserve (Millions of Dollars) FY13 FY14 FY15 Total Carryover obligations from FY11-12 0.2 0.0 0.0 0.2 FY13 vs Est General Fund Net Receipts 52.4 0.0 0.0 52.4 FY13 vs Est CRF transfers-automatic 0.0 (52.4) 0.0 (52.4) FY13 vs Est Accounting adjustment (5.4) 0.0 0.0 (5.4) Assumed lapse, FY13 unexpended appropriations 0.0 20.0 0.0 20.0 Change in Minimum Reserve 0.0 0.0 (8.4) (8.4)
______ ______ ______ ______ Total Change – FY2012-13 Actual Data 47.3 (32.4) (8.4) 6.5
Table 1 Chronology of the Financial Status
FY14/FY15 FY16/FY17
(millions of dollars) Biennium Biennium
Variance from Minimum Reserve: Sine Die 2012 Session
(619.7)
NA
General Fund Net Receipts ( vs Est FY12) 52.9 --
Above certified FY12 receipts to Cash Reserve Fund (52.9 --
Accounting adjustment (5.0) --
Recalculate minimum reserve and accounting adjustment 2.2 --
Variance from Minimum Reserve: TRR July 2012
(624.3)
NA
Revised/initial revenue forecasts FY13, FY14 and FY15 295.8 -- Above certified est FY13 receipts to Cash Reserve Fund (57.9) --
Recalculate minimum 3% reserve (6.9) --
Variance from Minimum Reserve: NEFAB Oct 2012
(393.4)
NA
Revised estimate of FY13 deficits (vs $5 million allocation) (7.8) -- Revised estimate of FY14/FY15 projected budget (2 yr total) 205.3 --
Recalculate minimum 3% reserve / cancelled transfer 1.0 --
Variance from Minimum Reserve: TRR Nov 2012
(195.0)
(206.9)
Lapse reappropriations 5.0 5.0
Deficits and Claims vs Nov TRR 14.5 14.5
General Fund transfers-in (not in pre-session) 74.4 74.4
General Fund transfers-out (interest in Prop Tax Credits) 4.0 8.0
Aid to K-12 Schools (TEEOSA), to 5% per year 102.6 132.6
Retirement contributions, pre-session vs proposal 77.1 155.2
General Increases (University + State Colleges) vs pre-session est 20.8 47.0
Employee Health Insurance 13.1 36.9
Homestead Exemption 9.7 18.9
Medicaid (w/o ACA, provider rate 4.0 (5.5)
Early Childhood Aid, back to GF 3.4 6.8
Child Welfare aid 0.0 14.3
ACA Health Care Reform (oper+aid) (21.0) (29.6)
DHHS provider rate increase (44.4) (103.8)
Special Education (14.9) (35.0)
Allocation for Post Hearing adjustments (16.0) (32.0)
Restore staffing, housing units (Corrections) (5.5) (11.0)
Developmental Disability aid (14.4) (33.5)
All Other appropriation changes (with placeholder) 1.2 17.1
Change in Minimum Reserve (2.9) (6.3)
Appropriations Committee Preliminary Budget
15.9
67.0
Revenue Forecasts (Feb 2013) - Base Forecast Changes 57.4 64.4
"Above certified" FY13 forecast to CRF (53.0) (53.0)
Change in Minimum Reserve (2.0) (3.8)
Post February 2013 NEFAB forecasts
81.0
195.2
FY14/FY15 FY16/FY17
(millions of dollars) Biennium Biennium
Cash Reserve Fund Transfer In 2.2 2.2
Education-TEEOSA to modified LB407 level (21.3) (15.2)
University, Colleges and Comm Colleges 4% per year (27.4) (62.4)
Capital construction projects (13.1) (24.0)
Early Childhood Education Endowment (8.0) (16.0)
Decline in FY15 Medicaid match rate (includes ACA) (7.5) (22.5)
Fully fund DD rate methodology (1.8) (10.4)
Lower estimates, Medicaid eligibility/utilization 14.9 35.0
ACA behavioral health savings net of contingency 5.0 30.0
All other spending items (5.3) (18.4)
Change in Minimum Reserve (1.0) (0.0)
Appropriations Committee Budget to the Floor
41.3
133.1
Revenue Forecasts (April 2013) - onetime income tax 125.0 125.0
Revenue Forecasts (April 2013) - base 50.0 65.0
"Above certified" FY13 forecast to CRF (122.0) (122.0)
Change in Minimum Reserve (1.5) (2.0)
Post April 2013 NEFAB forecasts
92.7
199.1
Appropriations Committee Amendment - higher forecast to CRF (53.0) (53.0) Appropriations Committee Amendment - TEEOSA (to compromise level) 8.7 (3.6)
Floor amendments - TEEOSA (insurance premium) 5.7 5.7
Floor amendments - other appropriations 2.1 2.1
Floor amendments - cancel CRF transfer (2.2) (2.2)
Error in deficits (3.2) (3.2)
Adjustment-state claims (0.3) (0.3)
Mainline vetoes-appropriation 7.8 15.4
Mainline veto overrides (6.5) (12.5)
2013 Revenue bills enacted (18.4) (74.6)
2013 A Bills enacted (34.7) (80.6)
Change in Minimum Reserve 2.1 3.9
Sine Die 2013 Session (June 5, 2013)
1.0
(3.8)
Carryover obligations from FY11-12 0.2 0.2
FY13 vs Est General Fund Net Receipts 52.4 52.4
FY13 vs Est CRF transfers-automatic (52.4) (52.4)
FY13 vs Est Accounting adjustment (5.4) (5.4)
Assumed lapse, FY13 unexpended appropriations 20.0 20.0
Change in Minimum Reserve (8.4) (0.4)
Estimated Financial Status -
Following Biennium
For planning purposes, an estimated financial status is constructed for the biennium following the two-year biennial budget currently being considered. This allows the Legislature to see the future implications of budget actions being considered.
R
EVENUES
The NEFAB does not make official forecasts for the following biennium or what’s commonly referred to as the “out years”. Although different methodologies could be utilized, the revenue estimates used for the following biennium (FY15-16 and FY16-17) in the current financial status are derived using a “capped” historical average methodology. This “smoothing” technique derives “out year” revenue estimates by calculating the level of revenues that would yield a five year average growth (FY12 to FY17) roughly equal to the 31 year historical average (5.09%). Inherent in this methodology is the concept that within any five-year period, below average revenue growth in some years will be offset by above average growth in others and is visually seen in the line graph of historical adjusted revenue growth on page 27. The “capped” provision of this methodology means that if the derived growth needed in the out-years to achieve the historical average is above the “above average” years, growth is then capped at the average of the “above average years”. Likewise if the historical average method calls for below average growth in the out years, the growth is capped at the average of the “below average years”. Over the past 31 years, there were 10 years in which revenue growth was "below average" (0.7% average) and 21 years in which revenue growth was above average (7.1% average).
A
PPROPRIATIONS
For the “following biennium” (FY15-16 and FY16-17), the mainline budget numbers reflect the annualized impact of the current budget actions plus an estimate of future year increases in entitlement programs, salary and health insurance increases, and other funding requirements that are normally not optional. Obviously the funding needs in these areas will not be known until the biennial budget process starts again in two years. However for planning purposes, some level of funding for these items must be acknowledged and shown as likely funding commitments
Table 2 Projected Budget Increases-Following Biennium (includes on-going impact of 2013 budget actions)
Annual % Change Projected Increases
Dollar Changes from FY14 Base Year FY16 FY17 2 Yr Avg FY2015-16 FY2016-17
FY2013-14 Base Appropriation 4,040,892,665 4,040,892,665
TEEOS School Aid (TEEOSA) 10.0% 4.2% 7.1% 92,481,992 134,980,867 Special Education 2.5% 2.5% 2.5% 5,344,199 10,822,003 Community Colleges 3.5% 3.5% 3.5% 3,287,488 6,690,038 County Juvenile Services aid 3.0% 3.0% 3.0% 2,000,000 2,000,000 Homestead Exemption 3.0% 3.0% 3.0% 2,247,000 4,561,410 Aid to ESU's 2.5% 2.5% 2.5% 351,294 711,370 Medicaid 8.4% 7.9% 8.1% 64,617,097 130,780,476 Public Assistance 6.0% 6.0% 6.0% 6,490,884 13,371,222 Children’s Health Insurance (CHIP) -50.6% -36.0% -43.3% (11,343,108) (15,336,949) Child Welfare Aid 6.0% 6.0% 6.0% 4,166,387 8,457,766 Developmental Disability aid 4.0% 4.0% 4.0% 5,049,932 10,301,861 Behavioral Health aid -5.7% 3.0% -1.4% (3,279,674) (1,657,737) ACA Contingency -- -- -- 0 (5,000,000)
Annual % Change Projected Increases
Dollar Changes from FY14 Base Year FY16 FY17 2 Yr Avg FY2015-16 FY2016-17
Employee Salaries 2.5% 2.5% 2.5% 25,679,265 52,000,513 Employee Health Insurance 10.0% 10.0% 10.0% 15,228,217 31,979,256 Operations increases 2.0% 2.0% 2.0% 5,730,464 11,575,538 Inmate per diem costs 3.0% 3.0% 3.0% 1,367,115 1 2,775,244 ACA implementation (operations) -- -- -- 2,312,500 0 Juvenile Services reform (LB561-2013) 3.0% 3.0% 3.0% 703,176 1,427,447 Construction -- -- reaffirm only (1,585,000) (6,571,000)
All Other na (207,963) (207,963)
___________ ___________
Total General Fund Increases (Biennial Basis) 5.5% 4.1% 4.8% 220,641,267 393,661,361
Projected Appropriation per Financial Status 4,261,533,932 4,434,554,026
About 37% the total projected budget increase in the next biennium is TEEOSA school aid as projected under the current statute. General Funds for TEEOSA school aid is projected to increase by 10.0% in FY16 and 4.2% in FY17. The larger growth in FY16 reflects the change in the local effort rate (LER) which returns to $1.00 after two years at $1.03 and $1.025.
Another 32% of the projected increase is in Medicaid with an average growth of 8.1% per year. This reflects projected growth of 4.5% per year for population client eligibility and utilization and 3% per year for provider rates. Also included in this number are annualized impacts of the Affordable Care Act (ACA) as it phases in to full implementation..
The large decline in the Children’s Health Insurance program is the result of an expanded federal match rate (23%) from the Affordable Care Act. For FFY2015 to FFY2019 the federal match rate for SCHIP increases from an estimated 68% to 91%
A
ID TO
L
OCAL
G
OVERNMENTS
State Aid to Schools (TEEOSA)
The estimates for FY16 and FY17 are based on the samemethodology utilized for the November 15 estimates required under current law for the proposed biennial budget but with Fiscal Office assumptions and should be considered Fiscal Office estimates. They are based on the statutory changes made in LB407 as enacted in the 2013 session.. The estimates reflect a growth in overall school aid of 10% in FY16 and 4.2% in FY17.
In the following biennium, TEEOSA aid increases as parts of LB407 expire. Most significant is the local effort rate (LER) which returns to $1.00 after two years at $1.03 and $1.025.
Special Education
: Increases for FY15-16 and FY16-17 reflect a 2.5% per year increase. Although statute allows for a growth up to 5% the 2.5% is equal to the basic allowable growth rate under the K-12 school spending limitation and TEEOSA calculations.Aid to Community Colleges
A 3.5% per year annual increase is included for the following biennium budget reflecting increased state aid to support operations budget increases. This increase amounts to about a $3.3 million per year increase.Homestead Exemption
A 3% per year annual increase is included for the following biennium budget reflecting some level of inflationary increases.Aid to ESU's
The amount of aid to ESU's is based on funding of a certain level of core services and technology infrastructure. Growth in aid is set at the same rate as the basic allowable growth rate under the K-12 school spending limitation (2.5% per year).A
ID TO
I
NDIVIDUALS
Medicaid
For the following biennium, the average growth is 8.1% per year. This reflects projected growth of 4.5% per year for population client eligibility and utilization and 3% per year for provider rates. Also included in this number are annualized impacts of the Affordable Care Act (ACA) as it phases in to full implementation.Public Assistance and Child Welfare
A basic growth rate of 6.0% per year is utilized for the various Public Assistance programs for the following biennium. This reflects projected growth of 3% per year for population client eligibility and utilization and 3% per year for provider rates.Children’s Health Insurance (CHIP)
For the following biennium, a 7.5% per year increase is used which is the same as Medicaid. However the large decline is then the result of an expanded federal match rate (23%) from the Affordable Care Act. For FFY2015 to FFY2019 the federal match rate for SCHIP increases from an estimated 68% to 91%.Developmental Disability Aid
A 4% per year increase is included. This provides the equivalent of 2.5% per year for rate equity similar to the employee salary assumption and 1.5% for clients transitioning from K-12 programs. As this projected budget assumes no expanded programs, nothing is assumed for funding of the waiting list.Behavioral Health Aid
. This area includes substance abuse and mental health aid. The increases in the following biennium reflect a 3% increase to reflect some annual increase in provider rates. Savings related to insurance coverage for behavioral health under the Affordable Care Act (ACA) go from $15 million in FY2014-15 to $20 million in both FY16 and FY17.ACA Contingency
The FY14-15 budget included a $10,000,000 contingency appropriation if budgeted savings in the behavioral health program did not occur as planned. The amount allocated to the ACA Contingency program stays at $10,000,000 in FY16 and then declines to $5,000,000 in FY17 and then zero in FY18.A
GENCY
O
PERATIONS
/
C
ONSTRUCTION
Employee Salary Increases
Although salary increases will be the result of bargaining, some level of increase is factored in more for illustration than planning purposes. A 2.5% per year increase is included which approximates inflation and the current biennium funding.Employee Health Insurance
For planning purposes, a 10% per year increase in health insurance is included for the following biennium. Because rates have been flat for the past several years due to coverage and program changes and drawing down fund balances, this higher growth is utilized to anticipate a potential hike in rates.Operations Inflation
Included in the projected status is a general 2% increase in agency non-personnel operating costs. Although not provided as an across the board increase, this amount historically covers increases in utility costs at state and higher education facilities as well as food and other inflationary cost increases at 24/7 state facilities such as veterans homes, BSDC, etc…items such as food, clothing, and medical care. A 3% per year increase is included to reflect both inflationary costs and an increase in the number of inmates.
Defined Benefit Retirement Plans
The budget incorporated the changes provided in LB553 and assume no change in state funding from the level established in FY14.Juvenile Services reform
LB561 passed in the 2013 session made many significant changes in the juvenile justice system. The bill expands the Nebraska Juvenile Service Delivery Project statewide in a three-phase process with the transfer of such funds to take place on July 1, 2013, January 1, 2014, and July 1, 2014. After July 1, 2013, the Office of Juvenile Services within the Dept of Health and Human Services (HHS) will only have responsibility for the Youth Rehabilitation Centers at Kearney and Geneva. The shift of funding includes about $23 million that had previously been budget under child welfare aid. For purposes here, a 3% per year increase is included in operations for those amounts that hadpreviously been included under child welfare aid.
Capital Construction
General Fund dollars included in the projected budget for the following biennium for capital construction reflect reaffirmations only based on projects funding in the FY14/FY15 biennial budget. These are dollar amounts needed to complete funding of previously approved projects.Cash Reserve Fund
The Cash Reserve Fund (CRF) is not included as part of the "General Fund Reserve" (which is the ending General Fund balance for a biennium) and was created as a separate and distinct fund to cover cash flow needs within a month or several month period. The Cash Reserve Fund also serves as a “rainy day fund” in that revenues in excess of a “certified forecast” are transferred from the General Fund to Cash Reserve fund at the end of a fiscal year. As the certified forecast is basically the revenue estimate at Sine Die when the budget is finalized, these transfers sequester revenues in excess of that which is needed to balance the budget. The Cash Reserve Fund unobligated balance at the end of the current FY14/FY15 biennium is projected at $627 million.
Table 3 Cash Reserve Fund Status
Estimated Estimated Estimated Estimated Estimated FY2012-13 FY2013-14 FY2014-15 FY2015-16 FY2016-17
Beginning Balance 428,878,372 384,121,401 679,398,552 679,398,552 679,398,552 Excess of certified forecasts 104,789,781 285,292,610 0 0 0 To Gen Fund per current law (78,000,000) 0 0 0 0 To Nebr Capital Construction Fund (NCCF) (80,000,000) 0 0 0 0 To Affordable Housing Trust fund (1,000,000) 0 0 0 0 Repayment of Water Contingency transfer 4,991,572 0 0 0 0 EPIC cash flow transfers (LB379-2011) 4,461,676 0 0 0 0
2013 From General Fund 0 53,000,000 0 0 0
2013 Transfer to NCCF 0 (43,015,459) 0 0 0
__________ __________ __________ __________ __________ Ending Balance 384,121,401 679,398,552 679,398,552 679,398,552 679,398,552
E
XCESS OF
C
ERTIFIED
F
ORECASTS
Shown on line 3 of the Financial Status, revenues in excess of "certified" forecasts are required by statute to be transferred from the General Fund to the Cash Reserve Fund. These would take place in July of the fiscal year following completion of that year. The $104,789,781 transfer in FY13 reflects the amount the FY2011-12 receipts were above certified. This was $53 million above what was estimated at Sine Die 2012
The $285,292,610 million in FY2013-14 reflects the amount that the FY2012-13 exceeded the July certified level. This is $52.4 million higher than the estimate at Sine Die 2013.
T
RANSFERS
T
O
/
F
ROM
G
ENERAL
F
UND
Unlike the automatic transfers that occur after the close of the fiscal year and are statutorily required, other transfers can take place as specifically enacted by the Legislature. Transfers in FY2012-13 under existing law include LB 379-2011 ($68,000,000) and LB131-2012 ($10,000,000) to assist in balancing the budgets in those respective sessions.
Transfers to/from the General Fund FY2012-13 FY2013-14 FY2014-15 FY2015-16 FY2016-17 To General Fund, LB 379-2011 (68,000,000) 0 0 0 0 To General Fund, LB131-2012 (10,000,000) 0 0 0 0 Net Transfers to/From General Fund (78,000,000) 0 0 0 0
T
RANSFERS
T
O
/F
ROM
O
THER
F
UNDS
In the 2008 session, LB1094 provided for a $9 million transfer to the Water Contingency Cash Fund for the purpose of paying water right holders who agreed to lease and forgo water use to assist in the management, protection and conservation of the water resources of river basins, but remain unpaid due to litigation. Repayment by the NRD receiving said funds is required once the litigation is resolved no later than FY2012-13. The amount used was $8.5 million and is being repaid over two years, $3.6 million in FY12 and $4.99 million in FY13.
Also LB379-2011 allowed transfers to be made to the Ethanol Production Incentive (EPIC) Fund for cash flow purposes. A total of $4,461,676 was borrowed in FY2011-12 with repayment shown in FY2012-13. In the 2012 session there were two transfers made to other funds. The first is a $1 million transfer to the Affordable Housing Trust Fund which followed from notice of an amount to be credited from the National Mortgage Settlement. The second is an $80 million transfer to the Nebraska Capital Construction Fund (NCCF) for five different capital construction projects as shown below.
State Colleges - Chadron Armstrong Gym $6,700,000 State Colleges - Peru Oak Bowl improvements 7,500,000 University of Nebraska - UNK Allied Health 15,000,000 University of Nebraska - UNMC Cancer Research tower 50,000,000 DAS - Centennial Mall project 800,000
__________
Transfers to NCCF 80,000,000
2013
S
ESSION
T
RANSFERS
The enacted budget transfers $43 million from the Cash Reserve Fund to the Nebraska Capital
Construction Fund in FY13-14 to replace the facilities at the Grand Island Veterans Home. A description of this project can be found on page. Originally the Appropriation Committee included a $2,164,760 transfer to the General Fund in FY2012-13 to cover the costs of replacing a state plane funded in the deficit bill. When this funding was removed from the deficit bill, this transfer was then also removed. The enacted budget also includes a $53 million transfer from the General Fund to the Cash Reserve Fund (CRF). This transfer was the amount of the increased April 2013 revenue forecasts for FY13-14 and FY14-15.
Table 4 Cash Reserve Fund Historical Balances
Beginning
Direct
Deposit Automatic Legislative Transfers (2) Cash Ending Balance and Interest Transfers (1) Gen Fund Other Funds Flow Balance
FY1983-84 0 37,046,760 na 0 0 0 37,046,760 FY1984-85 37,046,760 (1,472,551) na 0 0 0 35,574,209 FY1985-86 35,574,209 227,855 na (13,500,000) 0 0 22,302,064 FY1986-87 22,302,064 1,428,021 na 0 0 0 23,730,085 FY1987-88 23,730,085 1,654,844 na 0 (7,700,000) 0 17,684,929 FY1988-89 17,684,929 139,000 na 32,600,000 0 0 50,423,929 FY1989-90 50,423,929 113,114 na (10,500,000) 0 0 40,037,043 FY1990-91 40,037,043 0 na (8,100,000) 0 0 31,937,043 FY1991-92 31,937,043 0 na (5,000,000) 0 0 26,937,043 FY1992-93 26,937,043 0 na (9,500,000) 0 0 17,437,043 FY1993-94 17,437,043 0 3,063,462 7,250,000 0 0 27,750,505 FY1994-95 27,750,505 0 (8,518,701) 7,250,000 (6,000,000) 0 20,481,804
Beginning
Direct
Deposit Automatic Legislative Transfers (2) Cash Ending Balance and Interest Transfers (1) Gen Fund Other Funds Flow Balance
FY1995-96 20,481,804 0 (20,481,804) 18,189,565 0 0 18,189,565 FY1996-97 18,189,565 0 19,740,786 3,032,333 0 0 40,962,684 FY1997-98 40,962,684 0 91,621,018 0 0 0 132,583,702 FY1998-99 132,583,702 0 111,616,422 (96,500,000) (2,000,000) 0 145,700,124 FY1999-00 145,700,124 0 20,959,305 3,500,000 (28,000,000) 0 142,159,429 FY2000-01 142,159,429 0 77,576,670 (24,500,000) (25,000,000) 0 170,236,099 FY2001-02 170,236,099 0 0 (59,800,000) (370,000) 0 110,066,099 FY2002-03 110,066,099 66,476,446 0 (87,400,000) 0 (30,000,000) 59,142,545 FY2003-04 59,142,545 59,463,461 0 (61,191,862) (385,807) 30,000,000 87,028,337 FY2004-05 87,028,337 8,170,556 108,727,007 (26,000,000) (758,180) 0 177,167,720 FY2005-06 177,167,720 0 261,715,297 0 (165,266,227) 0 273,616,790 FY2006-07 273,616,790 0 259,929,524 (15,674,107) (1,784,416) 0 516,087,791 FY2007-08 516,087,791 0 191,436,773 (60,177,767) (101,801,000) 0 545,545,797 FY2008-09 545,545,797 0 116,976,571 (54,990,505) (29,340,000) 0 578,191,863 FY2009-10 578,191,863 0 0 (105,000,000) (5,990,237) 0 467,201,626 FY2010-11 467,201,626 0 0 (154,000,000) 0 0 313,201,626 FY2011-12 313,201,626 8,422,528 145,155,092 (37,000,000) 3,560,802 (4,461,676) 428,878,372 FY2012-13 428,878,372 0 104,789,781 (78,000,000) (76,008,428) 4,461,676 384,121,401 FY2013-14 Est 384,121,401 0 285,292,610 53,000,000 (43,015,459) 0 679,398,552 FY2014-15 Est 679,398,552 0 0 0 0 0 679,398,552 FY2015-16 Est 679,398,552 0 0 0 0 0 679,398,552 FY2016-17 Est 679,398,552 0 0 0 0 0 679,398,552
(1) Automatic transfers reflect the prior year variance from forecast. For example the $285.3 million transfer in FY13-14 actually reflects FY12-13 "excess" receipts compared to the certified forecast. Prior to FY95-96 the transfers occurred in all cases. After FY95-96 transfers only occurred if receipts were above forecast.
GENERAL FUND
REVENUES
General Fund Revenue Forecasts
The current financial status includes actual FY2012-13 receipts while revenue estimates for FY2013-14 and FY2014-15 are the April 2013 forecasts from the Nebraska Economic Forecast Advisory Board (NEFAB) adjusted for legislation enacted in the 2013 Legislative Session.
The NEFAB does not make official forecasts for the following biennium or what’s commonly referred to as the “out years”. Although different methodologies could be utilized, the revenue estimates used for the following biennium (FY15-16 and FY16-17) in the current financial status are derived using a “capped” historical average methodology. This is a cyclical smoothing technique which derives “out year” revenue estimates by calculating the level of revenues that would yield a five year average growth (FY12 to FY17) roughly equal to the 32 year historical average (5.1%). Inherent in this methodology is the concept that within any five-year period, below average revenue growth in some years will be offset by above average growth in others and is visually seen in the line graph of historical adjusted revenue growth.
The “capped” provision of this methodology means that if the derived growth needed in the out-years to achieve the historical average is higher than the “above average” years, growth is then capped at the average of the “above average years”. Likewise if the historical average method calls for below average growth in the out years, the growth is capped at the average of the “below average years”. Over the past 32 years, there were 10 years in which revenue growth was "below average" (0.7% average) and 22 years in which revenue growth was above average (7.3% average).
Table 5 - General Fund Revenue Forecasts
Actual NEFAB+Bills NEFAB+Bills LFO Prelim LFO Prelim FY2012-13 FY2013-14 FY2014-15 FY2015-16 FY2016-17
Forecast (April 2013+Bills)
Sales and Use Tax 1,474,942,641 1,499,996,000 1,552,513,000 1,601,667,000 1,692,094,000 Individual Income Tax 2,101,912,041 2,039,395,000 2,109,989,000 2,281,593,000 2,466,177,000 Corporate Income Tax 275,562,990 265,000,000 285,000,000 289,000,000 292,000,000 Miscellaneous receipts 199,940,938 216,296,000 209,827,000 177,627,000 159,627,000
_____________ _____________ _____________ _____________ _____________
Current Revenue Forecast 4,052,358,610 4,020,687,000 4,157,329,000 4,349,887,000 4,609,898,000
Est Revenue Growth (base and rate adjusted
Annual 6.7% 2.2% 4.6% 5.3% 5.4%
Two Yr Average 6.1% - 3.4% - 5.4%
Five Yr Average 2.4% -- 5.7% -- 5.0%
Est Revenue Growth (unadjusted)
Annual 9.6% -0.8% 3.4% 4.6% 6.0%
Two Yr Average 7.6% - 1.3% - 5.3%
Five Yr Average 3.1% - 5.4% - 4.6%
Sine Die 2013
Revenue estimates for FY2012-13, FY2013-14 and FY2014-15 were the April 2013 forecasts from the Nebraska Economic Forecast Advisory Board (NEFAB) adjusted for legislation enacted in the 2013 Legislative Session. Rate and base adjusted revenue growth implied by the FY14/FY15 forecasts was 3.6% in FY13-14 and 4.7% in FY14-15 for a two year average of 4.2%, When including a 5.4% growth in