ASSOCIATIONS BETWEEN MATERNAL BODY DISSATISFACTION AND INFANT FEEDING STYLE AMONG A COHORT OF LOW-INCOME, NON-HISPANIC BLACK
MOTHER-INFANT DYADS
Kayla Boley
A thesis submitted to the faculty at the University of North Carolina at Chapel Hill in partial fulfillment of the requirements for the degree of Master of Science in the Department of
Nutrition in the Gillings School of Global Public Health.
Chapel Hill 2018
© 2018 Kayla Boley
ABSTRACT
Kayla Boley: Associations between maternal body dissatisfaction and infant feeding style among a cohort of low-income, non-Hispanic black mother-infant dyads
(Under the direction of Heather Wasser)
The prevalence of childhood and adolescent obesity has increased in the last several decades, with no evidence of plateau or decrease. Infant feeding style has been found to be associated with an increased risk of overweight and obesity in childhood and adolescence. This study sought to determine if maternal body dissatisfaction was associated with infant feeding style among a cohort of non-Hispanic black mother-infant dyads. A cross-sectional preliminary study found significant associations with non-responsive feeding styles early in the postpartum period. The current study explored this association longitudinally from 3- to 18-months of infant age. Multilevel mixed effects models indicate that maternal body dissatisfaction is positively associated with restrictive-diet-quality, and negatively associated with responsive-satiety
ACKNOWLEDGEMENTS
This thesis project could not have been completed without the guidance and assistance from Heather Wasser, Amanda Thompson, and Margaret Bentley. Their contributions are sincerely appreciated and gratefully acknowledged.
TABLE OF CONTENTS
LIST OF TABLES….……… vi
LIST OF FIGURES……….………..vii
LIST OF ABBREVIATIONS………. viii
CHAPTER 1: INTRODUCTION………1
CHAPTER 2: RESEARCH QUESTION AND STUDY AIMS……….... 2
CHAPTER 3: LITERATURE REVIEW……… 4
CHAPTER 4: PRELIMINARY STUDY: BSPH Honors Thesis Project………. 17
CHAPTER 5: MANUSCRIPT………..20
Overview……...……….………. ..20
Introduction…………...……….………... 21
Methods…………...……….………. 23
Results………...………… 27
Discussion………. 30
Conclusion…….………33
CHAPTER 6: SYNTHESIS………..……… 34
APPENDIX: TABLES AND FIGURES………...………... 37
LIST OF TABLES
Table 4.1. – Regression models of maternal body dissatisfaction and infant
feeding styles at 3 months postpartum……….. 39 Table 4.2. – Descriptive characteristics of variables at 3-18 month visits………... 40 Table 5.1. – Descriptive characteristics of variables from 3- to18-months infant
age.……….41 Table 5.2. – Results of unadjusted random coefficient models testing longitudinal
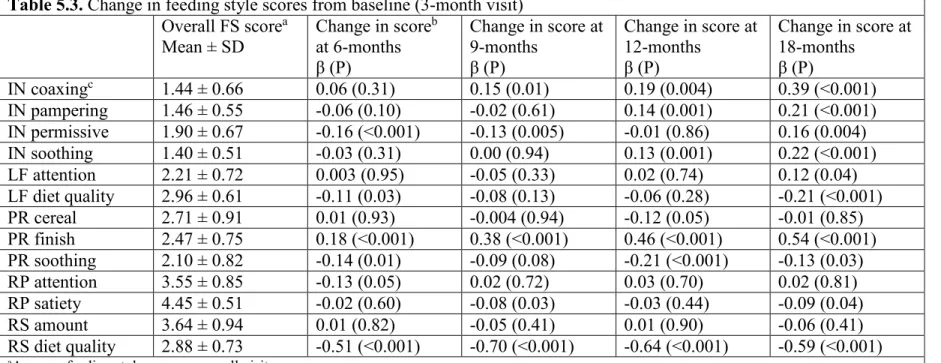
association between maternal body dissatisfaction and infant feeding style………...…. 45 Table 5.3. – Change in feeding style scores from baseline (3-month visit)……….………. 46 Table 5.4. – Results of random coefficient models testing longitudinal association
LIST OF FIGURES
Figure 3.1. – BIA-O figural silhouettes for women. The numbers (1-18)
represent the score for each silhouette………...…………... 37 Figure 4.1. – Cross-tabulation of maternal body dissatisfaction with BMI at
3-months postpartum from preliminary study……….……..38 Figure 5.1. – Frequency distribution for maternal body satisfaction scores
(CBS-IBS) at baseline………..…………. 43 Figure 5.2. – Frequency distribution for maternal body satisfaction scores
LIST OF ABBREVIATIONS BIA-O Body Image Assessment of Obesity
BMI Body Mass Index CBS Current Body Size FTT Failure To Thrive IBS Ideal Body Size
IBQ-R Infant Behavior Questionnaire-Revisited IFSQ Infant Feeding Style Questionnaire
IN Indulgent
LF Laissez-faire
NHANES National Health and Nutrition Examination Survey
PR Pressure
RBS Realistic Body Size
RP Responsive
RS Restrictive
SSB Sugar-Sweetened Beverage WAZ Weight-for-age z-score
CHAPTER 1: INTRODUCTION
The prevalence of obesity in children and adolescents is increasing, and remains high with 18.5% of children aged 2-19 years old classified as obese, and 7.9% considered extremely obese.1 The onset of obesity can occur at an early age; approximately 8.1% of infants and toddlers ages 0-24 months are obese.2 The prevalence of obesity increases with age, directing researchers to determine potential risk factors for rapid infant weight gain, which has been shown to be associated with subsequent childhood and adult overweight and obesity.3,4
Moreover, the prevalence of obesity differs by race, with non-Hispanic blacks having a higher prevalence than non-Hispanic whites at all ages,1 which demands a better understanding of predictive factors among this high-risk racial/ethnic group.
Non-responsive infant feeding styles, in which a parent is not attentive to child
hunger/satiety cues and fails to monitor the quality of the child’s diet,5 have been shown to result in suboptimal dietary intake.6–11As a potentially modifiable area of intervention,12–14 it is
important to determine what may cause the implementation of specific infant feeding styles. High maternal body dissatisfaction has been shown to be a predictor of restrictive and pressuring feeding styles among older children and adolescents.15,16 Most parents are dissatisfied with their current body size (75.3-98%),15,17,18 and body dissatisfaction has been shown to increase
throughout the postpartum period.19 However, minimal literature exists observing the
CHAPTER 2: RESEARCH QUESTION AND STUDY AIMS
The research question of the current study was: What are the associations, if any, between maternal body dissatisfaction and infant feeding style among low-income, non-Hispanic mother-infant dyads during the postpartum period?
For all aims of this study, data were used from the Infant Care, Feeding and Risk of Obesity Study (Infant Care), a prospective cohort of 217 low-income, non-Hispanic black first-time mothers aged 18 to 35 years recruited through the North Carolina Supplemental Nutrition Program for Women, Infants and Children (WIC). Data were collected when the infant was approximately 3, 6, 9, 12, and 18 months old during in-home visits. This sample was chosen because the study was conducted among non-Hispanic blacks, who have a higher risk for obesity compared to non-Hispanic whites. The dataset for this sample contains an extensive amount of data on mother-infant dyads during the early postpartum period.
The first aim of this study was to assess the degree of change in each of the 13 infant feeding style sub-constructs (main outcomes) between 3-18 months postpartum and determine the best-fitting growth models. It was hypothesized that the best-fitting model will be a mixed effects model that includes random effects for both the intercept and the slope versus a linear regression model with no random effects.
CHAPTER 3: LITERATURE REVIEW
The prevalence of obesity in children and adolescents has increased drastically over the last several decades, and remains high with 18.5% of children ages 2-19 currently obese (class I obesity; BMI ≥95th percentile), 6.0% fitting into the category of class II obesity (BMI ≥120% of the 95th percentile), and 1.9% classified as class III obese (BMI ≥140% of the 95th percentile).1 In the 1999-2000 National Health and Nutrition Examination Survey Cycle (NHANES), 14.6% of children aged 2-19 were classified as class I obesity, 4.0% as class II obesity, and 0.9% as class III obesity.1 Worth noting is the significant increase in class I obesity among children aged 2-5 years from the 2013-2014 NHANES cycle to the recent 2015-2016 cycle (9.3% to 13.7%; p=0.11).1 The risk of obesity can begin early in life. According to national data, 8.1% of infants and toddlers aged 0-24 months are obese (weight-for-length ≥95th percentile).2
Isong et al. explored socioeconomic and behavioral risk factors that may contribute to racial-ethnic disparities in child weight status among children beginning at 9-months of age through kindergarten entry.3 A greater portion of non-Hispanic black children (56.7%) belonged to households earning <$25,000 per year compared to non-Hispanic white children (19.8%).3 Non-Hispanic black children had the highest prevalence among obesity risk factors in infancy and early childhood of all racial/ethnic groups. These risk factors included never breastfed, early introduction of solid foods (≤4 months), sugar-sweetened beverage (SSB) consumption (≥1 serving of SSB/day), and fruit and vegetable consumption (<1 time/day).3 A significantly greater portion of non-Hispanic black (46.6%) infants were never breastfed compared to Hispanic
(23.8%) and non-Hispanic white (27.3%) infants. Similarly, 29.8% of non-Hispanic black infants were introduced to solid foods early compared to 21.2% of Hispanic and 23.9% of non-Hispanic infants.3 More non-Hispanic black (41.4%) children consumed SSBs than Hispanics (35.7%) and non-Hispanic whites (25%); 20.3% of non-Hispanic black children consumed <1 serving of fruit/vegetables per day, compared to 16.8% of Hispanic and 19.0% of non-Hispanic white children.3
females between these two groups.3 The explained difference by infant weight gain was less between male Hispanics and non-Hispanic whites (23%), but greater among females (69%).3
Rapid infant weight gain has been found to be associated with subsequent childhood and adult overweight and obesity. Ejlerskov et al. suggest that rapid growth in the first five months of life independently affects body composition and adiposity at three years of age among a cohort of healthy Danish children.4 Change in weight-for-age z-score (WAZ) from 0-5 months was found to be positively associated with BMI (β=0.65, p<0.001), fat mass index (β=0.42, p<0.001), and free-fat mass index (β=0.20, p<0.001).4 Further, obesity prevalence increases with age across all racial-ethnic populations. Among Hispanics, 15.6% of 2-5 year olds, 25% of 6-11 year olds, 22.8% of 12-19 year olds,20 41.2% of 20-39 year olds and 46.3% of 40-59 year olds are obese.21 Among non-Hispanic blacks, 10.4% of 2-5 year olds, 21.4% of 6-11 year olds, 22.6% of 12-19 year olds,20 45.2% of 20-39 year olds and 52.1% of 40-59 year olds are obese.21 Finally, among non-Hispanic whites, 5.2% of 2-5 year olds, 13.6% of 6-11 year olds, 19.6% of 12-19 year olds,20 31.2% of 20-39 year olds and 40.3% of 40-59 year olds are obese.21 The intractable nature of obesity is leading researchers to identify early-life factors that contribute to excess weight gain in the first two years of life.
pressuring/controlling style is when the caregiver is concerned with increasing the amount of food consumed by the infant and when food is used to soothe the infant. A restrictive/controlling feeding style is defined as the caregiver limiting the infant to healthful food and/or limiting the quantity of food consumed. An indulgent style is practiced when no limits are set on the quantity or the quality of food consumed or provided. Finally, a laissez-faire feeding style is characterized by minimal interaction with the infant during feeding as well as few limits on the quantity or quality of food provided or consumed.
Studies have found infant feeding styles to be associated with weight and body
composition in childhood and adolescence. Tovar et al. found a low demanding/high responsive feeding style to be positively associated with a higher BMI z-score (β=0.56, p=0.01) among recent immigrant children of Brazilian, Haitian, or Latino descent aged 3-12 years old.24 A low demanding/high responsive feeding style allows much freedom for the child, with minimal rules and demands regarding food.24 Among a multi-ethnic sample of mother-child dyads with
predictor of consistent weight gain through the first year of life.27 Wardle et al. examined 3-5 year old same-sex twins of overweight/obese parents or normal-weight/lean parents from England; they found a significant correlation between heavier first-born children
(overweight/obese) and maternal report of prompting/encouraging feeding style (0.19, p<0.01), but the correlation was insignificant in the second-born twin.28
pressure-to-eat assessed by the Child Feeding Questionnaire and pushing-pressure-to-eat assessed by the Preschooler Feeding Questionnaire were significantly correlated with child BMI (r=-0.15, p=0.001; r=-0.12, p=0.013, respectively).31
Moreover, each of the non-responsive feeding styles has been associated with suboptimal dietary intake among infants and toddlers, as well as preschoolers. Patrick et al. explored the role of authoritarian and authoritative feeding styles on food consumption among non-Hispanic black and Hispanic preschoolers.7 Authoritarian is defined as control of the child’s eating with little regard to child preference or choice; authoritative is classified as offering healthy foods, and the child has a choice among the healthy options.7 Authoritative feeding was positively associated with consumption of dairy (β=0.24, p<0.001), and vegetables (β=0.16, p<0.05), but authoritarian feeding was negatively associated with vegetable consumption (β=-0.16, p<0.05).7 Hoerr et al. found preschool children exposed to an indulgent feeding style to have lower intakes of fruits, 100% fruit juice and vegetables after 3:00PM (1.45 ± 0.09 cups) when compared to children of authoritarian parents--high demandingness, low responsiveness (1.77 ± 0.09 cups, p<0.017).8 Child intake of dairy foods was also lower with indulgent style (0.067 ± 0.05) versus
authoritarian (0.84 ± 0.05, p<0.017).8 Kroller et al. found child’s control, allowing the child to have control over his/her own intake, to be positively associated (β=0.305, p=0.007) with intake of fruits and vegetables among German children aged 3-6 years old.9 They also found a
rewarding feeding style—using food as a reward—to be inversely associated (β=-0.312, p=0.003) with fruits and vegetable intake.9 Several studies have found non-responsive feeding styles to also be associated with increased energy intakes and dysregulation of appetite.
demands on the child, was positively associated (β=0.30, p<0.05) with a higher child intake of low-nutrient-dense foods (energy-dense foods that provide modest nutritional value).10 An experiment was conducted by Fisher et al. in children aged 3-5 years old: children were restricted from a palatable food for five weeks, and the child’s food selection and intake was measured 3-weeks before and after the restrictive period.11 Upon observation, they found food intake (measured in grams) was higher during restricted snack sessions than unrestricted sessions (p<0.01); the effect did not differ by child’s age, sex, or experimental food.11
Furthermore, Thompson et al. found non-responsive infant feeding styles to be associated with infant energy intake, breastfeeding, and age-inappropriate feeding of liquid and solids among low-income, non-Hispanic black mother-infant dyads.6 Daily energy intake was assessed in non-breastfed infants: Higher scores of pressure-to-finish (β=31.14, p=0.05), pressuring-with-cereal (β=32.84, p=0.02), and indulgent-coaxing (β=42.51, p=0.01) were associated with a higher average daily energy intake. However, higher restrictive-diet-quality (β=-36.31, p=0.03) scores were associated with lower daily energy intake.6 Additionally, pressure-to-finish
(aOR=0.29, 95%CI: 0.34-0.61), pressuring-with-cereal (aOR=0.45, 95%CI: 0.27-0.74), indulgent-coaxing (aOR=0.15, 95%CI: 0.44-0.54), indulgent-permissive (aOR=0.31, 95%CI: 0.14-0.68), indulgent-soothing (aOR=0.17, 95%CI: 0.05-0.60), and indulgent-pampering (aOR=0.19, 95%CI: 0.06-0.60) were significantly associated with reduced odds of
inappropriate feeding.6 Age-inappropriate feeding was classified as receiving any liquids/solids except breast milk or formula at 3 months; cow’s milk or soy milk instead of formula or breast milk, juice, meat, cheese, eggs, junk food, fast food, or sweets at 6 months; cow’s milk or soy milk, junk food, fast food, or sweets at 9 months; and flavored milks, junk food, sweets, or fast food at 12 or 18 months.6 Kroller et al. also found pressure-to-eat to be positively associated (β=0.315, p=0.004) with a higher intake of problematic foods (i.e. fast food, snacks, soft drinks, sweets) by children aged 3-6 years of German nationality.9
This evidence of adverse dietary intake and inappropriate feeding at a young age supports recent national surveys documenting the early emergence of eating patterns in infants and
toddlers associated with obesity among older children and adults. Reidy et al. recently analyzed when different foods were introduced to the diet, how food consumption changes over time, and contribution to daily energy intake among a nationally representative cohort of children aged 6-47 months.32 They observed infant diet to contain all food groups by 6 months; the contribution of all food groups to total daily energy intake drastically increased between 4-14 months of age, from 10% to 65%, compared to 91-98% of energy from breast milk and/or formula from 0-5 months of age.32 At 24 months, diet stabilized; sweets, sweetened beverages, and snacks made up 17% of daily energy intake, while fruits made up 6% and vegetables only 4%.32 At just 24
toddlers consumed cow’s milk in a day.33 Moreover, approximately 10% of infants were
introduced to complementary foods before 4 months of age. Many older infants and toddlers (16-27%) aged 9-23 months did not consume fruit in any amount. At 18 months fruit and vegetable consumption mirrored that of an American adult, comprising less than 10% of energy, with half of vegetable calories derived from white potatoes.33 Additionally, sugar-sweetened beverages and desserts/sweets appeared in the infant diet as early as 4-5 months of age. At 9-11 months, 43% of infants consumed a dessert, sweet, or sweetened beverage at least once in a day, followed by 72% from 12-23 months, and 82-89% years 3-4 of life.33
Furthermore, Abraham et al. explored the associations between infant feeding and eating patterns in the second year among children in Scotland.34 They found that infants ever breastfed had higher odds of a positive eating pattern (i.e. consume a variety of fruit and vegetables daily, fruit and vegetables between meals, and eating meals with no snacking) in the second year of life compared to infants never breastfed (aOR=1.48, 95% CI: 1.27-1.73).34 Also, infants that began complementary feeding at 4-5 months (aOR=1.32, 95% CI: 1.09-1.59) or 6-10 months
(aOR=1.50, 95% CI: 1.19-1.89) when compared to 0-3 months were more likely to have a positive eating pattern at 2 years old.34 Similarly, Rodgers et al. examined how maternal feeding practices predict obesogenic eating behaviors in children aged 1.5-2.5 years.35 They found maternal monitoring to be a significant predictor (β=-0.14, p=0.005) of food approach behavior (i.e. good appetite and enjoyment of food).35 Emotional feeding, the use of food to regulate negative affect of the child, and encouragement contributed significantly to child tendency to overeat (β=0.14, p=0.021; β=0.15, p=0.012, respectively).35 Emotional feeding was also a
often in response to child distress in an attempt to coerce the child by offering preferred food and promoting intake.36 This behavior exacerbates the effects of an obesogenic environment,
promoting excessive energy intake, eating in the absence of hunger, and rapid weight gain.36 Few studies have explored feeding style differences across ethnicities, but they suggest that non-Hispanic blacks report a greater use of non-responsive feeding styles that non-Hispanic whites. Among mothers of preschool children, Hoerr et al. found the indulgent feeding style to predominate in non-Hispanic black mothers (40%), and authoritarian to be most prevalent among Hispanics (40%) (p<0.017).8 Furthermore, among mothers of children aged 7-14 years old, Spruijt-Metz et al. found non-Hispanic black mothers to score higher on all child-feeding subscales including monitoring of food intake (3.87 ± 0.69), food restriction (3.33 ± 0.96), and pressure-to-eat (2.71 ± 1.21) compared non-Hispanic white mothers (3.56 ± 0.90, p<0.039; 2.75 ± 0.99, p<0.002; 1.60 ± 0.77, p<0.001, respectively).37
Studies among mothers of older children and adolescents suggest that maternal
dissatisfaction with her body size may influence the development of her feeding style, but few studies have assessed this relationship among mothers of infants. The body image assessment defines body size dissatisfaction as the discrepancy between current and ideal body size estimates.38 Some assessments of body image measure estimates of actual body size, or
the silhouette that best represents his/her current and ideal body size. The cards are reshuffled between each selection. On the back of each card is a number, corresponding to the range of very thin to very obese; these numbers are used to create the body dissatisfaction discrepancy score: current body size score minus ideal body size score (CBS-IBS).38
Gray et al. examined predictive factors of parental restrictive feeding styles in a diverse sample of children and adolescents aged 7-17 years old.15 Regression analyses found parent body dissatisfaction, with a desire to be smaller in size, to significantly moderate the relationship between parent weight and parent use of restrictive feeding practices (F=8.10, p<0.001).15 They also found restrictive feeding practices increased with parent weight and high levels of body dissatisfaction (t=3.95, p<0.001), suggesting parents with high body dissatisfaction are more likely to practice restrictive feeding than parents with low body dissatisfaction (t=3.41, p<0.01).15 Duke et al. determined predictors of parental control over children’s eating at age seven; parental factors were assessed at birth of the child.16 They found a higher level of parental body dissatisfaction at birth to predict parental pressure-to-eat in sons (r=0.26, p<0.05) and daughters (r=0.25, p<0.05) at age seven.16 Thus, maternal body dissatisfaction may contribute indirectly to weight change in young children.
desired a larger body type.15 Boyington et al. found that more than 75% of low-income, non-Hispanic black women (n=105) between 0-6 months postpartum exhibited dissatisfaction with their current body size, with over half desiring weight loss and only 19.5% desiring an increase in size.18 Sarwer et al. found no difference in race for body dissatisfaction among obese
comprising a racially-ethnically diverse sample (n=4023), and found that non-Hispanic black women preferred larger silhouettes than non-Hispanic white women after controlling for BMI.43 They also found body dissatisfaction was lower among non-Hispanic blacks than non-Hispanic whites (β=-0.46, p<0.01).43
CHAPTER 4: PRELIMINARY STUDY
This current study is an expansion of a previous study that addressed a two-fold
objective: First, to assess the prevalence of maternal body dissatisfaction among a cohort of non-Hispanic black women early in the postpartum period, at 3- and 6-months of infant age.
Secondly, to determine the associations between maternal body dissatisfaction and infant feeding style at these two time points. It was hypothesized that mothers dissatisfied with their current body size would have lower mean scores on the domain of responsive feeding style and higher mean scores on one or more of the domains of non-responsive feeding style, as compared to mothers who are content with their current body size.
Data were collected through the Infant Care, Feeding and Risk of Obesity study among a cohort of first-time non-Hispanic black mothers recruited through the North Carolina
Supplemental Nutrition Program from Women Infants and Children (WIC). The preliminary study used the same dataset that was used for the current study, but observed a sub-sample of mothers cross-sectionally at 3- and 6-months of infant age. Mother-infant dyads were assessed during in-home visits when the infants were 3- and 6-months of age. Interviewer-administered questionnaire and anthropometry data were collected at each visit.
Maternal body dissatisfaction was assessed using the Body Image Assessment of Obesity (BIA-O).38 A measure of body dissatisfaction was calculated as the discrepancy between
(CBS-IBS < -1), satisfied with current size (-1 ≤ CBS-(CBS-IBS ≤ 1), and desiring to be smaller (CBS-(CBS-IBS > 1). The specific components and protocol of this assessment are further expanded upon in detail in the methods section of the current study.
The Infant Feeding Style Questionnaire (IFSQ)5 was used to assess maternal feeding style at each visit. The components of the questionnaire are described in the methods section of the current study. Scores were created for each of the 13 feeding style sub-constructs by calculating the mean score of the items corresponding to each sub-construct.
Descriptive statistics were used to assess important variables, and maternal body dissatisfaction was cross-tabulated with maternal BMI to observe the prevalence of
dissatisfaction across the four BMI categories: underweight (BMI<18.5), normal (BMI 18.5-24.9), overweight (BMI 25-29.9), and obesity (BMI≥30) at 3- and 6-months postpartum.
Bivariate logistic regression models analyzed the association between each of the infant feeding style sub-constructs and each of the independent variables. Adjusted multivariable logistic regression models were run to test for significant associations after controlling for important covariates: maternal age, maternal college education, marital status, any breastfeeding, obesity and depressive symptoms.
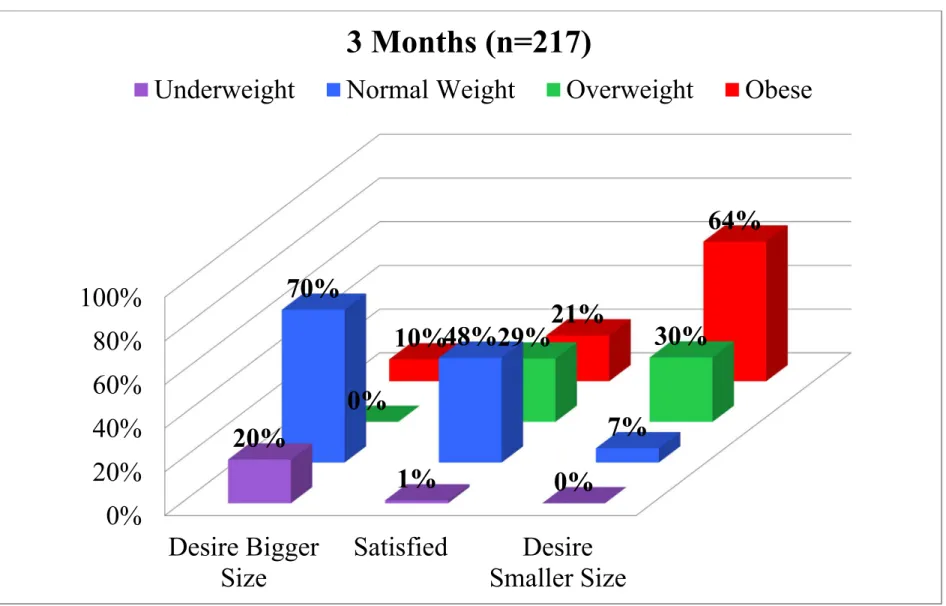
At 3 months postpartum, 65.4% of the mothers were dissatisfied with their current body size; 9.2% wanted to be bigger in size and 56.2% wanted to be smaller in size. The percent of mothers dissatisfied with their current body size was similar at 6 months postpartum in respect to mothers desiring to be bigger or smaller in size.
months postpartum. Also, 70% of mothers that desired to be bigger in size were considered to have a normal weight (Figure 4.1). There was a similar pattern of findings at 6 months with a slightly higher proportion (30.4%) of obese mothers satisfied with their current body size.
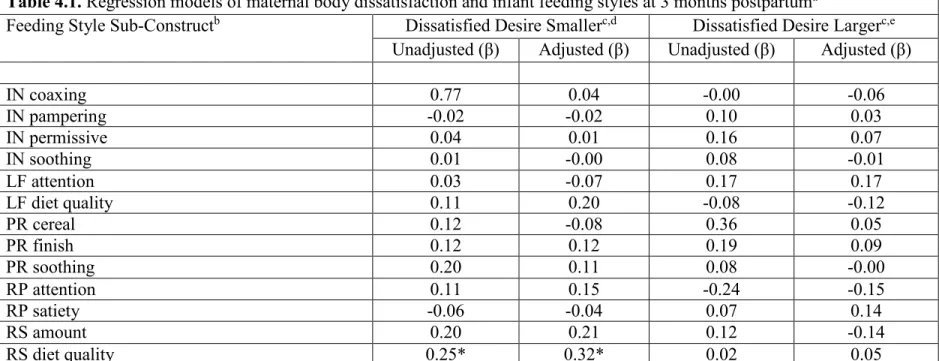
Among the cohort, maternal body dissatisfaction with a desire to be smaller in size was significantly associated with restrictive-diet-quality at 3 months postpartum (β=0.25; p<0.05) in the unadjusted model (Table 4.1). The association remained significant in the adjusted model (β=0.32; p<0.05). No other significant associations were found at the 3-month time period. At 6 months postpartum, maternal body dissatisfaction with a desire to be bigger in size was
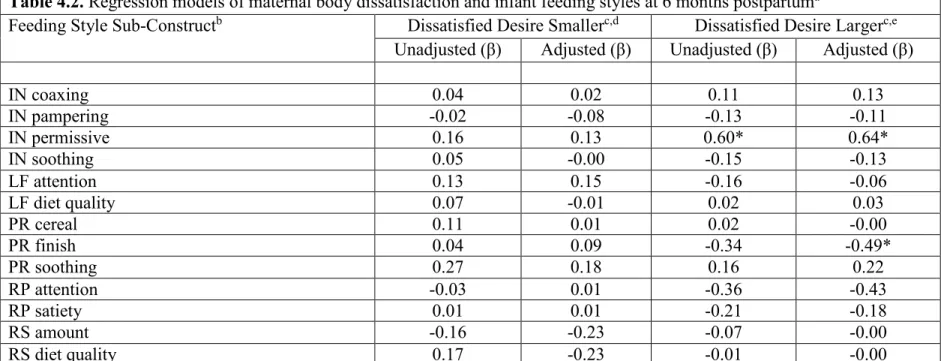
significantly associated with pressuring-to-finish (β=-0.46; p<0.05) after adjusting for covariates (Table 4.2). A mother desiring to be bigger in size was also significantly associated with an indulgent-permissive feeding style (β=0.63; p<0.01). No other significant associations were
CHPATER 5: MANUSCRIPT
ASSOCIATIONS BETWEEN MATERNAL BODY DISSATISFACTION AND INFANT FEEDING STYLE AMONG A COHORT OF LOW-INCOME, NON-HISPANIC BLACK MOTHER-INFANT DYADS
Overview
Obesity among children and adolescents has steadily increased in the past several
maternal body dissatisfaction contributes to variation in infant feeding practices. Interventions to improve infant feeding should target mothers during the early postpartum period.
Introduction
The prevalence of obesity in children and adolescents has nearly tripled over the last several decades, and remains high with 18.5% of children ages 2-19 currently obese (BMI ≥95th percentile) and 7.9% fitting into the category of severe obesity (BMI ≥120th percentile).1 The risk for obesity can begin early in life and there may be disparities by race and ethnicity. According to national data, 8.4% of non-Hispanic black infants and toddlers ages 0-24 months are obese, compared to 6.6% among non-Hispanic white infants and toddlers.2 Obesity can be intractable once established,44–48 leading researchers to identify early-life factors that contribute to excess weight gain in the first two years of life.
Indeed, several national surveys of dietary intake among infants and toddlers33 have documented the early emergence of eating patterns associated with obesity among older children and adults.32,34–36 This includes high intake of fast foods, fatty/sugary snack foods, juice and sweetened beverages, and low intake of vegetables, whole fruits, and whole grains. One promising target for intervention is parent feeding style—the beliefs and behaviors that
characterize approaches to maintaining or modifying children’s eating behavior5,22,23—as these have been associated with suboptimal dietary intake,8,9 and have been shown to be modifiable.12– 14
indulgent, and laissez-faire). A responsive feeding style is defined as a caregiver being attentive to a child’s hunger and satiety cues, and monitoring the quality of the child’s diet. A
pressuring/controlling style is when the caregiver is concerned with increasing the amount of food consumed by the infant and when food is used to soothe the infant. A restrictive/controlling feeding style is defined as the caregiver limiting the infant to healthful food and/or limiting the quantity of food consumed. An indulgent style is practiced when no limits are set on the quantity or the quality of food consumed or provided. Finally, a laissez-faire feeding style is characterized by minimal interaction with the infant during feeding as well as few limits on the quantity or quality of food provided or consumed. Each of the non-responsive feeding styles has been associated with one or more outcomes among infants and toddlers, as well as preschoolers, including lower intake of fruits and vegetables,7,8 higher energy intake and dysregulation of appetite,10,11,49 higher intake of junk-type foods,6,9 and greater adiposity,8,24–28 with non-Hispanic black mothers reporting greater use of more restrictive and pressuring feeding practices.37
Some research has suggested that non-Hispanic black women tend to be more accepting of a larger body size, and perceive their BMI as nearly four times smaller than the measured value.42,50 However, findings are mixed. For example, Boyington, Johnson, and Carter-Edwards found that more than 75% of black women between 0- and 6-months postpartum exhibited dissatisfaction with their current body size, with over half desiring weight loss and only 19.5% desiring an increase in size.18 Non-Hispanic black women experience significantly lower levels of body dissatisfaction than non-Hispanic white women.41,43 We find minimal studies examining body dissatisfaction among non-Hispanic black women during the early postpartum period, a factor that may be important to the establishment of infant feeding style.
The objective of this study was to determine the longitudinal association between maternal body dissatisfaction and infant feeding style from 3-18 month postpartum. We
hypothesize that mothers dissatisfied with their current body size will have lower mean scores on the domain of responsive feeding style and higher mean scores on the domains of non-responsive feeding styles when compared to mothers content with their current body size.
Methods
Study Design and Participants
failure to thrive (FTT), cerebral palsy, severe food allergy); were <2500 or above 4500 grams in birth weight; or had a chronic or congenital illness. Mother-infant pairs were assessed during in-home visits when the infants were 3, 6, 9, 12, and 18 months of age. Two hundred seventeen mother and infants participated in the 3-month baseline visit, 166 in the 6-month visit (76.5% of baseline), 168 in the 9-month visit (77.4% of baseline), 154 in the 12-month visit (71.0% of baseline), and 139 in the 18-month visit (64.1% of baseline). At each visit, an interviewer-administered questionnaire and anthropometry were collected. Data were collected from November 2003 to October 2007. The institutional review board at the University of North Carolina at Chapel Hill approved this study.
Measures
Infant Feeding Style
The Infant Feeding Style Questionnaire (IFSQ)5 was used to assess maternal feeding style at each visit. The IFSQ is a comprehensive measurement that uses 39 items to probe maternal beliefs regarding infant feeding (coded on a 5-point scale: disagree, slightly disagree, neutral, slightly agree, agree) and 24 items measuring feeding behaviors for all infants (coded on a 5-point scale: never, seldom, half of the time, most of the time, always), and an additional 20 items regarding solid feeding behaviors for infants above six months of age.6 The IFSQ assesses five feeding styles across 13 sub-constructs: laissez-faire (LF)-attention, LF-diet-quality;
distributed throughout the questionnaire, and a few items were inversely coded so that different responses would reflect “ideal” parenting.
Scores were created for each of the 13 sub-constructs by calculating the mean score of the items corresponding to each sub-construct. Construct scores were considered missing if an item response was missing in sub-constructs with 2 or 3 items, or when more than 1 item was missing in sub-constructs with 4 or more items. If only 1 item was missing in sub-constructs with 4 or more items, the sub-construct score was calculated without that item.
Maternal Body Dissatisfaction
Maternal body dissatisfaction was assessed using the Body Image Assessment of Obesity (BIA-O), which has been validated against BMI among black women.38 The BIA-O is composed of 18 silhouette figures of women ranging from very thin to very obese displayed on the front of 18 cards. Administration of the BIA-O includes shuffling the 18 cards and presenting them in random order. To assess current body size (CBS), the mother is prompted to “Select the silhouette that most accurately represents your body size, as you perceive it to be right now. Please be honest. You must choose only one silhouette and you may not rearrange the cards to directly compare the silhouettes.” The interviewer then records the number of the card selected (1-18); this number is the CBS score. The number is written on the back of the card so the participant cannot use the number as an aid in selecting a body size estimate.38 The cards are then reshuffled and presented in a new random order. The mother is instructed to “Select the
reshuffled and presented in a new random order. The mother is instructed to “Select a silhouette that represents a body size that you believe is realistic for you to maintain over a long period of time. Again, select only one silhouette and do not rearrange the cards.” The recorded score is realistic body size (RBS). From these responses, two discrepancy scores were calculated to define maternal body dissatisfaction (i.e. CBS-IBS and CBS-RBS). These scores can range from -17 (choosing a silhouette 17 times larger than current silhouette) to +17 (choosing a silhouette 17 times smaller than current silhouette).
To distinguish women dissatisfied with their current body size that desired to be smaller in size from those that desired to be larger, we created a three-level categorical variable for each discrepancy score: desiring to be larger IBS/RBS <-1), desiring to be smaller (CBS-IBS/RBS >1), and satisfied with current size (-1≤CBS-(CBS-IBS/RBS ≤1). We felt the two groups of dissatisfied women represented theoretically different categories of dissatisfaction, thus it was important to assess the relationship within each group.
Covariates
The inclusion of covariates was based on the literature35,51–57 and theoretical importance. Maternal characteristics include maternal age, maternal college education, marital status, any breastfeeding, obesity and depressive symptoms. Maternal perception variables included infant activity, infant distress-to-limitations/fussiness, if the mother thinks her infant is thin, and if the mother thinks her infant is overweight. Infant activity and fussiness were subscales of the Infant Behavior Questionnaire-Revisited (IBQ-R).58 Infant sex was also included. Maternal
(kg)/height (m)2. Maternal obesity was defined as a BMI > 30 kg/m2. The Center for
Epidemiological Studies Depression Scale was used to measure maternal depression, with a score of 16 or greater indicating the presence of depressive symptoms.59
Statistical Analysis
Descriptive statistics were run to assess the distribution of all variables. Mixed effects models analyzed the degree of change in each of the thirteen infant feeding style sub-constructs (dependent variables) between 3-18 months postpartum. The best-fitting growth model (i.e. linear regression, random-intercept, or random slope) for each style was determined using the likelihood ratio test. Longitudinal mixed effects models were used to assess the association between each of the infant feeding style sub-constructs and each of the independent variables (maternal body dissatisfaction and covariates). An adjusted, multilevel mixed-effects linear regression model was used to analyze the association between maternal body dissatisfaction (e.g. ideal or realistic) and infant feeding style. Covariates were included if they were found to be significantly associated with maternal body dissatisfaction or infant feeding style sub-constructs in the unadjusted random intercept or random slope models at a conservative significance level of p<0.05, or if its presence changed the beta-coefficient by greater than 10%. Stata 14 SE was used for all analyses.
Results
The study sample consisted of 217 low-income, non-Hispanic black mother-infant dyads. Mother-infant dyads lost to follow-up did not differ significantly on important baseline
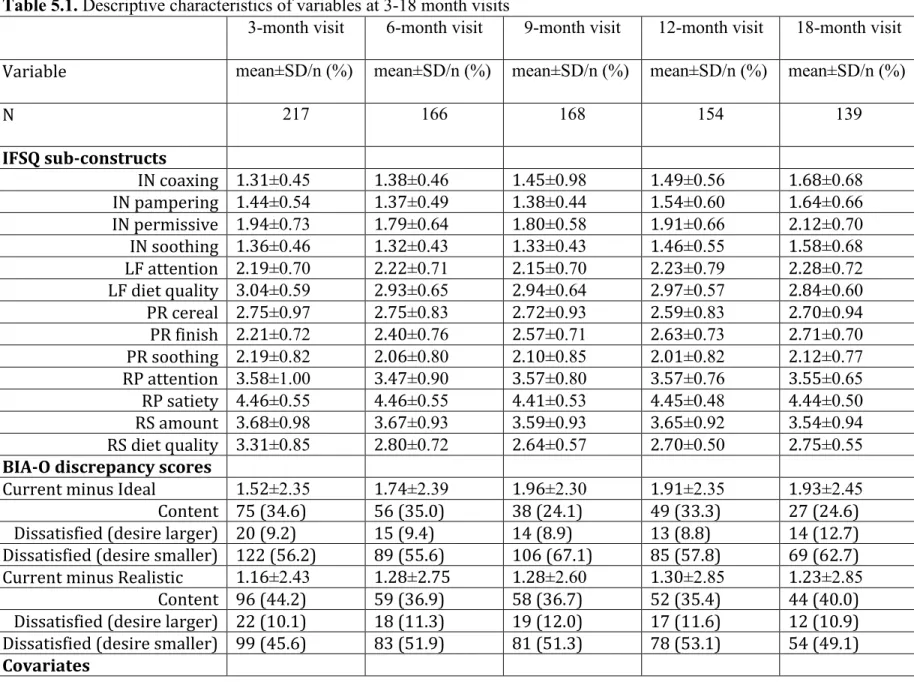
sub-constructs, and infant gender are presented in Table 5.1. At baseline (3-months infant age), mothers had a mean age of 22.67±3.81, 42.5% had some college education, 9.8% were married, 29.1% had depressive symptoms, 44.2% were obese, and 22.6% were doing any breastfeeding. Maternal perception of infant size varied across the postpartum period. Approximately 20% and 3% of mothers perceived their infant to be overweight at 3- and 18-months postpartum,
respectively, while 2.3% and 22.5% of mothers perceived their infant to be thin at 3- and 18-months, respectively. On average, maternal perception of infant activity and distress to limitations were higher for older versus younger infants.
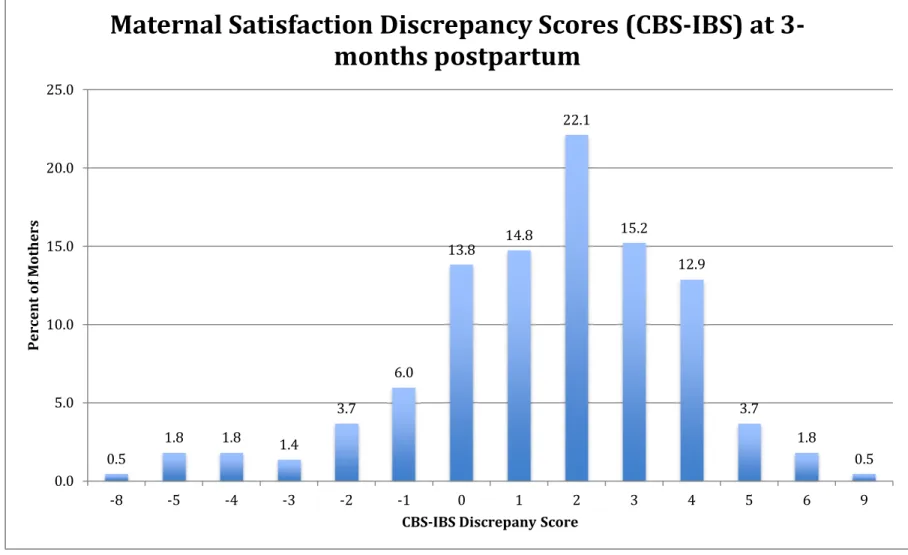
From 3- to 18-months infant age, means scores were highest for responsive satiety feeding style, and lowest for indulgent feeding practices (i.e. coaxing, pampering, permissive, soothing). At baseline, the frequency distribution of maternal body satisfaction discrepancy scores (CBS-IBS) ranged from -8 to +9 (Figure 5.1). Most mothers were dissatisfied with their current body size (65.4%); 56.2% desired to be smaller in size and 9.2% desired to be bigger in size. Body satisfaction scores with respect to realistic body size (CBS-RBS) ranged from -9 to +9 at baseline (Figure 5.2). In regard to a realistic body size, 55.8% of mothers were dissatisfied with their current body size; 45.6% believed a smaller body size was more realistic, and 10.1% believed a larger body size was more realistic. Frequency distributions of body dissatisfaction scores did not change over time.
two-level variables to distinguish mothers content with their current body size from those dissatisfied: dissatisfied (CBS-IBS/RBS <-1 or CBS-IBS/RBS >1) and content (1≤ CBS-IBS/RBS ≤1).
Random coefficient models yielded the best fit for feeding style sub-constructs (Table 5.3). Bivariate random coefficient models found that maternal age, maternal obesity, depressive symptoms, any breastfeeding, and college education, as well as maternal perception of infant size (overweight and thin), infant activity and distress to limitations were significantly associated with infant feeding style sub-constructs (P<0.05). Inclusion of infant gender in the models changed the beta-coefficient by more than 10%. Adjusted models therefore included this set of covariates.
Distress to limitations was found to be a significant covariate, but it is not a subscale administered to mothers of 12- and 18-month-olds. Thus there was only data for this variable at 3, 6, and 9 months infant age. In determining whether this variable should be included in the adjusted longitudinal model, it was found that there was no significant difference in any of the feeding style sub-constructs between the 9-month and 12-month or the 9-month and 18-month visits. Therefore, the decision to include distress to limitations in the adjusted model was justified due to there being no difference in feeding style after the 9-month time point. As a result, final random coefficient models testing the association between body dissatisfaction and infant feeding styles were run excluding data for any variables from 12- and 18-months, and observed the association from 3-9 months infant age.
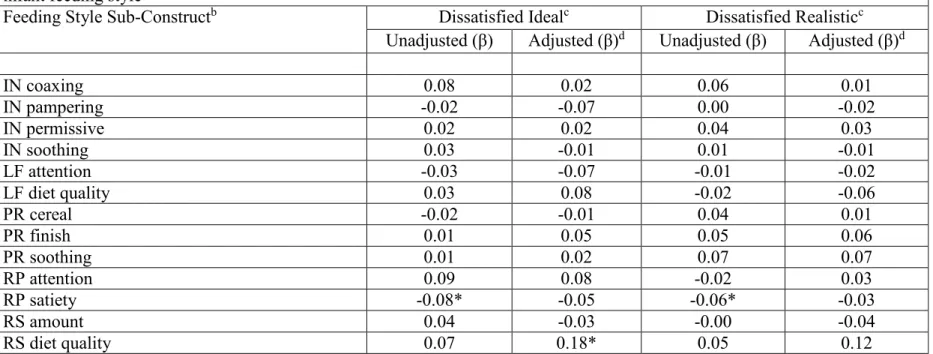
reference to a realistic body size (CBS-RBS) had a 0.06 lower mean score on responsive-satiety with infant age when compared to content mothers. These associations were observed in the unadjusted longitudinal mixed effects models, but were attenuated in the adjusted models. Maternal body dissatisfaction was also significantly associated with restrictive-diet quality (p<0.05) (Table 5.4). After adjusting for covariates, in comparison to mothers content with their current body size, dissatisfied mothers (CBS-IBS) had a 0.18 higher mean score in restrictive-diet quality feeding style with increasing infant age. No other significant associations with non-responsive feeding styles were observed throughout this postpartum period.
Discussion
This study assessed maternal body dissatisfaction as a potential determinate of infant feeding style, and thus infant dietary intake and weight gain. Body image dissatisfaction may determine the motivation behind a mother’s infant feeding practices. A dissatisfied self-perception may dictate how a mother feeds her infant: in order to combat a dissatisfied
perception of infant size the mother may disregard infant satiety/hunger cues. This study found that non-Hispanic black women are dissatisfied with their current body size, and prefer smaller body sizes, contradicting previous literature stating non-Hispanic black women prefer larger body silhouettes. These findings suggest that there may not be racial-ethnic disparities in body size preference.
cues. It has been previously reported that mothers who are less sensitive to their infant’s satiety cues had infants that gained more weight from 6- to 12-months of age.61 Similarly, it was found that responsiveness to satiety/hunger cues was inversely associated with current infant size.5 To our knowledge, this is one of the few studies62 to report an association between body
dissatisfaction and feeding style. Mothers dissatisfied with their current body size may not recognize infant satiety/hunger cues, resulting in less responsive feeding behaviors. These mothers may be unable to properly recognize and respond to their own huger and satiety, resulting in body image dissatisfaction.
The restrictive-diet-quality model within the IFSQ assesses the mother’s beliefs with respect to consumption of junk food, sweets, and fast food, as well as maternal behavior regarding allowing the consumption of junk and fast food. Therefore, a higher score on this infant feeding style subscale can be interpreted as good, and beneficial to the infant. However, previous literature has found that restrictive feeding practices predict higher BMI and percent body fat among older children,29 and restriction from palatable foods resulted in a higher amount of food intake following the restrictive period.11 As these affects have been observed in older children, we do not know if restrictive feeding has the same affect during infancy. Thompson et al.6 found higher restrictive-diet-quality scores to be associated with higher subsequent WAZ but better infant diets, potentially due to the limited opportunity to eat foods not provided by the caregiver. Restrictive infant feeding can be comparable to “covert” control defined by Ogden and her colleagues66 as a form of restriction not apparent to the child, involving management of the food available in the home and social environment, which can be beneficial for child weight. Additional research is needed to further conceptualize this feeding style domain among infants and toddlers.
As observed in previous research,53,55,67 maternal characteristics of age, college
education, marital status, breastfeeding, obesity, depressive symptoms, perception of infant size, and infant temperament, as well as infant gender had a significant association with feeding style in this sample of first-time, low-income, non-Hispanic black mothers. This highlights the importance of targeting this high-risk population.
overweight and obesity should target mothers to educate them about postpartum weight and body changes, as well as responsive feeding practices.
The current study had several strengths, including the analysis of a wide spectrum of feeding constructs and the ability to observe the association over time, addressing changes in maternal and infant characteristics. Yet this study is not without limitations: The sample
comprised low-income, non-Hispanic black mothers and infants, limiting generalizability to the wider population. Non-Hispanic black women differ from other race and ethnicities in previous studies with respect to body dissatisfaction and feeding styles. Therefore, this relatively
homogenous sample may have limited current findings between the exposure and outcome in regard to what may be observed in a more varying sample population. Yet the expected
outcomes of this study were confirmed: mothers dissatisfied with their current body size scored higher on non-responsive infant feeding subscales, and scored lower on responsive infant feeding subscales when compared to mothers content with their current body size.
Conclusion
Among low-income, non-Hispanic black mother-infant dyads in central North Carolina, it was concluded that maternal body dissatisfaction is associated with non-responsive feeding practices in the early postpartum period. Importantly, maternal body dissatisfaction with respect to ideal body size (i.e. CBS-IBS) was positively associated with restrictive-diet-quality, limiting infants to healthful foods. These finding are important for future interventions targeting the improvement of infant feeding practices. Future research should examine this relationship in larger, more heterogeneous samples.
CHAPTER 6: SYNTHESIS
Major findings from this study include maternal body dissatisfaction (i.e. CBS-IBS and CBS-RBS) is inversely associated with a responsive-satiety feeding style with increasing infant age. Maternal body dissatisfaction (i.e. CBS-IBS) is also positively associated with restrictive-diet-quality after adjusting for important maternal and infant characteristics. It is concluded from this study that maternal body dissatisfaction is associated with non-responsive feeding practices in the early postpartum period. Minor findings confirm a change in feeding style with infant age.
This study contributes to the exploration of factors that predict infant feeding style. We affirmed previous findings among older children and adolescents, supporting associations between maternal body dissatisfaction and restrictive feeding styles.15,64 However, because our sample is uniform to non-Hispanic black mothers, we cannot confirm that non-Hispanic black mothers report a greater use of non-responsive feeding styles.37 We can confirm a reduction in responsive feeding style, and a greater prevalence of a restrictive feeding practice within this sample. This study adds to factors that explain the variation in the responsive feeding style domain. DiSantis et al.62 found that a longer duration in breastfeeding resulted in mothers reporting greater responsiveness to infant satiety. We found that maternal body dissatisfaction, with respect to ideal and realistic body size is associated with less responsiveness to infant hunger and satiety cues.
infant age to prevent onset of feeding practices that can result in long-term adverse affects. Breastfeeding from the breast serves as a natural feeding practice that enables the infant to regulate and respond to their hunger and satiety; yet among this population, at the 3-month visit, only 22.6% of the mothers were performing any breastfeeding. Mothers are feeding formula and/or introducing solid foods at an early age and should be educated on beneficial feeding practices. Childhood obesity is on a continuous upward trend, and non-Hispanic black and Hispanic children are at greatest risk.1 It is crucial that we intervene in infancy to prevent the onset of obesity, targeting the mothers through education on infant/child feeding and bettering their confidence in and perception of body image.
This study was able to observe the association between maternal body dissatisfaction and infant feeding style longitudinally accounting for changes in maternal and infant characteristics, while also observing a wide spectrum of infant feeding style sub-constructs. Among a sample of low-income, non-Hispanic black first-time mothers, these findings have limited generalizability outside of this relatively homogenous population.
APPENDIX: TABLES AND FIGURES
Figure 3.1. BIA-O figural silhouettes for women. The numbers (1-18) represent the score for each silhouette.38
3
Figure 4.1. Cross-tabulation of maternal body dissatisfaction with maternal BMI at 3-months postpartum
0%
20%
40%
60%
80%
100%
Desire Bigger
Size
Satisfied
Desire
Smaller Size
20%
1%
0%
70%
48%
7%
0%
29%
30%
10%
21%
64%
3 Months (n=217)
Underweight
Normal Weight
Overweight
Obese
3
Table 4.1. Regression models of maternal body dissatisfaction and infant feeding styles at 3 months postpartuma
Feeding Style Sub-Constructb Dissatisfied Desire Smallerc,d Dissatisfied Desire Largerc,e Unadjusted (β) Adjusted (β) Unadjusted (β) Adjusted (β)
IN coaxing 0.77 0.04 -0.00 -0.06
IN pampering -0.02 -0.02 0.10 0.03
IN permissive 0.04 0.01 0.16 0.07
IN soothing 0.01 -0.00 0.08 -0.01
LF attention 0.03 -0.07 0.17 0.17
LF diet quality 0.11 0.20 -0.08 -0.12
PR cereal 0.12 -0.08 0.36 0.05
PR finish 0.12 0.12 0.19 0.09
PR soothing 0.20 0.11 0.08 -0.00
RP attention 0.11 0.15 -0.24 -0.15
RP satiety -0.06 -0.04 0.07 0.14
RS amount 0.20 0.21 0.12 -0.14
RS diet quality 0.25* 0.32* 0.02 0.05
aModels control for maternal age, obesity, depressive symptoms, marital status, any breastfeeding, college education, perception of infant size, infant
temperament, and infant gender.
bFeeding style are abbreviated: LF=laissez-faire, PR=pressuring, RS=restrictive, RP=responsive, and IN=indulgent
cThe beta coefficient is the difference in feeding style score between mothers dissatisfied with their current body size versus satisfied (referent). Satisfied
was defined as a discrepancy score (CBS-IBS or CBS-RBS) between or equal to -1 and +1.
dDissatisfied (smaller) was defined as a discrepancy score greater than +1. eDissatisfied (larger) was defined as a discrepancy score below -1.
*Significance: p<0.05
3
Table 4.2. Regression models of maternal body dissatisfaction and infant feeding styles at 6 months postpartuma
Feeding Style Sub-Constructb Dissatisfied Desire Smallerc,d Dissatisfied Desire Largerc,e Unadjusted (β) Adjusted (β) Unadjusted (β) Adjusted (β)
IN coaxing 0.04 0.02 0.11 0.13
IN pampering -0.02 -0.08 -0.13 -0.11
IN permissive 0.16 0.13 0.60* 0.64*
IN soothing 0.05 -0.00 -0.15 -0.13
LF attention 0.13 0.15 -0.16 -0.06
LF diet quality 0.07 -0.01 0.02 0.03
PR cereal 0.11 0.01 0.02 -0.00
PR finish 0.04 0.09 -0.34 -0.49*
PR soothing 0.27 0.18 0.16 0.22
RP attention -0.03 0.01 -0.36 -0.43
RP satiety 0.01 0.01 -0.21 -0.18
RS amount -0.16 -0.23 -0.07 -0.00
RS diet quality 0.17 -0.23 -0.01 -0.00
aModels control for maternal age, obesity, depressive symptoms, marital status, any breastfeeding, college education, perception of infant size, infant
temperament, and infant gender.
bFeeding style are abbreviated: LF=laissez-faire, PR=pressuring, RS=restrictive, RP=responsive, and IN=indulgent
cThe beta coefficient is the difference in feeding style score between mothers dissatisfied with their current body size versus satisfied (referent). Satisfied
was defined as a discrepancy score (CBS-IBS or CBS-RBS) between or equal to -1 and +1.
dDissatisfied (smaller) was defined as a discrepancy score greater than +1. eDissatisfied (larger) was defined as a discrepancy score below -1.
*Significance: p<0.05
4
Table 5.1. Descriptive characteristics of variables at 3-18 month visits
3-month visit 6-month visit 9-month visit 12-month visit 18-month visit
Variable mean±SD/n (%) mean±SD/n (%) mean±SD/n (%) mean±SD/n (%) mean±SD/n (%)
N 217 166 168 154 139
IFSQ sub-constructs
IN coaxing 1.31±0.45 1.38±0.46 1.45±0.98 1.49±0.56 1.68±0.68
IN pampering 1.44±0.54 1.37±0.49 1.38±0.44 1.54±0.60 1.64±0.66
IN permissive 1.94±0.73 1.79±0.64 1.80±0.58 1.91±0.66 2.12±0.70
IN soothing 1.36±0.46 1.32±0.43 1.33±0.43 1.46±0.55 1.58±0.68
LF attention 2.19±0.70 2.22±0.71 2.15±0.70 2.23±0.79 2.28±0.72
LF diet quality 3.04±0.59 2.93±0.65 2.94±0.64 2.97±0.57 2.84±0.60
PR cereal 2.75±0.97 2.75±0.83 2.72±0.93 2.59±0.83 2.70±0.94
PR finish 2.21±0.72 2.40±0.76 2.57±0.71 2.63±0.73 2.71±0.70
PR soothing 2.19±0.82 2.06±0.80 2.10±0.85 2.01±0.82 2.12±0.77
RP attention 3.58±1.00 3.47±0.90 3.57±0.80 3.57±0.76 3.55±0.65
RP satiety 4.46±0.55 4.46±0.55 4.41±0.53 4.45±0.48 4.44±0.50
RS amount 3.68±0.98 3.67±0.93 3.59±0.93 3.65±0.92 3.54±0.94
RS diet quality 3.31±0.85 2.80±0.72 2.64±0.57 2.70±0.50 2.75±0.55 BIA-O discrepancy scores
Current minus Ideal 1.52±2.35 1.74±2.39 1.96±2.30 1.91±2.35 1.93±2.45
Content 75 (34.6) 56 (35.0) 38 (24.1) 49 (33.3) 27 (24.6) Dissatisfied (desire larger) 20 (9.2) 15 (9.4) 14 (8.9) 13 (8.8) 14 (12.7) Dissatisfied (desire smaller) 122 (56.2) 89 (55.6) 106 (67.1) 85 (57.8) 69 (62.7) Current minus Realistic 1.16±2.43 1.28±2.75 1.28±2.60 1.30±2.85 1.23±2.85
Content 96 (44.2) 59 (36.9) 58 (36.7) 52 (35.4) 44 (40.0) Dissatisfied (desire larger) 22 (10.1) 18 (11.3) 19 (12.0) 17 (11.6) 12 (10.9) Dissatisfied (desire smaller) 99 (45.6) 83 (51.9) 81 (51.3) 78 (53.1) 54 (49.1)
Covariates
4
Maternal Age 22.67±3.81
Obese 96 (44.2) 72 (45.0) 72 (45.3) 65 (43.6) 44 (39.6) Depressive Symptoms 62 (29.1) 46 (29.1) 37 (23.7) 26 (18.1) 41 (37.3) Married 21 (9.8) 16 (10.0) 19 (12.3) 17 (12.1) 17 (15.9) Any Breastfeeding 49 (22.6) 24 (15.0) 19 (12.0) 8 (5.4) 3 (2.8) Some College Education 91 (42.5) 72 (45.0) 73 (45.9) 73 (49.0)
Believe Infant Thin 5 (2.3) 11 (7.0) 14 (9.1) 28 (19.7) 29 (22.5) Believe Infant Overweight 40 (18.7) 26 (16.5) 13 (8.4) 13 (9.2) 4 (3.1)
Infant Activity 4.11±0.82 4.70±0.78 4.84±0.74 5.48±0.71 5.39±0.78
Distress to Limitations 3.46±0.74 3.66±0.80 4.02±0.77
Infant Gender
Male 101 (46.5) 78 (48.8) 75 (47.2) 73 (49.0) 74 (46.5)
4
Figure 5.1. Frequency distribution for maternal body satisfaction scores (CBS-IBS) at baseline
0.5
1.8 1.8 1.4
3.7 6.0 13.8 14.8 22.1 15.2 12.9 3.7 1.8 0.5 0.0 5.0 10.0 15.0 20.0 25.0
-8 -5 -4 -3 -2 -1 0 1 2 3 4 5 6 9
P e r c e n t o f M o th e r s
CBS-IBS Discrepany Score
Maternal Satisfaction Discrepancy Scores (CBS-IBS) at
3-months postpartum
4
Figure 5.2. Frequency distribution for maternal body satisfaction scores (CBS-RBS) at baseline
0.5 0.9 0.9 0.9
1.8 5.1 9.2 16.1 18.9 15.7 16.6 8.3 3.2 1.4 0.5 0.0 2.0 4.0 6.0 8.0 10.0 12.0 14.0 16.0 18.0 20.0
-9 -8 -6 -4 -3 -2 -1 0 1 2 3 4 5 6 9
P e r c e n t o f M o th e r s
CBS-RBS Discrepancy Score
Maternal Satisfaction Discrepancy Scores (CBS-RBS) at
3-months poatpartum
4
Table 5.2. Results of unadjusted random coefficient models testing longitudinal association between maternal body dissatisfaction (i.e. smaller or bigger) and infant feeding style
Feeding Style Sub-Constructa Dissatisfied Idealb Dissatisfied Realisticb
Biggerc Smallerc Biggerc Smallerc
IN coaxing 0.14 0.06 0.12 0.06
IN pampering 0.03 -0.03 -0.00 0.01
IN permissive 0.14 -0.02 0.06 0.04
IN soothing 0.12 0.01 -0.01 0.02
LF attention 0.01 -0.04 -0.04 0.01
LF diet quality -0.06 0.05 0.00 -0.03
PR cereal -0.00 -0.02 0.14 0.01
PR finish -0.03 0.01 0.1 0.03
PR soothing 0.05 0.00 0.06 0.07
RP attention -0.01 0.12 -0.06 -0.00
RP satiety -0.12 -0.07 -0.09 -0.06
RS amount -0.01 0.06 0.06 -0.02
RS diet quality 0.06 0.07 -0.00 0.06
aFeeding style are abbreviated: LF=laissez-faire, PR=pressuring, RS=restrictive, RP=responsive, and IN=indulgent
bThe beta coefficient is the difference in feeding style score between mothers dissatisfied with their current body size versus satisfied (referent).
Satisfied was defined as a discrepancy score (CBS-IBS or CBS-RBS) between or equal to -1 and +1.
cDissatisfied (chose smaller size) was equal to >1; dissatisfied (chose bigger size) was equal to <-1.
*Significance: p<0.05
4
Table 5.3. Change in feeding style scores from baseline (3-month visit) Overall FS scorea
Mean ± SD
Change in scoreb at 6-months β (P)
Change in score at 9-months
β (P)
Change in score at 12-months
β (P)
Change in score at 18-months
β (P)
IN coaxingc 1.44 ± 0.66 0.06 (0.31) 0.15 (0.01) 0.19 (0.004) 0.39 (<0.001)
IN pampering 1.46 ± 0.55 -0.06 (0.10) -0.02 (0.61) 0.14 (0.001) 0.21 (<0.001) IN permissive 1.90 ± 0.67 -0.16 (<0.001) -0.13 (0.005) -0.01 (0.86) 0.16 (0.004) IN soothing 1.40 ± 0.51 -0.03 (0.31) 0.00 (0.94) 0.13 (0.001) 0.22 (<0.001) LF attention 2.21 ± 0.72 0.003 (0.95) -0.05 (0.33) 0.02 (0.74) 0.12 (0.04) LF diet quality 2.96 ± 0.61 -0.11 (0.03) -0.08 (0.13) -0.06 (0.28) -0.21 (<0.001)
PR cereal 2.71 ± 0.91 0.01 (0.93) -0.004 (0.94) -0.12 (0.05) -0.01 (0.85)
PR finish 2.47 ± 0.75 0.18 (<0.001) 0.38 (<0.001) 0.46 (<0.001) 0.54 (<0.001) PR soothing 2.10 ± 0.82 -0.14 (0.01) -0.09 (0.08) -0.21 (<0.001) -0.13 (0.03)
RP attention 3.55 ± 0.85 -0.13 (0.05) 0.02 (0.72) 0.03 (0.70) 0.02 (0.81)
RP satiety 4.45 ± 0.51 -0.02 (0.60) -0.08 (0.03) -0.03 (0.44) -0.09 (0.04)
RS amount 3.64 ± 0.94 0.01 (0.82) -0.05 (0.41) 0.01 (0.90) -0.06 (0.41)
RS diet quality 2.88 ± 0.73 -0.51 (<0.001) -0.70 (<0.001) -0.64 (<0.001) -0.59 (<0.001)
aAverage feeding style score across all visit
bCoefficient from longitudinal mixed effects models predicting rate of change in feeding style since 3-month visit cFeeding style are abbreviated: LF=laissez-faire, PR=pressuring, RS=restrictive, RP=responsive, and IN=indulgent
4
Table 5.4. Results of random coefficient models testing longitudinal association between maternal body dissatisfaction and infant feeding stylea
Feeding Style Sub-Constructb Dissatisfied Idealc Dissatisfied Realisticc
Unadjusted (β) Adjusted (β)d Unadjusted (β) Adjusted (β)d
IN coaxing 0.08 0.02 0.06 0.01
IN pampering -0.02 -0.07 0.00 -0.02
IN permissive 0.02 0.02 0.04 0.03
IN soothing 0.03 -0.01 0.01 -0.01
LF attention -0.03 -0.07 -0.01 -0.02
LF diet quality 0.03 0.08 -0.02 -0.06
PR cereal -0.02 -0.01 0.04 0.01
PR finish 0.01 0.05 0.05 0.06
PR soothing 0.01 0.02 0.07 0.07
RP attention 0.09 0.08 -0.02 0.03
RP satiety -0.08* -0.05 -0.06* -0.03
RS amount 0.04 -0.03 -0.00 -0.04
RS diet quality 0.07 0.18* 0.05 0.12
aModels control for maternal age, obesity, depressive symptoms, marital status, any breastfeeding, college education, perception of infant size, infant
temperament, and infant gender.
bFeeding style are abbreviated: LF=laissez-faire, PR=pressuring, RS=restrictive, RP=responsive, and IN=indulgent
cThe beta coefficient is the difference in feeding style score between mothers dissatisfied with their current body size versus satisfied (referent).
Satisfied was defined as a discrepancy score (CBS-IBS or CBS-RBS) between or equal to -1 and +1. Dissatisfied was defined as a discrepancy score below -1 or greater than +1.
dAssociations from 3-9 months infant age.
*Significance: p<0.05
4
REFERENCES
1. Skinner, Asheley Ravanbakht, Sophie Skelton, Joseph Perrin, Eliana Armstrong S.
Prevalence of Obesity and Severe Obesity in US Children , 1999-2014. 2018;141(3):1116-1123. doi:10.1002/oby.21497
2. Ogden CL, Carroll MD, Kit BK, Flegal KM. Prevalence of childhood and adult obesity in the United States, 2011-2012. JAMA - J Am Med Assoc. 2014;311(8):806-814.
doi:10.1001/jama.2014.732
3. Isong IA, Rao SR, Bind M-A, Avendaño M, Kawachi I, Richmond TK. Racial and Ethnic Disparities in Early Childhood Obesity. Pediatrics. 2018;141(1):e20170865.
doi:10.1542/peds.2017-0865
4. Ejlerskov KT, Christensen LB, Ritz C, Jensen SM, Molgaard C, Michaelsen KF. The impact of early growth patterns and infant feeding on body composition at 3 years of age. Br J Nutr. 2015;114(2):316-327. doi:10.1017/S0007114515001427
5. Thompson AL, Mendez MA, Borja JB, Adair LS, Zimmer CR, Bentley ME. Development and validation of the Infant Feeding Style Questionnaire. Appetite. 2009;53(2):210-221. doi:10.1016/j.appet.2009.06.010
6. Thompson AL, Adair LS, Bentley ME. Pressuring and restrictive feeding styles influence infant feeding and size among a low-income African-American sample. Obesity.
2013;21(3):562-571. doi:10.1002/oby.20091
7. Patrick H, Nicklas TA, Hughes SO, Morales M. The benefits of authoritative feeding style: Caregiver feeding styles and children’s food consumption patterns. Appetite.
2005;44(2):243-249. doi:10.1016/j.appet.2002.07.001
8. Hoerr SL, Hughes SO, Fisher JO, Nicklas TA, Liu Y, Shewchuk RM. Associations among parental feeding styles and children’s food intake in families with limited incomes. Int J Behav Nutr Phys Act. 2009;6:55. doi:10.1186/1479-5868-6-55
9. Kröller K, Warschburger P. Associations between maternal feeding style and food intake of children with a higher risk for overweight. Appetite. 2008;51(1):166-172.
doi:10.1016/j.appet.2008.01.012
10. Hennessy E, Hughes SO, Goldberg JP, Hyatt RR, Economos CD. Permissive Parental Feeding behavior is associated with an increase in intake of low-nutrient-dense foods among American children living in rural communities. J Acad Nutr Diet.
2012;112(1):142-148. doi:10.1016/j.jada.2011.08.030
12. Daniels LA, Mallan KM, Battistutta D, et al. Child eating behavior outcomes of an early feeding intervention to reduce risk indicators for child obesity: The NOURISH RCT. Obesity. 2014;22(5):104-111. doi:10.1002/oby.20693
13. Holland JC, Kolko RP, Stein RI, et al. Modifications in parent feeding practices and child diet during family-based behavioral treatment improve child zBMI. Obesity.
2014;22(5):119-126. doi:10.1002/oby.20708
14. Spence AC, Campbell KJ, Crawford DA, McNaughton SA, Hesketh KD. Mediators of improved child diet quality following a health promotion intervention: The Melbourne InFANT Program. Int J Behav Nutr Phys Act. 2014;11(1):1-11. doi:10.1186/s12966-014-0137-5
15. Gray WN, Janicke DM, Wistedt KM, Dumont-Driscoll MC. Factors associated with parental use of restrictive feeding practices to control their children’s food intake. Appetite. 2010;55(2):332-337. doi:10.1016/j.appet.2010.07.005
16. Duke RE, Bryson S, Hammer LD, Agras WS. The relationship between parental factors at infancy and parent-reported control over children’s eating at age 7. Appetite.
2004;43(3):247-252. doi:10.1016/j.appet.2004.05.006
17. Runfola CD, Von Holle A, Trace SE, et al. Body dissatisfaction in women across the lifespan: Results of the UNC-SELF and gender and body image (GABI) studies. Eur Eat Disord Rev. 2013;21(1):52-59. doi:10.1002/erv.2201
18. Boyington J, Johnson A, Carter-Edwards L. Dissatisfaction with ody size among low-income, postpartum black women. JOGNN - J Obstet Gynecol Neonatal Nurs. 2007;36(2):144-151. doi:10.1111/j.1552-6909.2007.00127.x
19. Gjerdingen D, Fontaine P, Crow S, McGovern P, Center B, Miner M. Predictors of mothers’ postpartum body dissatisfaction. Women Heal. 2009;49(6-7):491-504. doi:10.1080/03630240903423998
20. Ogden CL, Carroll MD, Lawman HG, et al. Trends in obesity prevalence among children and adolescents in the United States, 1988-1994 through 2013-2014. JAMA - J Am Med Assoc. 2016;315(21):2292-2299. doi:10.1001/jama.2016.6361
21. Flegal KM, Kruszon-Moran D, Carroll MD, Fryar CD, Ogden CL. Trends in obesity among adults in the United States, 2005 to 2014. JAMA - J Am Med Assoc.
2016;315(21):2284-2291. doi:10.1001/jama.2016.6458
22. Birch LL, Fisher JA. Appetite and eating behavior in children. Pediatr Clin North Am. 1995;42(4):931-953. doi:10.1016/S0031-3955(16)40023-4
24. Tovar A, Hennessy E, Pirie A, et al. Feeding styles and child weight. Int J Behav Nutr Phys Act. 2012:1-8.
25. Hennessy E, Hughes SO, Goldberg JP, Hyatt RR, Economos CD. Parent behavior and child weight status among a diverse group of underserved rural families. Appetite. 2010;54(2):369-377. doi:10.1016/j.appet.2010.01.004
26. Hughes SO, Shewchuck RM, Baskin ML, Nicklas TA, Qu H. Indulgent feeding styleand children’s weight status in preschool. J Dev Behav Pediatr. 2008;29(5):403-410.
doi:10.1097/DBP.0b013e318182a976
27. Farrow C, Blissett J. Does Maternal Control During Feeding Moderate Early Infant Weight Gain? Pediatrics. 2006;118(2):e293-e298. doi:10.1542/peds.2005-2919 28. Wardle J, Saskia S, Carol A, Lorna R, Robert P. Parental Feeding Style And The
Intergeneration Transmission of Obesity Risk. 2002.
29. Wehrly SE, Bonilla C, Perez M, Liew J. Controlling parental feeding practices and child body composition in ethnically and economically diverse preschool children q. Appetite. 2014;73:163-171. doi:10.1016/j.appet.2013.11.009
30. Powers SW, Chamberlin LA, Schaick KB Van, et al. Social and Behavioral Maternal Feeding Strategies , Child Eating Behaviors , and Child BMI in Low-Income African-American Preschoolers. 2006;14(11).
31. Carnell S, Wardle J, Associations JW. Associations between Multiple Measures of Parental Feeding and Children ’ s Adiposity in United Kingdom Preschoolers. 2007. 32. Reidy KC, Deming DM, Briefel RR, Fox MK, Saavedra JM, Eldridge AL. Early
development of dietary patterns: transitions in the contribution of food groups to total energy—Feeding Infants and Toddlers Study, 2008. BMC Nutr. 2017;3(1):5.
doi:10.1186/s40795-016-0124-0
33. Saavedra JM, Deming D, Dattilo A, Reidy K. Lessons from the feeding infants and toddlers study in North America: What children eat, and implications for obesity prevention. Ann Nutr Metab. 2013;62(SUPPL. 3):27-36. doi:10.1159/000351538 34. Abraham EC, Godwin J, Sherriff A, Armstrong J. Infant feeding in relation to eating
patterns in the second year of life and weight status in the fourth year. Public Health Nutr. 2012;15(9):1705-1714. doi:10.1017/S1368980012002686
35. R.F. R, S.J. P, R. M, K.J. C, E.H. W, H. S. Maternal feeding practices predict weight gain and obesogenic eating behaviors in young children: A prospective study. Int J Behav Nutr Phys Act. 2013;10:no pagination. doi:10.1186/1479-5868-10-24