A meta-analysis of multiple myeloma risk regions in African and
European ancestry populations identifies putatively functional
loci
A full list of authors and affiliations appears at the end of the article.
Abstract
Background—Genome-wide association studies (GWAS) in European populations have identified genetic risk variants associated with multiple myeloma (MM).
Methods—We performed association testing of common variation in eight regions in 1,264 MM patients and 1,479 controls of European ancestry (EA) and 1,305 MM patients and 7,078 controls of African ancestry (AA) and conducted a meta-analysis to localize the signals, with epigenetic annotation used to predict functionality.
Results—We found that variants in 7p15.3, 17p11.2, 22q13.1 were statistically significantly (p<0.05) associated with MM risk in AAs and EAs and the variant in 3p22.1 was associated in EAs only. In a combined AA-EA meta-analysis, variation in five regions (2p23.3, 3p22.1, 7p15.3, 17p11.2, 22q13.1) was statistically signficantly associated with MM risk. In 3p22.1, the correlated variants clustered within the gene body of ULK4. Correlated variants in 7p15.3 clustered around
an enhancer at the 3′ end of the CDCA7L transcription termination site. A missense variant at
17p11.2 (rs34562254, Pro251Leu, OR=1.32, p=2.93×10⁻⁷) in TNFRSF13B, encodes a
lymphocyte-specific protein in the tumor necrosis factor receptor family that interacts with the
NF-κB pathway. SNPs correlated with the index signal in 22q13.1 cluster around the promoter and
enhancer regions of CBX7.
Conclusions—We found that reported MM susceptibility regions contain risk variants important across populations supporting the use of multiple racial/ethnic groups with different underlying genetic architecture to enhance the localization and identification of putatively functional alleles.
Impact—A subset of reported risk loci for multiple myeloma have consistent affects across populations and are likely to be functional.
**Correspondence to: Wendy Cozen, USC Norris Comprehensive Cancer Center, Topping Tower, 1441 Eastlake Ave, Room 4451A,
Los Angeles, CA 90033, Telephone: (323) 865-0447, Fax: (323) 865-0141, [email protected]; or; Christopher A. Haiman, USC Norris Comprehensive Cancer Center, Harlyne Norris Research Tower, 1450 Biggy Street, Room 1504, Los Angeles, CA 90033, Telephone: (323) 442-7755, Fax: (323) 442-7749, [email protected]; or; Dennis Hazelett, Samuel Oschin Comprehensive Cancer Institute, Cedars-Sinai Medical Center 8700 Beverly Blvd. Los Angeles, CA 90048, Telephone: (310) 424-315-4412, Fax: (310) 273-9533,
[email protected]. *Co-equal Authors +Co-senior Authors §In Memoriam
Conflict of Interest: For J. Zonder: Advisory Boards for Celgene and BMS. Research support from Celgene. Consulting for Prothena.
HHS Public Access
Author manuscript
Cancer Epidemiol Biomarkers Prev
. Author manuscript; available in PMC 2017 December 01.Published in final edited form as:
Cancer Epidemiol Biomarkers Prev. 2016 December ; 25(12): 1609–1618. doi: 10.1158/1055-9965.EPI-15-1193.
A
uthor Man
uscr
ipt
A
uthor Man
uscr
ipt
A
uthor Man
uscr
ipt
A
uthor Man
uscr
Keywords
Multiple myeloma; GWAS; African-American; meta-analysis; genetic Epidemiology
INTRODUCTION
Multiple myeloma (MM), a neoplasm of malignant plasma cells arising in bone marrow, comprises 1.9% of all cancer deaths and 20% of all hematological cancer deaths (www.seer.ca.gov)(1). MM is uncommon, with an age-adjusted incidence rate of
7.9/100,000 in males and 5.1/100,000 in females in the U.S. in 2012 (www.seer.cancer.gov)
(1). Clinical manifestations range from asymptomatic (smoldering) myeloma to active symptomatic disease (2). There is a 2- to 3- fold higher risk of disease in African Americans compared to individuals of European origin and a 2-fold increased risk in relatives of MM cases (3, 4), suggesting a heritable component to this disease.
A genome-wide association study (GWAS) of 1,675 cases and 5,903 controls from a Northern European population identified two genome-wide significant novel loci associated with MM risk at 3p22.1 (rs1052501) and 7p15.3 (rs4487645), as well as a suggestive
association (p~10−7) at 2p23.3 (rs6746082) (5). In a second GWAS of 4,692 cases and
10,990 controls from the United Kingdom and Germany, four additional genome-wide significant risk loci were identified at 3q26.2 (rs10936599), 6p21.33 (rs2285803), 17p11.2 (rs4273077), and 22q13.1 (rs877529)(6). For these common risk variants, the per allele odds ratios (OR) and risk allele frequencies (RAF) ranged from 1.19 to 1.39, and 0.11 to 0.76, respectively. In a European study involving a large multiple myeloma consortium, three of these regions (2p23.3, 3p22.1 and 7p15.3) replicated at p<0.05 (7). In the most recent published GWAS, the 2q12.3 region was implicated in MM risk in a discovery set of 972 cases and 1,064 controls of European origin and was replicated in a similar set of 297 cases (8). This study also replicated six of the seven known regions for MM risk (8).
For common susceptibility alleles shared across populations, underlying genetic differences in linkage disequilibrium (LD) across racial/ethnic groups can be leveraged to more precisely localize markers of disease risk (9). In the present study, we examined MM susceptibility regions for individuals from North America of African (AA) and European (EA) ancestry and conducted GWAS plus imputation-based fine-mapping in an attempt to identify putative functional variants that better capture risk in these populations.
MATERIALS AND METHODS
Ethics Statement
All studies had approval from their respective Institutional Review Boards according to the Declaration of Helsinki Ethical Principles for Medical Research Involving Human Subjects in 1964. Signed informed consent was obtained from all participants at the time of blood/ saliva collection. The participants in this study were recruited at multiple sites described below.
A
uthor Man
uscr
ipt
A
uthor Man
uscr
ipt
A
uthor Man
uscr
ipt
A
uthor Man
uscr
African Ancestry Study Participants
Study participants included 1,150 AA patients with MM enrolled in the phase 1 collection (through 11/11/2014) of the African American Mulitple Myeloma Study (AAMMS), from 11 clinical centers (Winship Cancer Institute and Grady Memorial Hospital at Emory University, MD Anderson Cancer Center at University of Texas, Robert H. Lurie
Comprehensive Cancer Center at Northwestern University, Sidney Kimmel Comprehensive Cancer Center at Johns Hopkins University, Karmanos Cancer Institute at Wayne State University, University of Chicago Comprehensive Cancer Center, Siteman Cancer Center at Washington University, St. John Providence Health System, Norris Comprehensive Cancer Center at the University of Southern California (USC) and the Henry Ford Health System) and four National Cancer Institute (NCI) Surveillance, Epidemiology, and End Results (SEER) cancer registries (California, Detroit [excluding patients from Karmanos Cancer Center and Henry Ford Hospital], New Jersey, and Louisiana). USC is the data coordinating center that receives, processes and maintains all de-identified clinical and questionnaire data and biospecimens. English speaking AA patients diagnosed with active or smoldering MM at age 20 years or older were eligible for enrollment. Forty-three AA MM patients were included from the Multiethnic Cohort (MEC), a cohort of 215,251 men and women aged 45–75 years at recruitment from Hawaii and California (10). Incident cancer cases were identified through linkage with the Hawaii Tumor Registry and/or the Los Angeles County Cancer Surveillance Program; both NCI-funded SEER registries. An additional 28 AA MM patients from the University of California at San Francisco (UCSF) study were also included. That study enrolled 370 MM patients of all races treated for MM at UCSF between 1989 and 2010 (11). Additional details of the study, which also contributed patients to the EA GWAS meta-analysis, can be found in Supplementary Methods. Finally, 84 AA MM patients’ samples, collected from the Multiple Myeloma Research Consortium
(MMRC) institutions and shipped to the MMRC Tissue Bank at the Mayo Clinic Scottsdale, were provided (2).
A comparison set of 7,078 multiple myeloma-free participants (4,447 males and 2,631 females) from the African Ancestry Prostate Cancer GWAS Consortium (AAPC, consisting of 13 independent studies) and from a breast cancer GWAS of AA women (AABC,
consisting of nine independent studies) were used as controls (12, 13). Further details on the contributing studies are provided in the Supplementary Methods.
Genotyping and Imputation—DNA was extracted at the USC Genomics Core
Laboratory from buffy coat or saliva samples from the 1,150 AAMMS and 43 MEC patients. For the 28 UCSF patients, DNA was extracted from white blood cells harvested after mobilization of stem cells with granulocyte colony-stimulating factor in preparation for autologous bone marrow transplant and shipped to USC for genotyping. For the 84 MMRF patients, DNA was extracted from ACK-lysed peripheral blood samples using a Puregene kit (Qiagen). All 1,305 samples were then genotyped using the Illumina HumanCore GWAS array at the USC Genomics Core Laboratory.
Controls were previously genotyped using the Illumina 1M-Duo (Illumina Inc., San Diego, California, USA). Quality control (QC) steps for the controls are described in detail
A
uthor Man
uscr
ipt
A
uthor Man
uscr
ipt
A
uthor Man
uscr
ipt
A
uthor Man
uscr
elsewhere (12, 13). Among cases, 37,046 single nucleotide polymorphisms (SNP) and 11 samples with a call rate < 98% were removed. Cases were further excluded based on the following criteria: (i) unexpected replicates (n=14); (ii) first or second degree relatives (n=2); (iii) self-reported sex conflicting with sex estimated by X chromosome
heterozygosity or XXY sex chromosome aneuploidy (n=6). A subset of controls (n=100) were genotyped on both arrays for QC purposes; any SNP that was discordant between the two platforms was removed (n=3,134). To minimize error due to platform differences, only SNPs genotyped in both cases and controls were included for imputation (n=188,835). Prior to merging the case and control genotype data, variant alleles were translated to the 1000 Genomes Project (1KGP) forward strand and base pair positions were mapped to GRCh37/ hg19. Imputation to 1KGP (March 2012 release) was conducted for 500 Kb regions around the eight previously identified risk variants and SNPs with INFO>0.80 and minor allele frequency (MAF)>0.01 were included in the analysis. The number of genotyped and imputed SNPs by info score (<0.8 and >0.8) for each region is provided in Supplementary Table 1.
Statistical Analysis—Principal components (PC) were calculated with EIGENSTRAT
v5.0 (14) using 19,070 common SNPs (MAF>0.05) with low pairwise LD (r2<0.20) selected
from the 188,835 overlapping genotyped SNPs in cases and controls. Unconditional logistic regression was performed adjusting for age (at diagnosis for cases and at blood draw for controls), sex, and PC1-5, as these PCs captured the variability of the study sample (results were similar when adjusted for 10 PCs). The dosage effects of the risk allele assuming an additive genetic model were analyzed in a one degree-of-freedom likelihood ratio test implemented in SNPTEST v2.4.0 (15).
European Ancestry Study Participants
Study participants included 1,264 EA MM cases and 1,479 EA controls from four genotyping centers: USC, UCSF (11), Mayo Clinic (Mayo), and University of Utah (UU) (Supplementary Methods). The USC GWAS consisted of four case-control studies (Los Angeles SEER (16), Seattle/Detroit SEER (17), University of British Columbia, University of Alabama at Birmingham) and two cohort studies (the Multiethnic Cohort Study (MEC) (10) and the Melbourne Collaborative Cohort Study (18)). The Mayo Clinic study included cases and controls from Mayo Clinic and Washington University (19).
Genotyping and Imputation—Cases and controls were genotyped at each center and imputation was performed using IMPUTE2 (20) or Beagle (21) with 1KGP as the reference panel. A description of each of the EA studies, genotyping platforms and methods, as well as imputation and quality control procedures are provided in the Supplementary Methods.
Statistical Analysis—Each study analyzed their data separately using unconditional logistic regression, adjusting for age, sex, and PCs (Supplementary Methods) (14). Data for 500 Kb around each of the eight loci were extracted from each center. Summary statistics were meta-analyzed using a fixed effects model weighted by the inverse standard error in METAL (22).
A
uthor Man
uscr
ipt
A
uthor Man
uscr
ipt
A
uthor Man
uscr
ipt
A
uthor Man
uscr
Assigning Significance Levels
The goal of our statistical analysis was two-fold: 1) to enhance the localization of the regions found to be genome-wide significant in the previous studies in Europeans using combined AA-EA meta-analyses; and 2) to search for new associations in regions within −/ + 250 kb of these index SNPs. Accordingly, within each of the eight regions of interest,
SNPs (both typed and imputed) were classified into two groups: Group A SNPs (r2≥0.50
with index estimated in 1KGP EUR populations) and Group B (r2<0.50). For Group A
SNPs, we used region-wide significance as our type I error rate (alpha-level), but for Group B SNPs, we required a more stringent experiment-wide significance across all regions. We were less stringent in our choice of criteria for statistical significance for the Group A SNPs because of the prior knowledge of association of risk with the more strongly correlated Group A SNPs.
Alpha-levels for each region were separately derived for the two groups of SNPs using permutation testing. To achieve numerically stable results, 1,000 replicates randomly shuffling the case/control status of all samples while preserving the orginal case/control ratio were generated for Groups A and B SNPs within each region. For each replicate, we
recorded the minimum p-value of all tested SNPs and regarded the 5th percentile of the
1,000 minimum p-values as the permuation-based significance level for the Group A SNPs in that particular region. The minimum alpha-level for all Group A SNPs across the eight
regions was 1.48×10⁻³. By contrast, the significance levels for Group B SNPs were found at
the 0.625th percentile (0.05/8 × 100%= 0.625), a Bonferroni correction accounting for a total
of eight regions. The significance levels for both groups across the eight regions are presented in Supplementary Table 2.
Combined Analysis in AA and EA Individuals
Summary statistics from the AA analysis and EA meta-analysis were meta-analyzed using a fixed effects model weighted by the inverse standard error using METAL (22). Region-specific alpha-levels defined in the AA analysis were applied to the AA/EA combined
meta-analysis, as they are the most conservative. All r2 values presented in the results are
calculated using European (EUR) and African (AFR) populations from 1KGP.
Genomic Annotation
In order to choose an efficient group of SNPs to move forward for functional annotation, we used the regions that replicated in AA population with the Group A criteria. We included
SNPs that were correlated (r2≥0.50) with the most significant SNP in a 500 Kb region and
within two orders of magnitude of the smallest p-value observed. To integrate chromatin biofeature annotations with our genotyping data in these regions, we used the R package
FunciSNP (Bioconductor.org) (23). We selected publicly available datasets relevant to the
development of the B-cell lineage, most closely representing MM pathogenesis. The
following ENCODE datasets were employed to filter correlated SNPs that lie within putative enhancer regions with Gene Expression Omnibus (GEO) accession IDs: B-cells CD20+ RO01778 DGF Peaks (GSM1014525), B-cells CD20+ RO01778 DNase I HS Peaks (GSM1024765, GSM1024766), B-cells CD20+ RO01794 HS Peaks (GSM1008588), CD20+ (RO 01778) H3K4me3 Histone Mod ChIP-seq Peaks (GSM945229), CD20+
A
uthor Man
uscr
ipt
A
uthor Man
uscr
ipt
A
uthor Man
uscr
ipt
A
uthor Man
uscr
RO01794 H3K27ac Histone Mods by ChIP-seq Peaks (GSM1003459), CD20+ (RO 01794) H3K4me3 Histone Mod ChIP-seq Peaks (GSM945198), CD20+ CTCF Histone Mods by ChIP-seq Peaks (GSM1003474), CD20+ H2A.Z Histone Mods by ChIP-seq Peaks
(GSM1003476), CD20+ H3K4me2 Histone Mods by ChIP-seq Peaks (GSM1003471). The combinations of these histone modifications were used to segment the genome in these ENCODE cell lines into active and poised promoter regions with or without DNase I hypersensitivity, active and poised enhancer regions with or without DNase I
hypersensitivity, putative regulatory sites with open chromatin, and CTCF bound sites outside promoters and enhancers. SNPs that could be mapped to core regions (DNase hypersensitive sites) of putative non-coding regulatory regions (enhancers and promoters) were further subjected to analysis of transcription factor binding site disruptiveness using the R/Bioconductor package motifbreakR (24). To define other physical map features
(transcription start sites, 5′ UTR, 3′UTR) we downloaded annotations from the February
2009 release of the human genome (GRCh37/hg19) available from the UCSC genome browser (25). Finally, we used the highly conserved set of predicted targets of microRNA
targeting at mircode.org (miRcode 11, June 2012 release) (26), and conserved high-quality
microRNA target species from microRNA.org (June 2010 release) (27).
RESULTS
Race-specific Replication of Known Risk Regions
Among AAs, we replicated three of the previously published risk variants at p<0.05 (7p15.3,
p=8.30×10⁻⁵; 17p11.2, p=1.60×10⁻²; 22q13.1, p=1.47×10⁻², Table 1); four regions in total
including 3p22.1. All previously reported risk variants were common among AAs (Table 1; Supplementary Figure 1). We had ≥90% power to detect the published effect size observed in AAs for six SNPs (rs4487645, rs4273077, and rs877529 were significant), and 73–80% power for the other two SNPs (Table 1). There were no statistically significant associations using Group B alpha-levels, although a marginally significant association was observed in
the 6p21.33 region (rs190055148, p=1.37×10⁻⁶, r2=0.002 (1KGP EUR) and r2=0.06 (1KGP
AFR) with the index marker rs2285803) (Supplementary Figure 2).
In EAs, we replicated four variants at p<0.05 (3p22.1, p=4.42×10⁻³; 7p15.3, p=7.47×10⁻⁴;
17p11.2, p=2.46×10⁻⁴; 22q13.1, p=4.31×10⁻⁴; Table 1). We had ≥90% power to detect the
reported effect size for six SNPs (three of the six were significant at p<0.05) and 83–84% power for the other two SNPs (rs4273077 was significant) Table 1. No statistically
significant Group B SNPs were observed. The previously reported locus 2q12.3 (8) was not associated with MM risk in either AA or EA subjects.
Race-specific results for all regions are provided in Supplementary Tables 3, 4 and Supplementary Figure 2.
Combined Analysis in AA and EA Individuals
In an attempt to better localize the region harboring a functional variant, summary statistics from the AA and EA studies were meta-analyzed for seven of the eight published risk regions. The HLA region on chromosome 6p21.33 was excluded from the meta-analysis
A
uthor Man
uscr
ipt
A
uthor Man
uscr
ipt
A
uthor Man
uscr
ipt
A
uthor Man
uscr
because of extreme sensitivity to population stratification due to race-specific extended haplotypes and underlying LD patterns requiring greater SNP density than available here for interpretable results (28).
We found statistically significant associations for Group A SNPs that were in LD with the
index SNP (r2≥0.50) in all regions except 2q12.3 and 3q26.2 (Table 1; Supplementary
Figure 3); however there were no significant associations for Group B SNPs in any region. Five of the eight index SNPs and three of the most significant SNPs from the combined analysis were more common among individuals of African compared to those of European ancestry, with rs1052501 showing the largest difference (RAF in AAs 0.63, in EAs 0.22) (Table 1; Supplementary Figure 1). Below we describe the most significant associations and functional annotation in the four regions that replicated in the AA population with the Group A criteria.
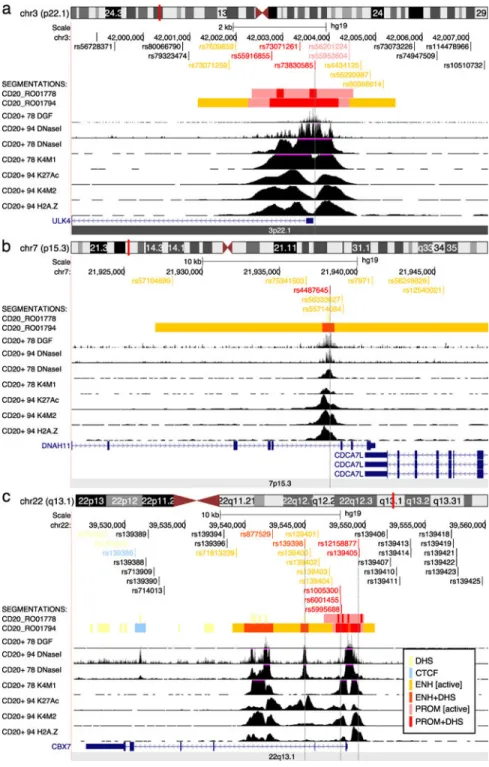
3p22.1
Variant rs143531651 was the most significantly associated SNP (OR=1.26, p=2.02×10⁻⁵)
and was correlated with the index SNP only in EA populations (AA RAF=0.11, r2=0.02, EA
RAF=0.17, r2=0.79; Table 1). In this region, all the significant correlated variants cluster
within the gene body of ULK4, which encodes the serine-threonine protein kinase. Among
these are two missense variants of unknown significance, rs17215589 (OR=1.20, 1.04×10⁻³)
and rs35263917 (OR=0.84, p=1.39×10⁻³). In addition, there are three SNPs, rs73830585
(OR=1.19, p=1.60×10⁻³), rs73071261 (OR=1.19, p=1.61×10⁻³) and rs55916855 (OR=0.83,
p=7.35×10⁻⁴) located within DNase I hypersensitive sites in the active promoter of ULK4.
Variants rs73830585 and rs55916855 disrupt EGR1 and INSM1 transcription factor binding sites, respectively (Figure 1, Supplementary Tables 5, 6).
7p15.3
Variant rs12540021 (OR=1.31, p=1.27×10⁻⁷), located in intron 79 of DNAH11 and
downstream of CDCA7L was the most significantly associated SNP in this region and was
correlated with the index SNP in AAs and EAs (r2=0.71 and r2=0.67, respectively). The
eight top correlated SNPs in this region are clustered around a solitary enhancer toward the
3′ end of the DNAH11 gene region, and 3′ of the CDCA7L transcription termination site.
DNAH11 encodes for a ciliary outer dynein arm protein and CDCA7L encodes a cell-cycle gene that is expressed in malignant plasma cells (29). The index SNP in this region,
rs4487645 (OR=1.28, p=4.00×10⁻⁷), is situated in the DNase I hypersensitive site in the
center of the active enhancer, where transcription factors are most likely to be bound. The risk allele of rs4487645 (C), disrupts GATA1, GATA2 and GATA5 motifs. Thus, the correlated variants in 7p15.3 overlap putative regulatory features consistent with an active enhancer region (Figure 1; Supplementary Tables 5, 6).
17p11.2
rs34562254 (OR=1.32, p=2.93×10⁻⁷) was the most significantly associated SNP in this
region in the combined analysis and in the race-specific analyses (Table 1; Supplementary
Tables 3, 4). This variant occurs roughly equally in both populations (MAFAA= 0.13;
MAFEA = 0.11) but is more highly correlated with the reported index SNP in EA (r2=0.90)
A
uthor Man
uscr
ipt
A
uthor Man
uscr
ipt
A
uthor Man
uscr
ipt
A
uthor Man
uscr
compared to AA (r2=0.33, Table 1) individuals. This missense variant (Pro251Leu) is located in exon 5 of TNFRSF13B, a lymphocyte-specific tumor necrosis factor receptor that
interacts with the NF-κB pathway and regulates B-cell development (30, 31). This variant is
predicted to be possibly damaging in PolyPhen2 (32) with a score of 0.72 (sensitivity=0.86, specificity=0.92), while it is labeled as a tolerated mutation in SIFT (33). Variant
rs34562254 is conserved across some species (the rhesus, dog, and elephant), but is not present in others (mouse or zebrafish).
22q13.1
Variant rs139425 (OR=1.21, p=8.41×10⁻⁷) was the most significantly associated SNP in this
region and is strongly correlated with the reported index SNP in EAs but not AAs (r2=0.95
and r2=0.18, respectively). This SNP did not overlap any biofeatures of interest. The top 35
SNPs in this region cluster within 10kb in and around the promoter and proximal intronic enhancers of of the polycomb group gene CBX7, which are epigenetically marked active regions. CBX7 is a tumor supressor gene which is down-regulated in multiple cancers (34, 35). Seven correlated SNPs overlap with DNase I hypersensitive sites within the
aformentioned promoter and enhancer regions (Supplementary Table 6): rs877529 and rs139398 are located within the downstream enhancers; rs877529 disrupts several high-confidence binding sites including ETS1, ETV4 and PAX6; rs1005300, rs6001455, rs5995688, rs12158877 and rs139405 are situated in the promoter region; and the reference allele of rs1005300 disrupts KLF1/KLF4 binding sites (Figure 1).
DISCUSSION
This is the first study to examine the eight published GWAS risk regions for MM in AA individuals. We statistically significantly replicated four of the EA reported regions in the AA-only analysis, suggesting that these risk regions are shared across populations. In an AA-EA meta-analysis, we identified SNPs in seven of the eight reported regions that were more significant than the index SNP; five were statistically significant using Group A criteria. The differential LD between AA and EA populations in these combined analyses allows for a finer resolution of the signal and suggests that these alternate SNPs may be better proxies of the functional alleles. The genomic annotation of these variants highlights potential functional impact within enhancer regions, promoter regions, and protein coding sequence for some of the variants.
We were able to utilize information from the differential LD in the two populations as well as the genomic annotation to identify the regions we believe to be the most promising for functional follow-up. Three regions have SNPs that are significantly associated with disease risk and functional annotation that is highly suggestive of regulatory function (3p22.1, 7p15.3, 22q13.1). Both the race-specific and combined analyses identified the missense variant rs34562254 (Pro251Leu) as the most significant SNP in the fourth region (17p11.2). This SNP is located in TNFRSF13B and falls centromeric to a common 17p deletion observed in MM cases (36). TNFRSF13B encodes a protein that is a lymphocyte-specific member of the tumor necrosis factor (TNF) receptor superfamily that interacts with the
NF-κB pathway, critical for B-cell activation and survival and proliferation of MM neoplastic
A
uthor Man
uscr
ipt
A
uthor Man
uscr
ipt
A
uthor Man
uscr
ipt
A
uthor Man
uscr
cells (37, 38), and the target of proteosome inhibitors used in standard MM therapy regimens (38).
In 7p15.3, we identified eight variants that were moved forward for functional annotation. A single SNP, rs4487645, was mapped to DNase I hypersensitive region in the core of a putative enhancer with active histone modifications. This SNP is predicted to disrupt three of a highly related family of transcription factor binding motifs with strong effects, including
GATA1, GATA2, and GATA5 transcription factors (match threshold p<10−4) involved in
T-cell and hematopoietic stem T-cell differentiation (Supplementary Table 5; Supplementary Methods). Weinhold et. al. recently generated expression quantitative trait loci (eQTL) data on malignant plasma cells in 848 MM patients and found that the strongest association was for rs4487645, which showed cis-regulation of CDCA7L (29). This same variant and its enhancer were annotated in our data as a potentially functional candidate in B-cells. Thus, our approach utilizing differential LD patterns to identify SNPs for functional annotation may identify truly functional disease correlates even when expression data are unavailable or lack sufficient statistical power.
This study includes the largest existing collection of AA MM cases and controls and is the first to examine previously reported risk regions in this diproportinately impacted group. One limitation is that AA cases and controls were genotyped on different arrays with only a small number of overlapping SNPs (n=188,835 SNPs genome-wide) which limited our ability to identify novel variants (Group B SNPs) and to examine the overlap in the HLA region. However, we performed rigorous QC on genotyped SNPs, which allowed us to impute cases and controls together, thereby providing more accurate imputed data.
Nevertheless, there were not a large number of genotyped SNPs in each region which made imputation challenging. For example, in the 17p11.2 and 22q13.1 regions, over half of the imputed SNPs for the AA’s with a MAF>1% were excluded due to poor quality scores (INFO <0.8 in IMPUTE2, Supplementary Figure 2 Supplementary Table 1).
Another limitation of this study was the relatively small sample size of the race-specific analyses; however, power was greatly enhanced by combining the data across ancestry groups which leveraged the differential LD in these two populations in an attempt to more accurately approximate the true signal. For example, in the EA analysis, we had 28% power to detect an OR of 1.25 for an allele frequency of 10% while in the combined analysis, which more than doubled the number of cases and added more than 7000 additional controls, we had 89% power to detect this same effect size using the minimum alpha-level
for Group A SNPs (1.48×10⁻³, Supplementary Table 2). Because MM is a rare disease
(~6/100,000 average annual age-adjusted incidence rate) with a relatively poor 5-year survival rate (~46%), it is challenging to accrue large numbers of patients necessary for detecting associations with small to moderate magnitude of risk. Therefore, unlike similar studies of common solid tumor malignancies, it is often difficult to achieve adequate statistical power. However, we were able to improve power by including a a large number of controls from pre-existing GWAS in AA men and women.
Although we did not conduct a combined analysis of the HLA region due to its extreme sensitivity to population stratification and long-range LD, we did observe signals in this
A
uthor Man
uscr
ipt
A
uthor Man
uscr
ipt
A
uthor Man
uscr
ipt
A
uthor Man
uscr
region for both AAs and EAs that differed by race, as expected. A possible independent
signal (rs190055148, p=1.37×10⁻⁶, r2=0.06 with index in 1KGP AFR and r2=0.002 in EUR)
was observed in AAs that will require confirmation in a larger sample.
In this study, we replicated associations in four of eight published risk regions in AAs and five in the AA-EA combined analysis, which suggests common shared functional variants across racial groups. We identified four regions that are promising for functional follow-up, including 17p11.2, where the most significant SNP in the combined analysis is a missense variant. Traditional large-scale discovery efforts in AA populations will be required to better understand the degree to which there is a genetic basis underlying the excess risk of MM in this group.
Supplementary Material
Refer to Web version on PubMed Central for supplementary material.
Authors
Kristin A. Rand1,*, Chi Song1,*, Eric Dean2, Daniel J. Serie3, Karen Curtin4, Xin Sheng1, Donglei Hu5, Carol Ann Huff6, Leon Bernal-Mizrachi7, Michael H. Tomasson8, Sikander Ailawadhi3, Seema Singhal9, Karen Pawlish10, Edward S. Peters11, Cathryn H. Bock12, Alex Stram13, David J Van Den Berg1, Christopher K. Edlund1, David V.Conti1, Todd Zimmerman14, Amie E. Hwang1, Scott Huntsman5, John Graff15, Ajay Nooka7, Yinfei Kong1, Silvana L. Pregja12, Sonja I. Berndt16, William J. Blot17,18, John Carpten19, Graham Casey1, Lisa Chu20,21, W. Ryan Diver22, Victoria L. Stevens22, Michael R. Lieber1, Phyllis J. Goodman23, Anselm J.M. Hennis24,25, Ann W. Hsing21, Jayesh Mehta9, Rick A. Kittles26, Suzanne Kolb27, Eric A. Klein28, Cristina Leske24, Adam B. Murphy9, Barbara Nemesure24, Christine Neslund-Dudas29, Sara S. Strom30, Ravi Vij8, Benjamin A. Rybicki29, Janet L. Stanford27, Lisa B. Signorello31, John S. Witte32, Christine B.
Ambrosone33, Parveen Bhatti27, Esther M. John20,21, Leslie Bernstein34, Wei Zheng17, Andrew F. Olshan35, Jennifer J. Hu36, Regina G. Ziegler16, Sarah J. Nyante35, Elisa V. Bandera15, Brenda M. Birmann31, Sue A. Ingles1, Michael F. Press1, Djordje Atanackovic4, Martha J. Glenn4, Lisa A. Cannon-Albright4, Brandt Jones4, Guido Tricot37, Thomas G. Martin5, Shaji K. Kumar38, Jeffrey L. Wolf5, Sandra L. Deming17, Nathaniel Rothman16, Angela R. Brooks-Wilson39, S. Vincent Rajkumar38, Laurence N. Kolonel40, Stephen J. Chanock16, Susan L. Slager38, Richard K. Severson12, Nalini Janakiraman29, Howard R. Terebelo41, Elizabeth E. Brown42, Anneclaire J. De Roos43, Ann F. Mohrbacher1, Graham A. Colditz8, Graham G. Giles44,45,46, John J. Spinelli39,47, Brian C. Chiu14, Nikhil C. Munshi48, Kenneth C. Anderson48, Joan Levy49, Jeffrey A. Zonder12, Robert Z. Orlowski30, Sagar Lonial7, Nicola J. Camp4,+, Celine M. Vachon38,+, Elad Ziv5,+, Daniel O. Stram1,+, Dennis J. Hazelett50,+,**, Christopher A. Haiman1,+,**, and Wendy Cozen1,+,**
A
uthor Man
uscr
ipt
A
uthor Man
uscr
ipt
A
uthor Man
uscr
ipt
A
uthor Man
uscr
Affiliations
1Keck School of Medicine of USC and Norris Comprehensive Cancer Center,
University of Southern California, Los Angeles, CA, USA
2Sutter Health, Oakland, California, USA
3Mayo Clinic, Jacksonville, FL, USA
4University of Utah School of Medicine, Salt Lake City, UT, USA
5University of California at San Francisco, San Francisco CA, USC
6Johns Hopkins School of Medicine, Johns Hopkins University, Baltimore, MD, USA
7Winship Cancer Institute, Emory University, Atlanta, GE, USA
8Alvin J. Siteman Cancer Center, Washington University School of Medicine,
Washington University, St. Louis, MO, USA
9Robert H. Lurie Cancer Center, Northwestern University, Chicago, IL, USA
10New Jersey State Cancer Registry, New Jersey Department of Health, Trenton,
NJ, USA
11Louisiana State University School of Public Health, Louisiana State University,
New Orleans, LA, USA
12Karmanos Cancer Institute and Department of Oncology, Wayne State University
School of Medicine, Detroit, MI, USA
13Genomic Health, Inc., Redwood City, CA, USA
14University of Chicago, Chicago, IL, USA
15Rutgers-Robert Wood Johnson Medical School, Rutgers State University of New
Jersey, New Brunswick, NJ, USA
16Division of Cancer Epidemiology and Genetics, National Cancer Institute, US
National Institutes of Health, Bethesda, Maryland, USA
17International Epidemiology Institute, Rockville, MD, USA
18Division of Epidemiology, Vanderbilt Epidemiology Center, Vanderbilt University
School of Medicine, Nashville, TN, USA
19The Translational Genomics Research Institute, Phoenix, AZ, USA
20Cancer Prevention Institute of California, Fremont, CA, USA
21Stanford University School of Medicine and Stanford Cancer Institute, Palo Alto,
CA, USA
22American Cancer Society, Atlanta, GA, USA
23SWOG Statistical Center, Seattle, Washington, USA
24Stony Brook University, Stony Brook, NY, USA
A
uthor Man
uscr
ipt
A
uthor Man
uscr
ipt
A
uthor Man
uscr
ipt
A
uthor Man
uscr
25Chronic Disease Research Centre and Faculty of Medical Sciences, University of
the West Indies, Bridgetown, Barbados
26Department of Surgery, University of Arizona, Tucson, AZ
27Division of Public Health Sciences, Fred Hutchinson Cancer Research Center,
Seattle, WA, USA
28Glickman Urologic and Kidney Institute, Cleveland Clinic, Cleveland, OH, USA
29Henry Ford Hospital, Detroit, MI, USA
30The University of Texas MD Anderson Cancer Center, University of Texas,
Houston, TX, USA
31Harvard School of Public Health, Harvard University, Boston, Massachusetts, USA
32Institute for Human Genetics, University of California, San Francisco, San
Francisco, California, USA
33Roswell Park Cancer Institute, Buffalo, New York, USA
34Division of Cancer Etiology, Department of Population Sciences, Beckman
Research Institute of the City of Hope, Duarte, CA, USA, Duarte, CA, USA
35Gillings School of Global Public Health, and Lineberger Comprehensive Cancer
Center, University of North Carolina, Chapel Hill, NC, USA
36Sylvester Comprehensive Cancer Center and Department of Epidemiology and
Public Health, University of Miami Miller School of Medicine, Miami, FL 33136, USA
37University of Iowa, Iowa City, Iowa, USA
38Mayo Clinic, 200 First St SW, Rochester, MN, USA
39BC Cancer Agency, Vancouver, Canada
40University of Hawaii Cancer Center, University of Hawaii, Honolulu, HI, USA
41Providence Hospital, Southfield, Michigan, USA
42University of Alabama at Birmingham, Birmingham, Alabama, USA
43School of Public Health, Drexel University, Philadelphia, PA, USA
44Cancer Epidemiology Centre, Cancer Council of Victoria, Melbourne, Australia
45School of Population and Global Health, Centre for Epidemiology and
Biostatistics, University of Melbourne, Melbourne, VIC, Australia
46Monash University, Melbourne, Australia
47School of Population and Public Health, University of British Columbia, Vancouver,
Canada
48Dana Farber Cancer Institute, Harvard School of Medicine, Harvard University,
Boston, MA, USA
49Multiple Myeloma Research Foundation, Norwalk, CT, USA
A
uthor Man
uscr
ipt
A
uthor Man
uscr
ipt
A
uthor Man
uscr
ipt
A
uthor Man
uscr
50Center for Bioinformatics and Computational Biology, Cedars Sinai Medical
Center, Los Angeles, CA, USC
Acknowledgments
KAR gratefully acknowledges Gretchen Ponty Smith and is supported in part by the Margaret Kersten Ponty postdoctoral fellowship endowment, Achievement Rewards for College Scientists (ARCS) Foundation, Los Angeles Founder Chapter. The authors would like to thank Drs. Pierre-Antoine Gourraud, University of Nantes, France, and Loren Gragert, Tulane University, New Orleans, LA., for providing expertise on the difficulties involved with conducting a multiethnic meta-analysis of the HLA region. We would also like to thank Dr. Leah Mechanic, Program Director for the Genomic Epidemiology Branch in the Epidemiology and Genomics Research Program at the National Cancer Institute, for her guidance and advice. Finally, we acknowledge Dr. Brian Henderson in memoriam, whose pioneering work on cancer risk in multiethnic popualtions laid the foundation for this study. He was the co-director of the Multiethnic Cohort, which provided cases and the majority of the controls.
Financial Support:
This study was supported by the National Cancer Institute at the National Institutes of Health (1R01CA134786 to WC and CAH, 2P50CA100707 to KCA, Myeloma SPORE 2P50CA100707 Project 6 to KCA, WC and DVC, R01CA152336 and R01CA134674 to NC, P50 CA142509 and R01CA184464 to RZO, R21CA155951,
R25CA76023, R01CA186646, U54CA118948 Project 3 and P30CA13148 (seed grant) to EEB, and R21CA191896 and K24CA169004 to EZ). The study also received support from the Leukemia Lymphoma Society (LLS 6067-090) to NC, the American Cancer Society (IRG60-001-47) to EEB, and the Steve and Nancy Grand Multiple Myeloma Translational Initiative to EZ. Data collection from the cancer registries was supported by the National Cancer Institute Surveillance Epidemiology and End Results Population-based Registry Program, National Institutes of Health, Department of Health and Human Services, under contracts N01-PC-35139 (to USC for Los Angeles County), HHSN 261201300021I, N01PC-2013-00021 (to the New Jersey State Cancer Registry), and HHSN261201000026C (to the Utah Cancer Registry). Additional support for collection of incident multiple myeloma patient data was obtained from the Utah State Department of Health and the University of Utah, the Utah Population Database (UPDB) and the Utah Cancer Registry (UCR), the National Program of Cancer Registries of the Centers for Disease Control and Prevention (5U58DP003931-02 to the New Jersey State Cancer Registry and 1U58DP000807-01 to the California Cancer Registry, the Huntsman Cancer Institute (HCI) and the HCI Cancer Center Support grant, P30 CA42014 and by the USC Norris Comprehensive Cancer Center Core grant
P30CA014089 from the National Cancer Institute. The collection of patients used in this publication was supported in part by the California Department of Health Services as part of the statewide cancer reporting program mandated by California Health and Safety Code Section 103885.
AAPC studies: The MEC is supported by NIH grants CA63464, CA54281, CA1326792, CA148085 and HG004726. Genotyping of the PLCO samples was funded by the Intramural Research Program of the Division of Cancer Epidemiology and Genetics, NCI, NIH. LAAPC was funded by grant 99-00524V-10258 from the Cancer Research Fund, under Interagency Agreement #97-12013 (University of California contract #98-00924V) with the Department of Health Services Cancer Research Program. Cancer incidence data for the MEC and LAAPC studies have been collected by the Los Angeles Cancer Surveillance Program of the University of Southern California with Federal funds from the NCI, NIH, Department of Health and Human Services, under Contract No. N01-PC-35139, and the California Department of Health Services as part of the statewide cancer reporting program mandated by California Health and Safety Code Section 103885, and grant number 1U58DP000807-3 from the Centers for Disease Control and Prevention. KCPCS was supported by NIH grants CA056678, CA082664 and CA092579, with additional support from the Fred Hutchinson Cancer Research Center and the Intramural Program of the National Human Genome Research Institute. MDA was supported by grants, CA68578, ES007784, DAMD
W81XWH-07-1-0645, and CA140388. CaP Genes was supported by CA88164 and CA127298. SELECT was funded in part by Public Health Service grants U10 CA37429 (C.D. Blanke) and UM1 CA182883 (I.M. Thompson/ C.M. Tangen) from the National Cancer Institute. GECAP was supported by NIH grant ES011126. SCCS sample preparation was conducted at the Epidemiology Biospecimen Core Lab that is supported in part by the Vanderbilt-Ingram Cancer Center (CA68485).
AABC studies: AABC was supported by a Department of Defense Breast Cancer Research Program Era of Hope Scholar Award to CAH [W81XWH-08-1-0383], the Norris Foundation, P01-CA151135 and U19-CA148065. Each of the participating studies was supported by the following grants: MEC (National Institutes of Health grants R01-CA63464, R37-CA54281 and UM1-CA164973); CARE (National Institute for Child Health and Development grant NO1-HD-3-3175, K05 CA136967); WCHS (U.S. Army Medical Research and Material Command (USAMRMC) grant DAMD-17-01-0-0334, the National Institutes of Health grant R01-CA100598, and the Breast Cancer Research Foundation; SFBCS (National Institutes of Health grant R01-CA77305 and United States Army Medical Research Program grant DAMD17-96-6071); NC-BCFR (National Institutes of Health grant U01-CA69417); CBCS (National Institutes of Health Specialized Program of Research Excellence in Breast Cancer,
A
uthor Man
uscr
ipt
A
uthor Man
uscr
ipt
A
uthor Man
uscr
ipt
A
uthor Man
uscr
grant number P50-CA58223, and Center for Environmental Health and Susceptibility National Institute of Environmental Health Sciences, National Institutes of Health, grant number P30-ES10126); PLCO (Intramural Research Program, National Cancer Institute, National Institutes of Health); NBHS (National Institutes of Health grant R01-CA100374); WFBC (National Institutes of Health grant R01-CA73629). The Breast Cancer Family Registry (BCFR) was supported by the National Cancer Institute, National Institutes of Health under RFA-CA-06-503 and through cooperative agreements with members of the Breast Cancer Family Registry and Principal Investigators. The content of this manuscript does not necessarily reflect the views or policies of the National Cancer Institute or any of the collaborating centers in the BCFR, nor does mention of trade names, commercial products, or organizations imply endorsement by the U.S. Government or the BCFR.
References
1. Howlader, NNA., Krapcho, M., Miller, D., Bishop, K., Altekruse, SF., Kosary, CL., Yu, M., Ruhl, J., Tatalovich, Z., Mariotto, A., Lewis, DR., Chen, HS., Feuer, EJ., Cronin, KA. SEER Cancer Statistics Review. National Cancer Institute; 2016. p. 1975-2013.
2. Lohr JG, Stojanov P, Carter SL, Cruz-Gordillo P, Lawrence MS, Auclair D, et al. Widespread genetic heterogeneity in multiple myeloma: implications for targeted therapy. Cancer cell. 2014; 25:91–101. [PubMed: 24434212]
3. Gebregziabher M, Bernstein L, Wang Y, Cozen W. Risk patterns of multiple myeloma in Los Angeles County, 1972–1999 (United States). Cancer Causes Control. 2006; 17:931–8. [PubMed: 16841260]
4. Landgren O, Weiss BM. Patterns of monoclonal gammopathy of undetermined significance and multiple myeloma in various ethnic/racial groups: support for genetic factors in pathogenesis. Leukemia. 2009; 23:1691–7. [PubMed: 19587704]
5. Broderick P, Chubb D, Johnson DC, Weinhold N, Forsti A, Lloyd A, et al. Common variation at 3p22.1 and 7p15.3 influences multiple myeloma risk. Nature genetics. 2011; 44:58–61. [PubMed: 22120009]
6. Chubb D, Weinhold N, Broderick P, Chen B, Johnson DC, Försti A, et al. Common variation at 3q26.2, 6p21.33, 17p11.2 and 22q13.1 influences multiple myeloma risk. Nature genetics. 2013; 45:1221–5. [PubMed: 23955597]
7. Martino A, Campa D, Jamroziak K, Reis RM, Sainz J, Buda G, et al. Impact of polymorphic variation at 7p15.3, 3p22.1 and 2p23.3 loci on risk of multiple myeloma. British journal of haematology. 2012; 158:805–9. [PubMed: 22823248]
8. Erickson SW, Raj VR, Stephens OW, Dhakal I, Chavan SS, Sanathkumar N, et al. Genome-wide scan identifies variant in 2q12.3 associated with risk for multiple myeloma. Blood. 2014; 124:2001– 3. [PubMed: 25237182]
9. Zaitlen N, Pasaniuc B, Gur T, Ziv E, Halperin E. Leveraging genetic variability across populations for the identification of causal variants. American journal of human genetics. 2010; 86:23–33. [PubMed: 20085711]
10. Kolonel LN, Henderson BE, Hankin JH, Nomura AM, Wilkens LR, Pike MC, et al. A multiethnic cohort in Hawaii and Los Angeles: baseline characteristics. American journal of epidemiology. 2000; 151:346–57. [PubMed: 10695593]
11. Ziv E, Dean E, Hu D, Martino A, Serie D, Curtin K, et al. Genome-wide association study identifies variants at 16p13 associated with survival in multiple myeloma patients. Nature communications. 2015; 6:7539.
12. Han Y, Signorello LB, Strom SS, Kittles RA, Rybicki BA, Stanford JL, et al. Generalizability of established prostate cancer risk variants in men of African ancestry. International journal of cancer Journal international du cancer. 2015; 136:1210–7. [PubMed: 25044450]
13. Feng Y, Stram DO, Rhie SK, Millikan RC, Ambrosone CB, John EM, et al. A comprehensive examination of breast cancer risk loci in African American women. Hum Mol Genet. 2014; 23:5518–26. [PubMed: 24852375]
14. Price AL, Patterson NJ, Plenge RM, Weinblatt ME, Shadick Na, Reich D. Principal components analysis corrects for stratification in genome-wide association studies. Nature genetics. 2006; 38:904–9. [PubMed: 16862161]
A
uthor Man
uscr
ipt
A
uthor Man
uscr
ipt
A
uthor Man
uscr
ipt
A
uthor Man
uscr
15. Marchini J, Howie B, Myers S, McVean G, Donnelly P. A new multipoint method for genome-wide association studies by imputation of genotypes. Nature genetics. 2007; 39:906–13. [PubMed: 17572673]
16. Cozen W, Gebregziabher M, Conti DV, Van Den Berg DJ, Coetzee GA, Wang SS, et al. Interleukin-6-related genotypes, body mass index, and risk of multiple myeloma and
plasmacytoma. Cancer epidemiology, biomarkers & prevention: a publication of the American Association for Cancer Research, cosponsored by the American Society of Preventive Oncology. 2006; 15:2285–91.
17. De Roos AJ, Gold LS, Wang S, Hartge P, Cerhan JR, Cozen W, et al. Metabolic gene variants and risk of non-Hodgkin’s lymphoma. Cancer epidemiology, biomarkers & prevention: a publication of the American Association for Cancer Research, cosponsored by the American Society of Preventive Oncology. 2006; 15:1647–53.
18. Giles GG, English DR. The Melbourne Collaborative Cohort Study. IARC scientific publications. 2002; 156:69–70. [PubMed: 12484128]
19. Greenberg AJ, Lee AM, Serie DJ, McDonnell SK, Cerhan JR, Liebow M, et al. Single-nucleotide polymorphism rs1052501 associated with monoclonal gammopathy of undetermined significance and multiple myeloma. Leukemia. 2012
20. Howie BN, Donnelly P, Marchini J. A flexible and accurate genotype imputation method for the next generation of genome-wide association studies. PLoS genetics. 2009; 5:e1000529. [PubMed: 19543373]
21. Browning SR, Browning BL. Rapid and accurate haplotype phasing and missing-data inference for whole-genome association studies by use of localized haplotype clustering. American journal of human genetics. 2007; 81:1084–97. [PubMed: 17924348]
22. Willer CJ, Li Y, Abecasis GR. METAL: fast and efficient meta-analysis of genomewide association scans. Bioinformatics. 2010; 26:2190–1. [PubMed: 20616382]
23. Coetzee SG, Rhie SK, Berman BP, Coetzee GA, Noushmehr H. FunciSNP: an R/bioconductor tool integrating functional non-coding data sets with genetic association studies to identify candidate regulatory SNPs. Nucleic acids research. 2012; 40:e139. [PubMed: 22684628]
24. Coetzee SG, Coetzee GA, Hazelett DJ. motifbreakR: an R/Bioconductor package for predicting variant effects at transcription factor binding sites. Bioinformatics. 2015
25. Karolchik D, Barber GP, Casper J, Clawson H, Cline MS, Diekhans M, et al. The UCSC Genome Browser database: 2014 update. Nucleic acids research. 2014; 42:D764–70. [PubMed: 24270787] 26. Jeggari A, Marks DS, Larsson E. miRcode: a map of putative microRNA target sites in the long
non-coding transcriptome. Bioinformatics. 2012; 28:2062–3. [PubMed: 22718787]
27. Betel D, Koppal A, Agius P, Sander C, Leslie C. Comprehensive modeling of microRNA targets predicts functional non-conserved and non-canonical sites. Genome biology. 2010; 11:R90. [PubMed: 20799968]
28. Gourraud PA, Khankhanian P, Cereb N, Yang SY, Feolo M, Maiers M, et al. HLA diversity in the 1000 genomes dataset. PloS one. 2014; 9:e97282. [PubMed: 24988075]
29. Weinhold N, Meissner T, Johnson DC, Seckinger A, Moreaux J, Forsti A, et al. The 7p15.3 (rs4487645) association for multiple myeloma shows strong allele-specific regulation of the MYC-interacting gene CDCA7L in malignant plasma cells. Haematologica. 2014
30. Xia XZ, Treanor J, Senaldi G, Khare SD, Boone T, Kelley M, et al. TACI is a TRAF-interacting receptor for TALL-1, a tumor necrosis factor family member involved in B cell regulation. The Journal of experimental medicine. 2000; 192:137–43. [PubMed: 10880535]
31. Zhang X, Park CS, Yoon SO, Li L, Hsu YM, Ambrose C, et al. BAFF supports human B cell differentiation in the lymphoid follicles through distinct receptors. International immunology. 2005; 17:779–88. [PubMed: 15908449]
32. Adzhubei, I., Jordan, DM., Sunyaev, SR. Predicting functional effect of human missense mutations using PolyPhen-2. In: Haines, Jonathan L., et al., editors. Current protocols in human genetics/ editorial board. 2013. Chapter 7:Unit7 20
33. Ng PC, Henikoff S. Predicting deleterious amino acid substitutions. Genome research. 2001; 11:863–74. [PubMed: 11337480]
A
uthor Man
uscr
ipt
A
uthor Man
uscr
ipt
A
uthor Man
uscr
ipt
A
uthor Man
uscr
34. Forzati F, Federico A, Pallante P, Abbate A, Esposito F, Malapelle U, et al. CBX7 is a tumor suppressor in mice and humans. J Clin Invest. 2012; 122:612–23. [PubMed: 22214847]
35. Guan ZP, Gu LK, Xing BC, Ji JF, Gu J, Deng DJ. Downregulation of chromobox protein homolog 7 expression in multiple human cancer tissues. Zhonghua Yu Fang Yi Xue Za Zhi. 2011; 45:597– 600. [PubMed: 22041561]
36. Walker BA, Leone PE, Chiecchio L, Dickens NJ, Jenner MW, Boyd KD, et al. A compendium of myeloma-associated chromosomal copy number abnormalities and their prognostic value. Blood. 2010; 116:e56–65. [PubMed: 20616218]
37. Demchenko YN, Kuehl WM. A critical role for the NFkB pathway in multiple myeloma. Oncotarget. 2010; 1:59–68. [PubMed: 20890394]
38. Hideshima T, Chauhan D, Richardson P, Mitsiades C, Mitsiades N, Hayashi T, et al. NF-kappa B as a therapeutic target in multiple myeloma. J Biol Chem. 2002; 277:16639–47. [PubMed: 11872748]
A
uthor Man
uscr
ipt
A
uthor Man
uscr
ipt
A
uthor Man
uscr
ipt
A
uthor Man
uscr
Figure 1. Genomic annotation of the 3p22.1, 7p15.3, and 22q13.1 regions
UCSC browser views showing wiggle tracks from ENCODE data for CD20+ B-cells from two cell lines, RO01778 and RO01794. The peak calls from these data were used to segment the genome into non-coding functional regions as detailed in the inset at bottom right. a)
Region 3p22.1 detailing the 5′ end of the ULK4 gene, where high-confidence SNPs overlap
the central regulatory core region of the active promoter. b) Overview of the 7p15.13; an enhancer with active histone marks within intron 79 of DNAH11 as described in the text. c) Overview of region 22q13.1 where several SNPs overlap with the promoter and downstream
A
uthor Man
uscr
ipt
A
uthor Man
uscr
ipt
A
uthor Man
uscr
ipt
A
uthor Man
uscr
enhancers of CBX7. DHS: DNase I hypersensitive site, CTCF: CTCF bound region, ENH [active]: enhancer with H3K27 acetylation (K27Ac), ENH+DHS: DNase I hypersensitive region found within an active enhancer, PROM [active]: promoter with H3K27 acetylation, PROM+DHS: DNase I hypersensitive region found within an active promoter. Other abbreviations: DGF: digital DNase I footprinting, K4M1: H3K4 mono-methylation, K4M2: H3K4 dimethylation, H2A.Z: H2A.Z histone modification (not used for segmentations).
A
uthor Man
uscr
ipt
A
uthor Man
uscr
ipt
A
uthor Man
uscr
ipt
A
uthor Man
uscr
A
uthor Man
uscr
ipt
A
uthor Man
uscr
ipt
A
uthor Man
uscr
ipt
A
uthor Man
uscr
ipt
T ab le 1The association of genetic risk v
ariants with multiple myeloma risk in persons of European and African ancestry
, including pre
viously reported inde
x
single nucleotide polymorphisms and the most statitistically signif
icant risk v
ariants from a combined meta-analysis of the tw
o populations.
Index SNPs
a/most signif
icantly associated SNPs
b
Association in Eur
opean ancestry
Association in African ancestry
A
uthor Man
uscr
ipt
A
uthor Man
uscr
ipt
A
uthor Man
uscr
ipt
A
uthor Man
uscr
a Inde
x SNP in each re
gion, OR and p-v
alues from the literature (
5
,
6
,
8
).
b Most signif
icant Group A SNP in each re
gion from the combined AA and EA meta-analysis
c r2
from 1KGP (AFR/EUR reference)
d Combined analyses were not performed in the HLA re