Macroinvertebrate responses to watershed land use and local-scale stream restoration.
Christy Royer Violin
A dissertation submitted to the faculty of the University of North Carolina at Chapel Hill in partial fulfillment of the requirements for the degree of Doctor of Philosophy in the Department of Biology.
Chapel Hill 2011
ABSTRACT
CHRISTY ROYER VIOLIN: Macroinvertebrate responses to watershed land-use and local scale stream restoration
(Under the direction of Seth R. Reice)
Human land use practices have resulted in the widespread degradation of waterways draining the surrounding landscape, resulting in poorly functioning streams with lower biological diversity than streams in undisturbed watersheds. Stream restoration has become an increasingly popular method for ameliorating local-scale degradation. Current stream restoration methodology reconfigures channel morphology to reflect a pre-degradation ideal, and relies on habitat provision as the primary means to facilitate biotic community recovery. However, there is little information on the success of this approach. This dissertation focuses on the consequences of urban land use for
macroinvertebrate stream community structure and the potential for Natural Channel Design, a common reach scale restoration method, to ameliorate stream degradation due to catchment based land use in various catchment types. In two studies examining macroinvertebrate community response to stream
restoration, Natural Channel Design did not lead to improvement in
ACKNOWLEDGEMENTS
I would like to thank the many friends and colleagues who collaborated and assisted me on this work. In particular, I would like to thank Dave Penrose, for taking the time to teach me how to collect and identify benthic invertebrates. Additionally, I’d like to thank the members of the Bernhardt lab for their help and support.
The text of Chapter 2 is, in full, a reprint of material in press at Ecological
TABLE OF CONTENTS
LIST OF TABLES……….ix LIST OF FIGURES………...xi Chapter
I. INTRODUCTION………...1
II. EFFECTS OF URBANIZATION AND URBAN RESTORATION ON THE PHYICAL AND BIOLOGICAL STRUCTURE OF
STREAM ECOSYSTEMS………8 III. STREAM RESTORATION FAILS TO IMPROVE COMMUNITY
STRUCTURE AND SHOWS LIMITED CORRELATION BETWEEN MITIGATION SUCCESS CRITERIA AND
MACROINVERTEBRATE COMMUNITY DYNAMICS……….50 IV. IDENTIFYING FACTORS AFFECTING MACROINVERTEBRATE
COMMUNITY COMPOSITION ON AN URBANIZATION GRADIENT: A STRUCTURAL EQUATION MODELING
APPROACH………...84
V. CONCLUSIONS……….120
APPENDICES
Appendix 2A. Study site UTM coordinates………...127 Appendix 2B. Example habitat maps and site photos
of study block 1………..128 Appendix 2C. Study site species lists………129 Appendix 4A. Landscape, soil, water quality, hydrology,
pollution, sediment function, temperature variables that are potential predictors for
LIST OF TABLES
Table
2.1. Study sites listed by block, stream type, EPA level IV
ecoregion, channel and catchment characteristics...38 2.2. Mean values (± SE) of stream physical characteristics
and results and effect sizes of one-way Analysis of Variance
with stream type as a factor………39 2.3. Mean values (± SE) of macroinvertebrate community
metrics and results and effect sized of one-way Analysis
of Variance with stream type as a factor……….40 2.4. Results of least-squares linear regression analyses of
macroinvertebrate community metrics………...40 3.1. Study site characteristics………..76 3.2. Results from least-squares linear regression analyses of
pre-restoration macroinvertebrate metrics at upstream
unrestored and restored sampling sites………..76 3.3. Mean values (± SE) of pre and post-restoration
macroinvertebrate community metrics for both upstream
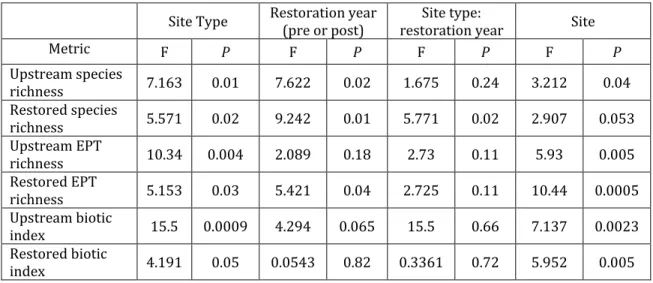
and restored sampling sites………77 3.4. Results of two-way repeated measures Analysis of
Variance analyzing the effects of site type and
restoration year on macroinvertebrate community metrics……….77 3.5. Results of two-way repeated measures Analysis of
Variance with site type and restoration year as factors………78 3.6. A statistics and p values from blocked MRPP analyses………..78 4.1. Pearson correlation coefficients between environmental
variables and NMS axes 1 and 2……….110 4.2. Environmental variables from NMS joint plots correlated
with axes 1 and 2……….111 4.3. Correlation coefficients and R2 values for individual taxa
LIST OF FIGURES
Figure
2.1. Study site locations and watershed boundaries……….41 2.2. Mean values (± SE) of stream physical characteristics………..42 2.3. Mean values (± SE) of macroinvetebrate physical
characteristics………..43 2.4. Linear regression of seasonal macroinvertebrate
community metrics vs. watershed imperviousness and
habitat transitions……….44 2.5. Two-dimensional joint plots of NMS ordination of summer
and winter macroinvertebrate samples………..45 2.6. Hydrographs and station map of Upper Mud Creek,
Lower Mud Creek, and Mud Creek Tributary………...47 2.7. Two dimensional representation of 3-dimensional NMS
of all Rocky Branch and forested site data……….48 3.1. Study site locations………..79 3.2. Least-squares linear regression of pre-restoration
macroinvertebrate community metrics at both upstream unrestored and restored sampling sites
vs. percent forested watershed……….80 3.3. Mean values (± SE) of macroinvertebrate community
metrics, pre and post restoration at upstream unrestored
and restored sampling sites………81 3.4. Annual restoration responses of macroinvertebrate
community metrics………..82 3.5. Annual Mean restoration responses (± SE) of
macroinvertebrate community metrics………..83
4.1. Conceptual model of macroinvertebrate community
structure………...115 4.2. Joint plot of NMS 2-dimensional ordination of study sites
4.3. Least squares linear regression of total richness, EPT richness, NMS axis1 scores, and NMS axis 2 scores
vs. 2005 urban development………...117 4.4. Exogenous variable-only structural equation models
of NMS axes 1 and 2………...118 4.5. Final structural equation model predicting
Lotic ecosystems are essential to the preservation of the world’s freshwater resources. Past and current land use practices have led to widespread damage of these systems and consequently, decreased ecological function (Postel and Richter 2003). River networks drain the terrestrial landscape and perform important ecosystem services, such as the processing of organic matter, nutrients and pollutants. These processes limit the transport of such materials to downstream lakes and estuaries, and thereby increase water quality (Sweeney et al. 2004). In addition, streams and rivers represent distinct and diverse biological communities (Sabo et al. 2005).
Stream impairment arising from land use is multifaceted. Agricultural and urban development leads to stream channel homogenization and pollution, and consequently, reduced ecosystem function and biological diversity. Agricultural and urban runoff leads to eutrophication and pollutant loading (Lenat and Crawford 1994, Carpenter et al. 1998, Bernhardt et al. 2008). High and medium density development, crop tillage, direct livestock access, erosion from unstable stream banks, and altered hydrology have increased sedimentation (Wolman 1967, Costa 1975, Booth and Jackson 1997). Riparian forest loss and fragmentation have increased due to urban and agricultural activities close to stream channels
(Benstead et al. 2003, Sweeney et al. 2004). These insults lead to poor water quality, habitat homgenization, altered trophic structure (reviewed in Allan 2004),
The consequences and extent of stream alteration depend on the type of catchment land use, the proportion of the catchment affected, and the proximity of land use to the stream channel (Wang and Kanehl 2003, Moore and Palmer 2005). Agricultural activities in watersheds and riparian zones cause extensive non-point source pollution (Lenat and Crawford 1994) and erosion, sedimentation, and channelization from crop tillage and stream straightening (Landwehr and Rhoads 2003). Livestock cause heavy nutrient loading and direct, physical degradation of stream banks and benthic habitat (reviewed in Belsky et al. 1999, Strand and Merritt 1999).
The characteristic suite of physical, biogeochemical, and biological stream impairments in urbanized watersheds are termed the “Urban Stream Syndrome” (Walsh et al. 2005b). Geomporhological and hydrological consequences of
watershed urbanization include altered base flow and unstable hydrology with frequent short duration high peak floods (Booth and Jackson 1997, Paul and Meyer 2001, Meyer et al. 2005). Modified hydrology leads to channel incision and
2003, Grimm et al. 2005, Meyer et al. 2005).
In the future, human population growth will occur predominantly in urban centers, and therefore an increasing proportion of the world’s freshwater
ecosystems will become impacted by urban factors (United Nations 2008). Stream macroinvertebrate communities are typically species rich and are strongly affected by land use patterns (Lenat and Crawford 1994, Sponseller et al. 2001, Allan 2004) and aquatic community impairment is associated with urban development across a range of taxa (Wang et al. 1997, Paul and Meyer 2001, Wang et al. 2001, Roy et al. 2003, Cuffney et al. 2005, Roy et al. 2005, Cuffney et al. 2010). Watershed
impervious surface is associated with lower invertebrate species richness and higher community tolerance (Morse et al. 2003, Roy et al. 2003, Moore and Palmer 2005, Cuffney et al. 2010). Development in close proximity to or hydrologically connected to stream channels can be particularly detrimental to stream
communities (Walsh et al. 2001, Wang and Kanehl 2003, Moore and Palmer 2005). Fragmentation and riparian vegetation removal can limit terrestrial adult dispersal (Wiens 2001, Briers and Gee 2004, Smith and Collier 2005). Urbanization also degrades macroinvertebrate community structure due to stream water chemistry (Roy et al. 2003), sediment particle size (Roy et al. 2003, Violin et al. in press),
hydrology (Walsh et al. 2001, Walsh et al. 2005a, Cuffney et al. 2010), sedimentation (Minshall 1984, Roy et al. 2003), and metal pollution (Sloane and Norris 2003).
rep-impacted conditions as possible (National Research Council 1992). In North Carolina, a predominant method of stream restoration is Natural Channel Design (Rosgen 1994, 1996). This method reconfigures the pattern, profile and dimensions of a degraded channel to resemble unimpacted regional conditions (Rosgen 2007) by using heavy machinery to re-meander the channel and create a new floodplain. In addition, this approach installs hard structures such as rock vanes to control stream grade, uses vegetation and root wads to stabilize banks, constructs new riffle habitat by adding coarse bed material, and revegetates riparian areas.
To restore degraded aquatic communities, stream restoration relies on the assumption that reconfiguring channel geomorphology to pre-degradation
requirements, and the variety of restoration strategies, long-term studies of restoration success are lacking (but see Moerke et al. 2004).
In North Carolina, the recent widespread implementation of reach-scale stream restoration is largely funded by the need to mitigate for stream loss
elsewhere due to public and private development, as required by the Clean Water Act (Lave et al. 2008, Doyle and Yates 2010). The Clean Water Act requires no net loss of stream function, for which stream length is currently used as a surrogate. In North Carolina, there are no in-stream biological or functional stream restoration success criteria. Rather, practitioners monitor vegetation and geomorphology, and equate geomorphology and adequate live riparian plantings with biological and functional success (Lave et al. 2008, BenDor et al. 2009).
This dissertation focuses on the consequences of catchment urbanization to stream macroinvertebrate communities, and the ability of reach scale restoration to rehabilitate degraded aquatic communities. The overarching goals of this
dissertation are to improve our mechanistic understanding of how urban land use degrades macroinvertebrate communities, and to evaluate the extent to which local-scale stream restoration successfully rehabilitates impaired aquatic communities under different land use regimes. A better understanding of both of these issues will facilitate better management of stream ecosystems and may improve restoration design and implementation.
ability of reach scale urban stream restoration to improve physical structure and aquatic invertebrate community structure by comparing urban restored streams to urban degraded and forested reference endpoints. Chapter 3 presents the results of an analysis of long-term stream restoration macroinvertebrate monitoring. This study sought to answer the questions of whether or not local scale stream
restoration improved macroinvertebrate community structure in Natural Channel Design restoration projects located in rural, agricultural, and urban catchments throughout North Carolina, whether invertebrate communities improved with time since restoration. To better understand the mechanistic pathways by which
Chapter 2
Abstract
Streams, as low-lying points in the landscape are strongly influenced by the stormwaters, pollutants, and warming that characterize catchment urbanization. River restoration projects are an increasingly popular method for mitigating urban insults. Despite the growing frequency and high expense of urban stream
restoration projects, very few projects have been evaluated to determine whether they can successfully enhance habitat structure or support the stream biota
characteristic of reference sites. We compared the physical and biological structure of four urban degraded, four urban restored, and four forested streams in the Piedmont region of North Carolina to quantify the ability of reach-scale stream restoration to restore physical and biological structure to urban streams and to examine the assumption that providing habitat is sufficient for biological recovery. To be successful at mitigating urban impacts, the habitat structure and biological communities found in restored streams should be more similar to forested
reach and catchment scale respectively. Macroinvertebrate communities in restored channels were compositionally similar to the communities in urban degraded channels and both were dissimilar to communities in forested streams. The macroinvertebrate communities of both restored and urban degraded streams were correlated with environmental variables characteristic of degraded urban systems. Our study suggests that reach-scale restoration is not successfully mitigating for the factors causing physical and biological degradation.
Key words
Introduction
The world’s human population is primarily urban, and future population growth will occur predominantly in urban centers (United Nations 2008). Thus, an increasing proportion of our freshwater ecosystems will become impacted by urbanization, and a larger fraction of humanity will rely on waterways degraded by a common set of urban impacts. The physical, biogeochemical, and biological stream impairments that occur specifically in urbanized watersheds have been labeled the “Urban Stream Syndrome” (Walsh et al. 2005b). Physical and
hydrological consequences of watershed urbanization are well documented and include altered base flow and unstable hydrology with frequent short duration high peak floods (Booth and Jackson 1997, Paul and Meyer 2001, Meyer et al. 2005, Walsh et al. 2005b). These changes typically lead to channel incision and
simplification (Shields et al. 2003, Niezgoda and Johnson 2005, Sudduth and Meyer 2006), and homogenization of benthic habitats (FISRWG 1998, Malmqvist and Rundle 2002, Walsh et al. 2005b).
Coincident with hydrological and geomorphological modification, urban
streams have elevated nutrient and contaminant concentrations. Hyperconnectivity with the surrounding landscape through roads, storm drains, and leaky and
The inverse relationship between urbanization and native biodiversity and species composition is well established and persists across a range of taxa (Blair 1996, Germaine and Wakeling 2001, Clark et al. 2007, Grimm et al. 2008, McKinney 2008). Macroinvertebrate communities are strongly affected by land use patterns (Lenat and Crawford 1994, Sponseller et al. 2001, Allan 2004). Watershed
impervious surface cover is generally associated with a decrease in invertebrate species richness and increasing dominance of highly tolerant taxa (Morse et al. 2003, Roy et al. 2003, Moore and Palmer 2005, Collier et al. 2009, Cuffney et al. 2010). Development that is within riparian areas or that is directly hydrologically connected to stream channels (e.g. road crossings and pipes) can be particularly detrimental to stream communities (Wang and Kanehl 2003, Moore and Palmer 2005, Walsh and Kunapo 2009), and there is thus great interest in riparian
reforestation and management for urban stream ecosystem protection (Bernhardt and Palmer 2007). While the impacts of watershed urbanization on stream biota are well documented, it is far from clear what combination of reach and watershed scale management is necessary and sufficient to promote community recovery in urban streams.
unique problems: there is minimal space for rehabilitation, and land acquisition is both expensive and complicated because it generally involves multiple landowners. These challenges typically lead to fewer linear feet being restored and higher per-project costs compared to rural and agricultural stream restoration per-projects (Bernhardt and Palmer 2007). In fact, for many regions of the US the majority of restoration dollars are invested in a small number of urban stream projects (Hassett et al. 2005, Sudduth et al. 2007). Stream restoration projects are customarily
implemented with the specific goals of water quality improvement and provision of aquatic habitat (Bernhardt et al. 2007, Sudduth et al. 2007), yet few projects have been adequately evaluated to determine whether these goals are met (Charbonneau and Resh 1992, Palmer et al. 1997, 2005, Moerke et al. 2004, Moerke and Lamberti 2004, Bernhardt et al. 2005). Given the frequency with which urban stream
restoration is employed to mitigate habitat and water quality degradation and the expenses and challenges involved, it is worth understanding whether these efforts are measurably improving habitat and community structure.
restoration design employs habitat provision, or increased habitat heterogeneity as the primary mechanism for restoring biotic communities (Brooks et al. 2002). Evidence to support the assumption that successfully restoring physical structure is sufficient for community restoration (the “field of dreams” hypothesis) is lacking (Palmer et al. 1997, 2010, Moerke et al. 2004).
We set out to evaluate the effectiveness of four Natural Channel Design (NCD) projects, a common urban stream restoration approach (sensu Rosgen 1994, 1996) in mitigating urban stream degradation. NCD reconfigures the pattern, profile and dimensions of a degraded channel to emulate an unimpacted ideal (Rosgen 2007). This method utilizes heavy machinery to re-grade and reshape a degraded channel and employs hard structures such as log vanes or cross vanes to control grade, installs root wads to stabilize banks, adds coarse bed material to create riffles, and re-vegetates reconfigured or newly created riparian areas.
Methods
Site selection
Through consultation with staff of the North Carolina Ecosystem
Enhancement Program (EEP) and the NC Stream Restoration Institute (SRI) we selected four urban Natural Channel Design restoration projects that practitioners and regulators felt were particularly well-designed and implemented. Our goal in selecting restoration projects was not to select a random sample, but rather to choose a set of projects that represented the best-case scenario for urban
restoration based on expert practitioners’ opinions. Each restored stream reach was then matched with a similarly situated unrestored urban stream and a forested stream in the Raleigh-Durham area in the Piedmont region of North Carolina. The full comparison thus included 12 study sites: four “forested” (F) sites, within small streams draining forested catchments; four “urban restored” (R) sites, within recently implemented natural channel design restoration projects; and four “urban degraded” (U) sites located in urban parks where future restoration activities are likely (Fig. 1, Appendix A). This suite of sites was selected to determine the potential for ecological restoration to restore the physical and biological structure and
ecosystem function of stream ecosystems. Site descriptions
ecoregions (Table 1). Soil characteristics affect baseflows and consequently stream size and permanence. Triassic Basin and Slate Belt streams have low summer baseflows due to low clay permeability and low water yield from slate substrate (Griffith et al. 2002). Reduced summer baseflows are not seen in Northern Outer Piedmont streams where streams tend to be larger and less prone to drying. For physical and functional metrics, all streams within a sampling block were sampled within one week with no intervening major storm events. In this way the blocking factor accounts for both differences in watershed size, and staged timing of field analyses.
Our study included four restored stream reaches – each of which was
restored using NCD between 1999 and 2005. The Abbott stream restoration project was implemented in 1999 on a tributary to Walnut Creek, in Raleigh, NC. The goal of this restoration project was,
“to restore the stream to the stable dimension, pattern, and profile for a C4 stream type as classified using Rosgen’s stream classification methodology (Rosgen 1996)…This type of restoration will reestablish the channel on a previous floodplain, or in this case, the basin of an old pond. Appropriate channel dimensions (width and depth), pattern (sinuosity, beltwidth, riffle-pool spacing), and profile (bed slope) of the new channel will be determined from reference reaches” (NCDOT 1999).
Rocky Branch is a stream located on the urban North Carolina State University campus in Raleigh, NC and was restored in 2001. The goals of this restoration project included,
stormwater control within the creek’s watershed; Provide safe and enjoyable access to the stream and passage through the campus by completing the greenway path adjacent to the creek.” (Doll 2003).
Restored in 2004, Sandy Creek flows through the urban Duke University campus in Durham, NC. The Sandy Creek project goals were to,
“Re-contour and restore more than 600 meters of degraded stream to
hydrologically reconnect the stream with the adjacent floodplain to improve biogeochemical transformations and stream water quality” (Richardson and Pahl 2005).
Third Fork Creek is a stream flowing through an urban park near downtown Durham, NC, and was restored in 2005. The goals of this project were to,
“Restore stable channel morphology that is capable of moving the flows and sediment provided by its watershed; reduce sediment-related poor water quality impacts resulting from lateral bank erosion and bed degradation; improve aquatic habitat diversity through the reestablishment of riffle-pool bed variability and the use of in-stream structures; restore vegetative riparian buffers utilizing native plant species; and improve natural aesthetics in an urban park setting.” (KCI Associates 2003).
located on city property in Raleigh, NC and drains an older, high- density urban neighborhood.
Forested sites were selected from “reference” sites previously used for stream restoration projects as well as sites within Duke Forest. Lower Mud Creek and the Tributary to Mud Creek are located in Duke Forest, in Durham, NC. Stony Creek is located in Duke Forest near Hillsborough, NC. Pot’s Branch is located in Umstead State Park near Raleigh, NC. Because of the land use history of the North Carolina Piedmont, these are not pristine reference sites, but rather post-agriculture reforested streams with primarily forested watersheds; thus there may be legacy effects of prior agricultural land use on geomorphology, vegetation, sediment, and biota (Maloney et al. 2008). There are no primary growth forests of sufficient size to have a permanent stream, rather our “forested” streams are secondary growth and represent the post-agricultural, pre-urban landscape. Due to the lack of undisturbed Piedmont streams, we included one forested stream reach, Lower Mud Creek that had urban development more than 1.5 km upstream of the study reach, and for which the entire watershed within that 1.5 km was ~100 year old mixed deciduous forest. Because Lower Mud Creek is far from an ideal reference stream, we
performed all statistical comparisons both with and without this stream. Land use characterization
sites. Land use and impervious surface cover within study watersheds were analyzed based on 2001 National Land Cover Dataset (NLCD), and the associated Impervious Surface Cover dataset from the USGS Seamless Server (Homer et al. 2004). We classified riparian land use in a 30m buffer around each stream segment using the same technique. NLCD was reclassified into four categories: developed, agriculture, undeveloped, and water and for each watershed we calculated the percent of each land use type and percent impervious surface cover. Percent
developed catchment and catchment impervious cover (ISC) were used as predictor variables in subsequent analyses.
Habitat surveys
In each stream we delineated experimental reaches encompassing at least one hour of travel time under June 2006 base flow conditions. We selected the upstream end of each reach by locating an area of constricted flow with the greatest downstream extent of channel uninterrupted by tributary inputs or road crossings. Reach travel time was determined by calculating water travel times using a
rhodamine dye release. We used rhodamine tracers because traditional salt tracers proved problematic in several of our urban streams due to high spatial and
and channel widths of riffle, run, pool, and debris dam habitats within each reach (VT WQD 2009). We used a stadium rod and level to survey longitudinal slope for the entire reach and to generate cross-sectional profiles for five randomly selected points within the reach. Reach canopy cover was measured at each cross section using a spherical densiometer. We conducted pebble count surveys of 100 randomly selected sediment particles spaced evenly throughout the study reach (Wolman 1954) to estimate variation in sediment grain size within each stream reach.
Hydrologic data
We created fine scale flow habitat maps by measuring velocity and depth values at five evenly spaced points across the active channel, with a sixth
measurement in the thalweg, at 30 cross-section locations evenly spaced
longitudinally in each reach. In October 2006 we deployed Solinst leveloggers in each stream reach to collect continuous measurements of water level. We used HEC-RAS (US Army Corps of Engineers) to estimate discharge water level and surveyed channel dimensions. We used these data to create a flashiness index (Baker et al. 2004) for use as a predictive variable in macroinvertebrate community analyses.
Functional measures
Macroinvertebrate sampling
Macroinvertebrate sampling was conducted at the 12 study sites between May and September 2006 (“summer” sample) and February and March 2007 (“winter” sample) from the same reach as physical and functional measurements were taken. Macroinvertebrate communities were sampled once each season using the North Carolina Department of Water Quality Qual 4 semi-quantitative protocol (NC DWQ 2006). This sampling protocol is designed to assess macroinvertebrate diversity in small streams (drainage area < 7.7 km2) and is conducted so that sampling effort is consistent among study sites. Each sample consisted of one 2-3 min, 1 m2, 1 mm mesh kick net sample from a characteristic riffle, one 500 mm mesh triangular sweep net of stream marginal habitats such as root mats and bank
Data analyses
Physical data analyses
Habitat complexity was determined by counting the number of transitions between different aquatic habitats (riffle, run, pool, and debris dam classifications) for each experimental reach. The transition counts were normalized for all reaches by converting the counts to number of transitions per 100 m reach length. The average number of transitions and standard error was determined for each stream type (F, R, and U). Velocity and point depth measurement averages for each reach were calculated and used to obtain an average and coefficient of variation for each stream type.
Macroinvertebrate data analyses
In addition to total species richness, we calculated richness of the orders Ephemeroptera, Plecoptera, and Trichoptera, (EPT) as a measure of pollution-sensitive taxa richness. We also calculated Biotic Index (BI) for each site as a measure of overall macroinvertebrate community pollution tolerance. BI was calculated as a weighted mean of taxa tolerance values relative to their abundance, and higher BI values indicate a more pollution-tolerant assemblage (NC DWQ 2006). Individual taxon tolerance values were taken from the NC DWQ benthos standard operating protocol (Lenat 1993, NC DWQ 2006). Taxa for which BI information was not available represented a small minority of taxa and were excluded from the BI calculations. We compared community metrics among stream types using one-way analysis of variance (ANOVA) with stream type as a factor. Where the overall affect of stream type was significant, post-hoc pairwise comparisons and effect size calculations were performed as for physical metrics.
We used least-squares linear regression to quantify correlative relationships between macroinvertebrate metrics and environmental physical and functional variables. As sites were grouped into sampling blocks a priori according to
We examined seasonal macroinvertebrate species compositional similarity among sites using Non-metric multidimensional scaling (NMS) ordination of sites in species space, using Bray-Curtis similarities of square root transformed abundance values (PC-ORD v.5, McCune and Mefford 2006). Solutions were obtained from 500 runs (250 randomized, 250 with real data) using random starting coordinates. We created joint plots incorporating a second matrix of physical and functional
variables. We set a minimum r2 of 0.30 to identify geomorphological and functional
parameters correlated with macroinvertebrate community structure at different sites.
We assessed the importance of time since restoration to macroinvertebrate recovery by evaluating separately collected macroinvertebrate monitoring data from Rocky Branch both within the restoration and at an unmanipulated upstream reference, and from Sal’s Branch, a forested reference site in Umstead Park, NC. Monitoring data were collected using the same NC DWQ Qual-4 protocol as for this study. Pre-restoration samples were collected for Rocky Branch in 12/2000, and post-restoration data were collected in 12/2003, 11/2004, 12/2005, and 12/2006. Reference data were collected from Sal’s Branch in 3/2002, 3/2003, and 5/2004. We evaluated the importance of time since restoration to total species richness, EPT richness, and community BI for Rocky Branch. We calculated the change in each community metric by subtracting the pre-construction value from the
post-restoration value for each monitoring year (ΔRestoration= Metricpost-restoration
factors other than restoration by performing the same calculation for the upstream
reference (ΔUpstream = Metricupstream yeari – Metric upstream pre-restoration) and
then calculated the effect of restoration by taking the difference of the two
(Restoration Response = ΔRestoration - ΔUpstream). This is similar to the “Raw Effect
Score” for taxon abundance calculations from impact assessment studies (Weiss and Reice 2005), but applied to community-level metrics. We evaluated species
compositional similarity among these samples using the same NMS ordination protocol as above.
Results
To test our overarching hypothesis that positive restoration outcomes would lead urban restored streams to become more similar to minimally impacted sites, we compared physical and biological attributes among the three stream types. Excluding Lower Mud Creek did not change the conclusions of any of our
relationships of physical metrics among stream types and there was no consistent pattern in the effect of removing this site. However, in every case, removing Lower Mud Creek from biological analyses increased the strength of the observed
Habitat
Urban streams had significantly deeper channels, smaller substrate sizes and less reach scale habitat variation (transitions between riffles, runs and pools) than their forested counterpart (Table 2, Fig. 2). For each of these metrics, urban restored streams were indistinguishable from their urban degraded counterparts and
significantly different from the forested streams. We found a significant difference between urban degraded and urban restored reaches in only a single habitat metric – restored urban streams had significantly lower riparian canopy cover than their unrestored counterparts.
Our hydrologic metrics did not differ between stream types. Stream
velocities and flow heterogeneity were highly variable within stream types. There was no difference in either average or maximum degree of incision among stream types (Table 2).
Biological structure
(~higher number of sensitive taxa) in these three forested streams than in the urban restored and urban degraded streams (Table 3, Fig. 3).
Among quantified watershed variables, watershed imperviousness was found to be the best single predictor of EPT richness, although the trend was
significant only in winter (r2 = 0.54, P < 0.01). Biotic index was positively correlated
with watershed imperviousness in both summer (r2 = 0.50, P < 0.01) and winter
(r2=0.40, P < 0.05) (Table 4, Fig. 4).
Among the many in-channel structural and functional variables measured, habitat transitions/100 m was the only reliable predictor of EPT richness, with habitat complexity positively correlated with the number of EPT in both summer (r2
= 0.54, P < 0.01) and winter (r2 = 0.46, P < 0.05). Habitat complexity was strongly
negatively correlated with BI scores in both summer (r2= 0.70, P < 0.001) and
winter (r2= 0.67, P < 0.01). Removing Lower Mud Creek from the analyses
increased the strength of the observed relationships, but had a stronger affect on EPT richness than BI (Table 4, Fig. 4).
NMS Ordination results revealed large differences in community composition between stream types. Two-dimensional NMS solutions were best for both summer and winter. The summer NMS ordination had a final stress of 0.13 and explained 78.2% of compositional similarity, 40.2% along axis 1 and 37.8% along axis 2 (Fig. 5a). The winter NMS had a final stress of 0.078 and explained 88.2% of
50 m of forest between the reaches, Fig. 6), Lower Mud Creek and Mud Creek Tributary did not cluster together in either season.
In analyses of long-term data from Rocky Branch, we found no significant effect of time since restoration on total species richness, EPT richness, or BI. A three-dimensional NMS solution was best for explaining compositional similarity (final stress = 0.09, cumulative r2= 0.866) among Rocky Branch macroinvertebrate
communities collected as part of this study, upstream and restored samples collected for restoration monitoring, and reference data from Sal’s branch and the winter forested samples from this study. Regardless of year, restoration monitoring samples from Rocky Branch clustered more closely to restored samples collected as part of this study and impacted upstream reference samples than to forested
samples (Fig. 7).
Discussion
We hypothesized that if restoration is effective at improving degraded urban stream ecosystems, both the geomorphology and biota at restored sites would more closely resemble forested sites than would their urban counterparts. While it would be overly optimistic to expect restored stream reaches to become identical to
of >$1 million USD per project, these restored streams did not have improved habitat complexity or detectable changes in their macroinvertebrate communities. The deep, sandy, simplified channels in urban catchments suggest that hydrological differences, particularly storm events, are the major habitat structuring force in our study channels. Stormwater is rarely, if ever addressed by NCD, therefore this is likely a significant barrier to urban stream restoration success (Walsh et al. 2005a, Bernhardt and Palmer 2007).
The similarity in summer total species richness among stream types (Table 3, Fig. 3) is likely due to high richness of more tolerant non-EPT taxa in urban and urban restored sites (Appendix C). Higher winter EPT richness probably accounts for the significant effect seen in winter (Table 3, Appendix C). Higher EPT richness at forested sites (Fig. 3) is consistent with the expectation that urbanization
typically results in the loss of these sensitive taxonomic groups (Morse et al. 2003, Roy et al. 2003, Cuffney et al. 2010). Urban restored channels did not have higher EPT richness than urban degraded channels (Fig. 3), suggesting that Natural Channel Design is not mitigating the factors responsible for sensitive taxa loss at these locations. The difference in biotic integrity between urban restored and forested channels, and their similarity to urban degraded channels (Fig. 3) indicates that in addition to having lower sensitive taxa richness (i.e. lower EPT richness), these channels contain more tolerant assemblages across all invertebrate groups.
or evaluating the spatial arrangement of ISC (Moore and Palmer 2005) during the planning stages may increase the likelihood of successful restoration. However, although ISC cannot be easily altered, its effects may be mitigated by catchment-based stormwater retention efforts (Walsh et al. 2005a).
Urban degradation leads to compositionally distinct macroinvertebrate communities, which is not successfully mitigated by reach-scale restoration. NMS plots revealed that species composition of restored streams were more similar to each other and to urban degraded streams than to forested streams (Fig. 5). The lack of grouping of forested sites in summer illustrates that although forested sites possess multiple sensitive EPT taxa that primarily delineate them from urban sites (Fig. 5a), there are inter-site compositional differences across all taxonomic groups (Appendix C). While this could be due to the fact that sites were sampled over several summer months, it is also likely local scale habitat filters differed among forested sites and influenced community composition (Poff 1997). Additionally, although these sites are best-case scenarios of minimally impacted Piedmont streams, they are still subject to human impacts, the extent of which varies among catchments. The dissimilarity between Lower Mud Creek and Mud Creek Tributary in spite of their proximity further suggests that Mud Creek still experiences urban influences at the lower site. In fact, Lower Mud Creek is more similar to the urban degraded site Upper Mud Creek in both seasonal NMS plots (Fig. 5).
ion concentration (Fig. 5a). Higher percent dilution is characteristic of streams with higher groundwater and hyporheic exchange (Griffith et al. 2002) and this variable correlated mainly with Northern Outer Piedmont sites. High chloride concentration is probably caused by low groundwater and hyporheic exchange and low summer baseflows characteristic of Triassic basin and Slate Belt streams (Griffith et al. 2002). Axis two represents an urban vector that encompasses differences in habitat and water quality, canopy cover, and hydrological differences and consequently separates forested sites from those in urban catchments (Fig. 5a). This axis best represents our original hypothesis that if urban restoration effectively addresses factors responsible for sensitive taxa loss, restored sites would be at least
intermediate between forested and urban degraded endpoints. Our analysis finds no evidence of directional change in composition due to restoration.
The closer clustering of forested sites in winter (Fig. 5b) likely reflects the widespread winter prevalence of shredder taxa such as Tipula, Gammarus, and Amphinemura. An urban vector along axis 1 similar to that found in summer was the primary axis separating forested sites from urban and restored sites, and once again we found no evidence that the restored stream benthos were distinct from their unrestored urban counterparts (Fig. 5b). Additionally, stream nitrogen
winter ordination, in this season chloride concentrations were highly correlated with impervious cover – suggesting that winter chloride concentrations are
dominated by road salt use (e.g., Kaushal et al. 2005). Deep streams with high gross primary production (GPP) were delineated from other sites along axis 2 (Fig. 5b). Together the two axes appear to separate the open canopy urban streams with high nitrogen loading and higher temperatures from closed canopy forested streams with the cooler temperatures and high streamwater C:N ratios characteristic of forested heterotrophic streams (Fisher and Likens 1973).
The restored streams we studied more closely resembled urban rather than forested endpoints both structurally and biologically, suggesting that restoration activities have not yet led to the recovery of sensitive macroinvertebrate taxa in these streams. The large number of metrics measured in the context of this study provides an unprecedented opportunity to explore what factors are most important for community recovery.
Lower Mud Creek – an unacceptable reference site proves an effective case study of the field of dreams hypothesis
Due to the extreme difficulty of locating watersheds without significant urban or agricultural activity in the NC Piedmont, we made the decision to include Lower Mud Creek (LMC) as one of our forested streams. Based on its
supports a very depauperate faunal community. Although LMC proved to be a less than ideal forested stream replicate, the mismatch between physical habitat and biological community structure make it an ideal case study for investigating the limitations of reach–scale restoration. Lower Mud Creek was indistinguishable from other forested sites in most measured geomorphic variables, including habitat complexity. Among forested sites however, Lower Mud Creek had the fewest EPT taxa, and the most tolerant macroinvertebrate assemblage (highest BI value).
The positive correlation between habitat complexity and species richness is well documented (Macarthur and Macarthur 1961, Minshall 1984, O’Connor 1991, Downes et al. 1998, Allan 2004) but may not be causal (Palmer et al. 2010). We speculate that our measure of habitat complexity serves as an indicator of
hydrologic disturbance as well as a direct measure of habitat suitability. As such, we must caution that the observed strong positive correlation between habitat
complexity and sensitive invertebrate taxa (Table 4, Fig. 4) does not necessarily support the assumption that an increase in habitat complexity will improve biological communities. Indeed, our findings suggest that habitat restoration will prove ineffective if urban stormwaters rapidly rehomogenize restored stream segments, as seen in previous urban restorations (Larson et al. 2001, Booth 2005).
within our dataset with the least impervious cover and the highest diversity of sensitive macroinvertebrate taxa suggests that LMC is not dispersal limited. Indeed, several of the EPT taxa found in the tributary but not in LMC have been sampled in the riparian vegetation surrounding LMC suggesting that dispersal is likely (Violin, unpublished data). The apparent structural integrity and impaired
macroinvertebrate community suggests that while habitat complexity is important to faunal diversity, it is, on its own insufficient to support the recovery of biotic communities. This is an important caveat to the utility of the “field of dreams” hypothesis. Mud Creek experiences urban influences along its length, and although the kilometer preceding our LMC study site is entirely forested, this site has a characteristic urban hydrograph due to upstream catchment urbanization (Fig. 6). Hydrologic disturbance is a major driver of macroinvertebrate community
populations – such an effort would be unsuccessful at promoting the recovery of a diverse macroinvertebrate assemblage containing sensitive taxa unless the project also was able to mitigate storm flows or the associated pulses of sediments and contaminants through catchment-based efforts (Walsh et al. 2005a, 2007). Time since restoration
Restoration itself is a catastrophic disturbance to already impaired stream ecosystems (Tullos et al. 2009), and as a result, we expect time lags between
restoration implementation and community recovery. One possible explanation for the lack of significant recovery of habitat or biological communities within our restored streams is that insufficient time was allowed for recovery between the restoration implementation and our sampling effort. Our restored study sites were restored 1 to 7 years prior to our sampling effort, however the small sample size and the lack of pre-restoration data precluded us from evaluating the potential role of time lags in our initial data set. To address this question, we were able to
examine long-term data from one of our study sites (Rocky Branch, Raleigh NC). For this dataset we found no significant effect of time since restoration on total species richness, EPT species richness, or biotic index for the 5-year post-restoration monitoring period. Three-dimensional NMS ordination of long term monitoring data for the restored reach of Rocky Branch revealed that macroinvertebrate communities from the restored reach of Rocky Branch remained similar in
composition to the unrestored upstream urban reach during the five years of post restoration monitoring and remained consistently different from benthic
Branch) (Fig. 7). Thus, long-term monitoring of Rocky Branch further supports the conclusions of our synoptic sampling effort, with no evidence of directional change in restored stream reaches either away from the pre-restoration composition or towards reference stream conditions. All available evidence suggests that merely waiting longer prior to evaluating a restoration project is unlikely to lead to different conclusions.
Conclusions
Acknowledgements
Table 1. Study sites listed by block, stream type, EPA level IV ecoregion, channel, and catchment characteristics.
Block Status Site name region
Eco-Reach length (m) Estimated discharge (L/s) Watershed size
(km2) Developed % ISC %
forested Stony Creek 45c 100 0.66 6.9 24.4 3.4
1 restored urban Third Fork Creek 45g 80 4.41 4.4 99.5 32.4
urban
degraded Ellerbe Creek 45c/g 50 10.41 7.6 88.7 20.8
forested Branch Pot’s 45f 140 5.83 4.2 27.4 9.9
2 urban restored
Walnut Creek
Tributary 45f 200 5.47 1.7 84.5 17.8 urban
degraded Cemetery Creek 45f 100 11.54 2.2 98 19.1
forested Mud Creek Tributary 45c/g 54 2.08 0.9 4.4 0.5
3 urban
restored Branch Rocky 45f 50 1.54 1.5 99.2 34.8 urban
degraded Goose Creek 45g 35 3.72 1.7 100 39.4
forested Mud Creek 45c/g Lower 102.5 11.58 4.1 58.6 9.5
4 restored urban Sandy Creek 45g 60 12.00 6.7 76.9 16.8
urban
Table 2. Mean values (± SE) of habitat complexity, flow heterogeneity, floodplain connectivity, and canopy cover of forested, urban restored, and urban degraded stream types. Results and effect sizes are from one-way ANOVAs with stream type as a factor (Significance codes *0.05, **0.01, ***0.001).
Forested restored Urban degraded Urban df F ω2
Number of habitat transitions per 100-meter reach length
(#)
20.75±
1.89 9.250± 2.14 9.75±1.11 2,9 13.55* 41.1
Average depth from point measurements
(m)
0.065±
0.0164 0.175± 0.0131 0.158± 0.012 2,9 17.97** 48.5 Average %CV for
depth point measurements
109.3±
12.21 73.73± 7.59 83.03± 9.30 2,9 2.29 Average velocity from
point measurements (m/s)
0.035±
0.008 0.023± 0.007 0.026± 0.012 2,9 0.47 Average %CV for
velocity point measurements
209.2±
46.43 139.4± 5.38 237.0± 46.43 2,9 2.29 Average degree of
incision (W:D) 6.15± 0.37 7.14± 1.39 4.96±0.77 2,8 1.64 Average maximum
degree of incision (smallest W:D)
4.74±
0.31 5.02±1.06 4.40± 0.57 2,8 0.23 Average longitudinal
slope (%) 0.93± 0.49 0.51±0.49 0.29± 0.11 2,8 0.78 Average canopy cover
(%) 87.54± 2.50 53.71± 8.28 81.35± 4.36 2,9 10.37* 34.2 Median substrate size
Table 3. Mean values (± SE) of macroinvertebrate community metrics with and without Lower Mud Creek (LMC). Results and effect sizes are from one-way ANOVAs performed with and without LMC, with metric as a factor (Significance codes *0.05, **0.01, ***0.001).
Table 4. Results from least-squares linear regression analyses of macroinvertebrate community metrics with and without LMC (Significance codes *0.05, **0.01,
***0.001).
Forested
Forested w/out
LMC restored Urban degraded Urban df F
df w/out LMC F w/out LMC ω2 w/out LMC Summer species richness 20.0±
2.3 22.3± 0.3 15.3±3.9 15.0±-2.6 2,9 0.86 2,8 1.70 Summer
EPT
richness 5.8± 2.0 7.3± 1.8 1.8± 0.6 1.5± 0.9 2,9 3.28 2,8 8.79* 32.1 Summer
BI 5.8± 0.8 5.4± 1.0 7.7± 0.5 8.0± 0.4 2,9 4.35* 2,8 5.19* 20.2 Winter
species richness
29.3±
3.4 32.3± 1.9 15.5± 4.7 14.7± 3.8 2,8 4.19 2,7 5.88* 24.5 Winter
EPT richness
10.3±
2.4 12.3± 1.7 1.5± 0.5 1.3± 0.9 2,9 11.46** 2,8 34.47*** 67.0
Winter BI 5.6± 0.3 5.4± 0.3 7.0± 0.4 7.3± 0.5 2,8 5.55* 2,7 6.04* 25.1
Watershed
imperviousness r2 df F r
2
(w/o LMC) (w/o LMC) df (w/o LMC) F
Summer EPT 0.26 1,10 3.44 0.33 1,9 4.43
Summer BI 0.50 1,10 10.18** 0.51 1,9 9.55* Winter EPT 0.54 1,10 11.85** 0.58 1,9 12.23**
Winter BI 0.40 1,9 6.03* 0.40 1,8 5.24
Habitat transitions
Summer EPT 0.54 1,10 11.72** 0.86 1,9 56.62*** Summer BI 0.70 1,10 22.91*** 0.81 1,9 39.36*** Winter EPT 0.46 1,10 8.61* 0.58 1,9 12.60**
Figure 5. Two-dimensional joint plots of NMS ordination of summer (a) and winter (b) square-root transformation Bray-Curtis similarities with environmental
variables. Minimum explanatory r2 for environmental variables = 0.3. Final stress =
0.13 for summer and 0.078 for winter. Cumulative r2= 0.782 and 0.882 for summer and winter respectively. Site abbreviations: “AB” = Walnut Creek Tributary; “CEM” = Cemetery Creek; “FH” = Forest Hills; “GSE” = Goose Creek; “LMC” = Lower Mud Creek; “MCT” = Mud Creek Tributary; “NGP” = Ellerbe Creek; “POT” = Pot’s Branch; “SAN” = Sandy Creek’ “STO” = Stony Creek; “ UMC” = Upper Mud Creek.
Environmental variable abbreviations: “Hab trans”= habitat transitions; “%CV PD” = percent coefficient of variation of point depth “Ave canopy” = average canopy cover; “Cl-“ = chloride concentration (ppm); ”NH4-N” = ammonium-N concentration (ppm); “Ave depth” = average water depth (m); “DON” = dissolved organic nitrogen
concentration (ppm); “%ISC” = percent watershed impervious surface cover; “%WS Dev” percent developed watershed; “Point depth” = stream point depth (m);
“%Riparian ISC” = percent riparian buffer impervious surface cover; “%CV Canopy” = percent coefficient of variation of canopy cover; “GPP (g/m)” = gross primary production (g/m/d); “NO3-N” = nitrate-N concentration (ppm); “TN” = total
Figure 7. Two-dimensional representations of a.) axis 3 vs. axis 1 and b.) axis 3 vs. axis 2 of 3-dimensional NMS of all Rocky Branch and forested site data (final stress = 0.09, cumulative r2 = 0.866). Axis 3 explained the majority of compositional
differences (r2= 0.623), therefore 2D plots are shown relative to this axis. Site
abbreviations: “RBS” = Rocky Branch summer sample, this study; “RBW” = Rocky Branch winter sample, this study; “RBref00” = Rocky Branch monitoring, upstream reference 2000 (pre-restoration); “RBref03” = Rocky Branch monitoring, upstream reference 2003; “RBref04” = Rocky Branch monitoring, upstream reference 2004; “RBref05” = Rocky Branch monitoring, upstream reference 2005; “RBref06” = Rocky Branch monitoring, upstream reference 2006; “RBrest00” = Rocky Branch
monitoring, restored 2000 (pre-restoration), “RBrest03” = Rocky Branch
Chapter 3
Stream restoration fails to improve community structure and shows limited correlation between mitigation success criteria and macroinvertebrate community
Abstract
Stream restoration has become a common method for rehabilitating degraded ecosystems, and under the auspices of the no net loss provision of the Clean Water Act, has lead to the creation of mitigation banks to provide mitigation credits to public and private development projects that result in stream loss.
Currently, however, stream mitigation credits in North Carolina are rewarded based on measures that are considered surrogates for in-stream structure and function, and little information exists on how well biotic communities at restored sites are responding to restoration. Here we present the results of long-term benthic invertebrate monitoring of 13 Natural Channel Design projects implemented in rural, urban, and agricultural watersheds throughout North Carolina. Watershed land use type significantly affected the level of community degradation both pre and post-restoration. When compared with upstream-unrestored sites, invertebrate communities did not show improvement over time in any community structure variable, and in all but one case, differed significantly in species composition from upstream-unrestored sites. These results suggest that restoration is ineffective at restoring biotic community structure, and that local scale restoration may lead to long-term changes in community composition due to restoration activities.
Introduction
functioning streams with lower biological diversity than streams in undisturbed catchments. Agricultural and stormwater runoff and sewer overflows have led to nutrient and pollutant loading (Lenat and Crawford 1994, Carpenter et al. 1998, Bernhardt et al. 2008). Construction, farming and erosion from poorly protected stream banks and hydrological alteration have increased sedimentation (Wolman 1967, Costa 1975, Booth and Jackson 1997). Riparian deforestation has increased due to the proximity of these practices to stream channels (Benstead et al. 2003, Sweeney et al. 2004). These insults lead to poor water quality, unstable habitat, altered trophic structure, and unstable hydrology to which organisms cannot adapt (see Allan 2004 for a thorough review). Ultimately, land use alteration leads to loss of aquatic diversity, ecosystem function, and consequently, ecosystem services (Paul and Meyer 2001, Palmer et al. 2004, Sweeney et al. 2004, Meyer et al. 2005).
The consequences of land use change for stream degradation depend on both the type and extent of land use within the watershed, and the proximity of
development to the stream channel (Wang and Kanehl 2003, Moore and Palmer 2005). Watershed urbanization increases impervious surface cover, which
accelerates changes in stream structure such as channel incision (deepening of the channel) and channel widening through erosional processes, increased sediment input due to stream erosion and delivery by runoff from the surrounding watershed (Poff et al. 1997, Stepenuck et al. 2002, De Carlo et al. 2004), riparian zone
impairment (Sweeney et al. 2004), and increased point and non-point source
The antagonistic relationship between human land use and native biodiversity is a well-established global phenomenon (Blair 1996, Chapin et al. 2000, Germaine and Wakeling 2001, Tilman and Lehman 2001, Clark et al. 2007, Grimm et al. 2008, McKinney 2008). Increases in both agricultural production and the expansion of urban centers have led to global declines in biodiversity (Foley et al. 2005). Aquatic ecosystems are strongly affected by land use patterns (Lenat and Crawford 1994, Sponseller et al. 2001, Allan 2004), and terrestrial land use has led to declines in fishes and aquatic invertebrates (Wang et al. 2001, Wang and Kanehl 2003)
The extent of impervious surface in urban catchments is strongly, inversely correlated with macroinvertebrate species richness (Stepenuck et al. 2002, Morse et al. 2003, Wang and Kanehl 2003) and macroinvertebrate community composition shifts from an assemblage dominated by pollution-sensitive taxa such as
Ephemeroptera, Plecoptera, and Trichoptera (EPT), to one characterized by tolerant taxa such as Chironimidae, Tubificidae, and Oligochaeta (Morse et al. 2003).
To alleviate channel incision and bank erosion, water quality degradation, and habitat and biodiversity loss, degraded waterways are often targeted for
restoration. Stream restoration or rehabilitation encompasses a variety of strategies by which human impacts are mitigated and previous damage is addressed, with the overarching goal of returning the stream to as close to pre-impacted conditions as possible (National Research Council 1992). Historically, stream restoration
implementation has often been site specific and employed for a specific cause, such as local erosion or flooding, or targeted conservation of an endangered or
commercially important species (Bash and Ryan 2002, Roni et al. 2002, Doyle and Yates 2010). Post-restoration monitoring is rarely done and when done, monitoring results are rarely made available (Bernhardt and Palmer 2007, Palmer et al. 2007).
mitigation banks and state financing. In spite of the large amount of money spent, little information is available on the outcome of restoration success. Currently in North Carolina, there are no in-stream biological or functional success criteria. Rather, practitioners monitor vegetation and geomorphology, and equate reasonably stable morphology and adequate live riparian plantings with both biological and functional success (Lave et al. 2008, BenDor et al. 2009).
In addition to mitigation success requirements outlined a priori, stream restoration projects are often implemented with the specific goals of water quality improvement and habitat provision (Bernhardt et al. 2007, Sudduth et al. 2007) yet few projects have been adequately evaluated to determine whether these goals are met (Charbonneau and Resh 1992, Palmer et al. 1997, Moerke and Lamberti 2004, Sudduth et al. in press, Violin et al. in press). Previous studies of stream restoration success have shown limited or mixed geomorphological improvement (Jähnig et al. 2010), and typically show limited (Moerke et al. 2004, Palmer 2010) or no
improvement in macroinvertebrate community structure (Jähnig et al. 2010, Violin et al. in press). However, because of the individual nature of stream restoration projects, lax or varying monitoring requirements, and the variety of restoration strategies, long-term studies of restoration success are lacking (but see Moerke et al. 2004).
our knowledge, this study represents the first that reports analyses from multiple restoration projects utilizing monitoring data collected by the same methods, and possessing both pre-construction, and longitudinal post-restoration invertebrate monitoring data. Our expectations are that 1) successful restoration will result in macroinvertebrate communities whose species richness and biological integrity either equal or exceed upstream-unrestored sites, 2) community composition at restored sites will approach that of upstream sites, particularly where upstream sites are biologically intact, and 3) improvement in biological metrics after
successful restoration will occur over time as a restoration sites stabilizes following the extensive stream disturbances often caused by the restoration processes.
Methods
Site selection
The majority of the study sites were chosen from restoration projects primarily managed by the North Carolina Ecosystem Enhancement Program (NCEEP), and implemented to provide compensatory mitigation credits. An
North Carolina State University Water Quality Group. Based on these criteria, we selected 13 stream restoration sites for use in the analysis. Each site had one year of pre-construction data, and between four and eight years of post-restoration
monitoring data. At each stream restoration project, for each monitoring year, macroinvertebrate communities were sampled at an upstream-unrestored site above the restoration and at least one sampling location within restored channel. Because the majority of sites had five years of post-restoration data and 5 years is the time monitoring time frame for mitigation purposes, the majority of analyses were carried out for the initial 5-year post-construction monitoring period. Site Descriptions
Study sites were located throughout North Carolina, and encompassed a number of land use types and drainage basins within the Blue Ridge, Piedmont, and Southeast Plains ecoregions (Griffth et al. 2002, Table 1, Fig. 1), The 13 stream restoration projects studied were all restored using Natural Channel Design (NCD) methods. NCD reconfigures the pattern, profile and dimensions of a degraded
channel to emulate an unimpacted ideal (Rosgen 2007). This method utilizes heavy machinery to re-grade and reshape a degraded channel and employs hard
structures such as log vanes or cross vanes to control grade, installs root wads to stabilize banks, adds coarse bed material to create riffles, and re-vegetates reconfigured or newly created riparian areas.
mitigation for stream loss in the Tar/Pamlico river basin and was completed in 2002. The project objective was,
“to restore habitat and water quality to the restored reach and the Tar-Pamlico River Basin as a whole. By stabilizing the streambed and banks, the restoration will improve water quality by reducing the amount of sediment contributed to the watershed. Exclusion of cattle and establishment of a permanent riparian buffer should further help reduced sediment and nutrient input. The newly established riparian buffer will provide shade, thereby reducing water temperatures, and increase habitat and food for wildlife” (Ecoscience Corporation 2006).
The High Vista stream restoration project is on County Line creek, located in the French Broad river basin. This project was restored in 2002 and consists of 3500 linear feet (Table 1). Further construction was completed in 2007. All macroinvertebrate monitoring data was collected prior to maintenance
construction. According to project planning documents, the purpose of this project was to,
“design adjustments to the stream reach that will increase its long-term stability and create a more functional riparian ecological community. The design for the existing stream will adjust geomorphic dimensions, patterns, and profiles. The proposed changes reflect stable conditions of reference reaches and their current geomorphic conditions. Additionally, vegetated buffers will be created that match proximal natural ecological communities found in similar physiographic and climatic regions. The reach will be redesigned to maximize natural design in light of the needs of the golf course and physical constraints within the project area” (NCDENR-NC Ecosystem Enhancement Program 2009).
reconfigured stream from approximately 600 channelized feet. Significant repair work was performed on 1013 linear feet of Little Pine Creek in 2006. The goals of this restoration project were,
“streambank re-grading to relieve pressure on the banks during high flows; installation of in-stream structures to stabilize the banks and bank toe; to provide grade control by repositioning riffle areas to stop the channel from incising; and planting of vegetation along disturbed streambanks for long-term bank stability and habitat improvement (HDR 2005a, 2005b).” (NC Wildlife Resources Commission 2009).
The Hominy Swamp Creek restoration is located in Wilson County, NC within the Conentnea River Basin and restored 2232 linear feet of degraded urban stream in 2001. The objectives of the Hominy Swamp Creek restoration were to,
“Establish an stable dimension, pattern, and profile on 2160 linear feet of Hominy Swamp Creek: Improve habitat within Hominy Swamp Creek: Establish a riparian buffer along Hominy Swamp Creek: Incorporate this project into a watershed wide management plan.” (Rummel, Klepper and Kahl 2008).
The Payne Dairy stream restoration project was completed in 2000 and restored 8397 linear feet of Jumping Run Creek located in Alexander County, NC, within the Upper Catawba River Basin. The goals of this restoration project were,
“To restore Jumping Run from an altered/degraded stream corridor, including adjacent riparian zones and flood prone areas, to its natural, or referenced stable condition. The ultimate goal of this project is to improve water quality, and the natural function of Jumping Run.” (Kimley-Horn and Associated 2006).
Rocky Branch is a stream located on the urban North Carolina State