A Comparison of Lower Extremity Biomechanics and Muscle Activity between Individuals with Normal and Pronated Static Foot Postures
William Wyatt Little
A thesis submitted to the faculty of the University of North Carolina at Chapel Hill in partial fulfillment of the requirements for the degree of Master of Arts in the Department of Exercise & Sport Science in the College of Arts & Sciences.
Chapel Hill 2013
Approved by:
Excessive foot pronation is associated with biomechanical alterations which contribute to common lower extremity (LE) injuries. We compared ankle, knee, and hip kinematics and activation of the gluteus maximus and medius and hip adductors during gait and double and single-leg squatting tasks between individuals with “pronated” and “normal” static foot postures identified via the Foot Posture Index-6 (FPI-6). Fifty healthy subjects (25 pronated - PRO, 25 control - CON) volunteered to participate. The PRO group exhibited greater peak hip adduction (group difference = 2.9°, p = 0.022) during single-leg squatting and less rearfoot eversion excursion (group difference = 1.1°,
p = 0.021) during gait. No other differences were discovered, and these small group
differences are likely functionally irrelevant. These results suggest that a pronated static foot posture does not influence LE biomechanics or gluteal/adductor activity in manners consistent with heightened injury risk.
.
Abstract
WILLIAM WYATT LITTLE: A Comparison of Lower Extremity Biomechanics and Muscle Activity between Individuals with Normal and Pronated Static Foot Postures
iv
TABLE OF CONTENTS
LIST OF FIGURES ... VII LIST OF TABLES ... VIII
CHAPTER I ... 1
VARIABLES ... 5
Independent... 5
Dependent ... 5
RESEARCH QUESTIONS AND HYPOTHESES ... 7
OPERATIONAL DEFINITIONS ... 9
ASSUMPTIONS ... 9
DELIMITATIONS ... 9
LIMITATIONS ... 10
SIGNIFICANCE OF STUDY ... 10
CHAPTER II ... 12
DEFINITION OF PRONATION ... 12
THE SUBTALAR JOINT ... 12
ROLE OF PRONATION ... 13
PRONATION AND GAIT ... 14
NORMAL PRONATION ... 14
CAUSES OF EXCESSIVE PRONATION ... 16
DYNAMIC CONTROL OF PRONATION ... 16
QUANTIFYING PRONATION ... 17
Navicular Drop Test ... 18
Foot Posture Index ... 19
EFFECTS OF FOOT PRONATION UP THE KINETIC CHAIN ... 20
FOOT PRONATION AND HIP MUSCLE ACTIVATION ... 20
FOOT PRONATION AND LOWER EXTREMITY PATHOLOGY ... 21
SUMMARY ... 22
CHAPTER III ... 23
SUBJECTS ... 23
Inclusion/Exclusion Criteria ... 23
Screening Session ... 24
PROCEDURES ... 25
DATA REDUCTION ... 30
STATISTICAL ANALYSIS ... 32
CHAPTER IV... 33
INTRODUCTION ... 33
METHODS ... 35
Subjects ... 35
Screening Session ... 36
Procedures ... 36
vi
RESULTS ... 40
Gait ... 40
Double-leg Squat ... 41
Single-Leg Squat... 41
DISCUSSION ... 41
CLINICAL IMPLICATIONS ... 48
LIST OF FIGURES
viii
LIST OF TABLES
TABLE 1: STATISTICAL ANALYSES TABLE... 52
TABLE 2: DESCRIPTIVE STATISTICS FOR GAIT TASK ... 53
TABLE 3: DESCRIPTIVE STATISTICS FOR DOUBLE-LEG SQAUT TASK ... 54
CHAPTER I INTRODUCTION
The concept of foot pronation has existed in academic literature for over 100 years, described as long ago as 1898 as “the vicious weight-bearing position of the foot with the sole flat on the ground…[where] the foot rolls over on to its inner border…and the inner malleolus becomes more apparent.”1 As more research was conducted and a greater understanding attained of foot biomechanics and the underlying anatomy, a more specific definition of pronation – a “rotation in the transverse tarsal joint…in the
direction of a lower [medial longitudinal] arch”2 – was established. As the transverse tarsal joint, comprised of the calcaneocuboid and talonavicular joints, is the anatomical junction between the rearfoot and midfoot,3 it has been suggested that the motion that occurs here is interdependent on motion that occurs in the rearfoot, governed by the subtalar joint.4 Motion of the subtalar joint occurs about a unique axis that lies oblique to the axis of the talocrural joint and does not correspond to any of the cardinal planes of motion.5 Because of this, foot pronation is often referred to as a tri-planar motion combining simultaneous calcaneal eversion, talar adduction, and talar plantar flexion in the closed kinetic chain.6,7
2
motion in the rearfoot and a closed-pack orientation where forces that occur in the forefoot are conserved and transmitted through the rest of the kinetic chain.8,9 Foot pronation is commonly misunderstood as an unfavorable biomechanical phenomenon; however, it is a natural motion that occurs during functional activity10 for reasons previously discussed. While pronation is a necessary and naturally occurring motion, many individuals experience excessive pronation, where the foot collapses into excessive dorsiflexion, eversion, and abduction.5 Objectively quantifying the exact degree of this motion that occurs has proven difficult given the inaccessibility and unique axis of the subtalar joint,11 but excessive pronation, almost invariably a subjective measurement in the clinical setting, is easily identified by clinicians.
tibia into internal rotation.27,33 This theory has been substantiated by recent literature, with studies showing associations between greater rearfoot eversion and greater hip internal rotation and adduction,22,34 both of these also component motions of knee valgus motion in the closed kinetic chain.23,30
Due to these associations between greater rearfoot eversion and greater hip internal rotation and adduction, it is conceivable that pronation may also have an effect on hip muscle activation patterns, specifically the gluteus maximus, gluteus medius, and hip adductors as these muscles directly influence frontal and transverse plane motion at the hip. Research has demonstrated that a direct relationship exists between muscle activation, measured by electromyography (EMG) amplitude, and the total force produced by a muscle.35 In the event that pronation results in a greater amount of hip internal rotation and adduction, it is conceivable that greater EMG amplitudes may be witnessed in the gluteus maximus and gluteus medius during functional activity as they eccentrically control these motions.
4
which have demonstrated that at a given torque, EMG activity is greater when a muscle is in a shortened position and lesser when a muscle is in a lengthened position.38-40
Following this logic, greater hip internal rotation and adduction would theoretically increase the length of the gluteus maximus and gluteus medius and decrease the length of the hip adductors, which may respectively result in lesser and greater muscle activation. Specifically concerning the gluteus maximus and gluteus medius, there may also be interplay between these two mechanisms, with length-tension principles potentially driving lesser EMG activity while the need for greater torque to eccentrically control hip internal rotation and adduction may result in greater motor neuron recruitment.
VARIABLES Independent
• Group
• Pronation group – subjects who demonstrate a score of 7 to 9 on the Foot Posture Index FPI-6 during the screening session
• Control group – subjects who demonstrate a score of 0 to 4 on the Foot Posture Index FPI-6 during the screening session
Dependent
• Rearfoot Kinematics
• Peak rearfoot eversion angle during gait and double-leg and single-leg squatting tasks
• Rearfoot eversion excursion during gait and double-leg and single-leg squatting tasks
• Peak shank internal rotation (relative to calcaneus) angle during gait and double-leg and single-leg squatting tasks
• Shank internal rotation (relative to calcaneus) excursion during gait and double-leg and single-leg squatting tasks
• Knee Kinematics
• Peak knee internal rotation angle during gait and double-leg and single-leg squatting tasks
6
• Peak knee valgus angle during gait and double-leg and single-leg squatting tasks
• Knee valgus excursion during gait and double-leg and single-leg squatting tasks
• Hip Kinematics
• Peak hip internal rotation angle during gait and double-leg and single-leg squatting tasks
• Hip internal rotation excursion during gait and double-leg and single-leg squatting tasks
• Peak hip adduction angle during gait and double-leg and single-leg squatting tasks
• Hip adduction excursion during gait and double-leg and single-leg squatting tasks
• Surface Electromyography Measurements
• Mean EMG amplitude (normalized to MVIC) of the gluteus maximus during gait and double-leg and single-leg squatting tasks
• Mean EMG amplitude (normalized to MVIC) of the gluteus medius during gait and double-leg and single-leg squatting tasks
RESEARCH QUESTIONS AND HYPOTHESES
Research Question 1A: Is there a significant difference in frontal plane rearfoot motion between the pronation and control groups during gait and double-leg and single-leg squatting tasks?
• Hypothesis 1A: The pronation group will display significantly greater peak rearfoot eversion and rearfoot eversion excursion than the control group during each task.
Research Question 1B: Is there a significant difference in transverse plane shank motion (relative to calcaneus) between the pronation and control groups during gait and double-leg and single-double-leg squatting tasks?
• Hypothesis 1B: The pronation group will display significantly greater peak shank internal rotation and shank internal rotation excursion than the control group during each task.
Research Question 2A: Is there a significant difference in frontal plane knee motion between the pronation and control groups during gait and double-leg and single-leg squatting tasks?
8
• Hypothesis 2B: The pronation group will display significantly greater peak knee internal rotation and knee internal rotation excursion than the control group during each task.
Research Question 3A: Is there a significant difference in frontal plane hip motion between the pronation and control groups during gait and double-leg and single-leg squatting tasks?
• Hypothesis 3A: The pronation group will display significantly greater peak hip adduction and hip adduction excursion than the control group during each task. Research Question 3B: Is there a significant difference in transverse plane hip motion between the pronation and control groups during gait and double-leg and single-leg squatting tasks?
• Hypothesis 3B: The pronation group will display significantly greater hip peak hip internal rotation and hip internal rotation excursion than the control group during each task.
Research Question 4A: Is there a significant difference in mean EMG amplitude of the gluteus maximus between the pronation and control groups during gait and double-leg and single-leg squatting tasks?
• Hypothesis 4B: The pronation group will display significantly lesser mean EMG amplitude of the gluteus medius than the control group during each task.
Research Question 4C: Is there a significant difference in mean EMG amplitude of the hip adductors between the pronation and control groups during gait and double-leg and single-leg squatting tasks?
• Hypothesis 4C: The pronation group will display significantly greater mean EMG amplitude of the hip adductors than the control group during each task.
OPERATIONAL DEFINITIONS
• “Normal” foot posture: score of 0-4 as assessed by the Foot Posture Index (FPI-6) • “Pronated” foot posture: score of 7-9 as assessed by the FPI-6
ASSUMPTIONS
• The Motion Star electromagnetic tracking system captures a valid representation of actual human motion
• The FPI-6 represents a valid measurement of static foot pronation
• The Maximum Voluntary Isometric Contraction (MVIC) normalization task represents a maximal contraction of the targeted muscle
• Subjects will complete all experimental tasks exactly is as if they were performing the tasks in a real-world setting
DELIMITATIONS
10
o Inclusion Criteria
Must be between 18 and 35 years of age
Must be physically active for 30 minutes per day, 2-3 times per week, for the 3 months prior to participation
o Exclusion Criteria
No symptoms resulting from a LE or low back injury within the 3
months prior to participation
No previous history of LE surgery
No symptoms resulting from a neurological disorder for the 3
months prior to participation
No previous history of foot orthotics use
LIMITATIONS
• Conducting experimental testing without shoes in attempt to preserve internal validity limits external validity
• Results are not necessarily generalizable to all types of functional activity • Selected functional activities do not necessarily represent activities where
individuals are most likely to sustain a pronation-related injury
• Results are not necessarily generalizable to individuals with LE injury as the presence of symptoms may cause alterations in movement patterns
SIGNIFICANCE OF STUDY
been validated by research at this time. Excessive foot pronation has also been recognized as a predisposing factor for several common LE injuries. Therefore, this study will be carried out in hopes of 1) gaining an increased understanding of functional LE
CHAPTER II
REVIEW OF THE LITERATURE
DEFINITION OF PRONATION
The concept of foot pronation has existed in academic literature for over 100 years, described as long ago as 1898 as “the vicious weight-bearing position of the foot with the sole flat on the ground…[where] the foot rolls over on to its inner border…and the inner malleolus becomes more apparent.”1 As more research was conducted and a greater understanding attained of foot biomechanics and the underlying anatomy, a more specific definition of pronation – a “rotation in the transverse tarsal joint…in the
direction of a lower [medial longitudinal] arch”2 – was established. The transverse tarsal joint is the anatomical junction between the rearfoot and midfoot, involving the
calcaneocuboid and talonavicular joints.3 The motion described by this rotation creates a more parallel angle between the joint axes of the talonavicular joint and calcaneocuboid joints, allowing for independent motion of forefoot/rearfoot.2 The parallel nature of these axes results in the foot becoming “less rigid” with more potential for translation between joints than in a supinated position.33,41
THE SUBTALAR JOINT
Due to the articulations involved at the transverse tarsal joint, it has been
rearfoot at the subtalar joint.4 Motion that occurs at the subtalar joint is thus imperative for understanding pronation and supination patterns. Motion of the subtalar joint occurs about a unique axis that lies oblique in reference to the axis of the talocrural joint and does not correspond to any of the cardinal planes of motion.5 This is responsible for what has been referred to as a tri-planar motion of the rearfoot.6,7 As pronation is rotation of the transverse tarsal joint that lowers the arch to the ground, it associated with a
combination of simultaneous calcaneal eversion, talar adduction, and talar plantar flexion in the closed kinetic chain.6,7 Likewise, as supination is rotation of the transverse tarsal joint that raises the arch from the ground, it is associated with a simultaneous
combination of calcaneal inversion, talar dorsiflexion, and talar abduction in the closed kinetic chain.6,7
ROLE OF PRONATION
Given the nature of this motion, pronation plays an important role in LE
14
foot.8,9 Because of the orientation of the axis of the subtalar joint, pronation and supination also play an important role in accommodating uneven terrain with minimal interruption to the foot’s role as a coupling to the ground.8
PRONATION AND GAIT
A unique pattern of pronation and supination has been observed during the gait cycle that corresponds to these functions. In a normal gait cycle, the foot initially begins in a slightly supinated position during heel strike, rolls medially into a degree of
pronation during mid-stance, and then re-enters into supination during push-off, to a greater extent than witnessed during heel strike.27,43 Center of pressure measurements have been identified in literature that correspond to these kinematics findings.44 This observed kinematic pattern allows the foot to help the LE absorb ground reaction forces during weight acceptance and then as it moves into a more supinated position during push-off, allows the foot to effectively transmit these forces to produce locomotion.8
NORMAL PRONATION
Because excessive pronation has been identified as a contributing factor to many overuse injuries in the LE, pronation is often erroneously misunderstood as an
unfavorable biomechanical phenomenon. However, pronation is a necessary and
amount of this motion that occurs here, in both laboratory and clinical settings.11 The navicular drop test45 and the Foot Posture Index-6 (FPI-6)46 are believed to be two of the most valid clinical methods for assessing the degree to which an individual pronates. These methods, discussed later at length, respectively define a normal degree of
pronation as less than 10 mm of inferior displacement of the navicular tuberosity between weight bearing and non-weight bearing and a composite score of 0 to 5 on the FPI-6.47
EXCESSIVE PRONATION
While pronation is a naturally occurring motion and necessary phenomenon, many individuals experience excessive pronation, where the foot collapses into excessive dorsiflexion, eversion, and abduction.5 Again, objectively quantifying the exact degree of this motion that occurs has proven difficult, but excessive pronation, almost invariably a subjective measurement in the clinical setting, is easily identified by clinicians. Some prominent visual manifestations may include a flattened or absent medial longitudinal arch, a medial bulge of the foot at the talonavicular joint, an excessive amount of rearfoot eversion, and greater medial shoe wear patterns. Based on normative values, excessive pronation has been defined as greater than 15 mm of inferior displacement on the
16 CAUSES OF EXCESSIVE PRONATION
Many different causes of excessive pronation have been identified in the
literature. One potential cause of excessive pronation is varus structural deformities of the foot.7,48 Forefoot varus may be defined as an inversion of forefoot on a neutral subtalar joint in a non-weight bearing position,7 and appears as the 1st metatarsal resting
superiorly to the 5th metatarsal. In calcaneovarus, or rearfoot varus, the calcaneus, often as well as the forefoot, will appear to be resting in an inverted position.48 Varus structural deformities are most commonly evaluated in a non-weight bearing stance in what is considered “subtalar joint neutral,” where the talar head is theorized to be equally prominent laterally and medially in conjunction with the ankle mortise.49,50 When
individuals with these deformities move into a weight-bearing position, the force of their body weight causes them to compensate by pronating at the subtalar joint in effort to achieve more uniform contact with the ground.41 Pes planus structural deformities of foot, where the medial longitudinal arch is flattened or absent, have also been associated with excessive pronation.41,51 Fatigue of intrinsic dynamic supporting structures of the medial longitudinal arch such as the abductor hallucis, flexor digitorum brevis, and lumbricals has been associated with greater amounts of pronation as well.52
DYNAMIC CONTROL OF PRONATION
have all been demonstrated to create a supination moment about the subtalar joint, with the posterior tibailis exhibiting the largest moment arm.53 However, despite its smaller moment arm, the soleus may prove to play a greater role than the posterior tibialis in controlling foot eversion given its larger cross-sectional area and greater strength.54 The tibialis anterior also plays an important role in eccentrically control pronation given its insertion on the medial aspect of the medial cuneiform and base of the 1st metatarsal which creates an inversion moment.55 Supporting this logic, greater EMG activity of the tibialis anterior and lesser EMG activity of the peroneus longus, a foot everter, has been identified in individuals with lesser medial longitudinal arch height.56 This may also be supported by studies that have identified decreased EMG activity of the tibialis anterior during the use of anti-pronation devices such as foot orthoses57 and taping methods.58
QUANTIFYING PRONATION
As increasing amounts of research were performed concerning pronation and foot biomechanics, a need became apparent for both a valid and reliable means for
18
attached to underlying bones, has further complicated this, especially as most applied research concerning pronation involves some form of functional activity.
Before advancements in kinematic analysis, researchers would observe the pressure distribution across the plantar aspect of foot by standing underneath subject and observing through a piece of glass.59 In more recent studies, methodology measuring the degree of rearfoot eversion exhibited during weight bearing has been implemented in attempt to quantify pronation.5,60-62 Rearfoot eversion may be assessed by calculating the frontal plane angle formed between the tibia and the calcaneus.5 This may be easily assessed statically using goniometry33 or during kinematic analysis using markers or sensors attached to the skin.62 Static measurement of rearfoot eversion has been associated in the literature with dynamic pronation,63 but at the same time, it has also been suggested that it does not accurately reflect dynamic pronation.64
Navicular Drop Test
Another test that has been utilized in attempt to measure pronation is the navicular drop test.45,52,65,66 This test involves measuring the inferior displacement of the navicular between weight-bearing and non-weight bearing positions.45 The navicular drop test is easy to perform and has direct involvement with motion at the transverse tarsal joint due to its anatomical location. The navicular drop test has demonstrated strong correlations with both static and dynamic rearfoot motion.67,68 A correlation has also been
drop, in addition to static rearfoot eversion, is also a poor predictor of dynamic foot pronation.64
Foot Posture Index
The latest research development in attempting to quantify pronation is the Foot Posture Index: FPI-6.46 Unlike other measurements of pronation such as navicular drop and rearfoot eversion, the FPI-6 takes a more comprehensive approach to determine the degree to which an individual pronates, accounting for movement patterns in the forefoot and rearfoot and using measurements from all three cardinal planes of motion. This system incorporates several subjective evaluation points including talar head position, curvature above and below the malleoli, rearfoot inversion/eversion, talonavicular congruence, medial arch height, and forefoot abduction/adduction.46 For each evaluation point, subjects receive an integer value ranging from -2 to 2, with specific criteria determining what constitutes each score.46 The composite score is determined and then a foot posture is assigned that corresponds to this score, with more positive scores
20
EFFECTS OF FOOT PRONATION UP THE KINETIC CHAIN
Foot pronation is believed to be associated with many biomechanical alterations up the kinetic chain. In the closed kinetic chain, as the talus plantar flexes and adducts on the calcaneus at the subtalar joint during pronation, tibial internal rotation must occur as the ankle mortise is obliged to follow the dome of the talus.19-22 Given its direct anatomical role at the tibiofemoral joint, the obligatory tibial motion that occurs during pronation has been theorized to create internal rotation and valgus motion at the knee.15,23-27 Although the knee is a modified hinge joint with potential for some motion in the transverse plane and frontal plane in the closed kinetic chain, some have theorized that the femur also follows the tibia into internal rotation.27,33 This theory has been substantiated by recent literature, with studies showing associations between greater rearfoot eversion and greater hip internal rotation and adduction,22,34 both of these also component motions of knee valgus motion in the closed kinetic chain.23,30
FOOT PRONATION AND HIP MUSCLE ACTIVATION
attempt to control hip internal rotation and adduction. At the same time, greater hip adduction and internal rotation would theoretically alter the length-tension relationships of the gluteal and hip adductor musculature. Due to the fact that lesser neural drive (i.e. EMG activity) is necessary for a given force level when a muscle is in a lengthened position compared to a shortened position,38-40 lengthening of the gluteals attributable to hip internal rotation and adduction may result in lesser gluteal EMG amplitudes while shortening of the hip adductors may result in greater hip adductor EMG amplitudes. Specifically concerning the gluteus maximus and gluteus medius, there may also be interplay between these two mechanisms, with these length-tension principles potentially resulting in lesser EMG activity in these muscles while the need for greater torque to eccentrically control hip internal rotation and adduction may result in greater motor neuron recruitment.
FOOT PRONATION AND LOWER EXTREMITY PATHOLOGY
22
has been prospectively identified as a predisposing factor for ACL injury.28-30 Greater hip internal rotation and adduction are believed to play a large role in the development of patellofemoral pain as this causes the line of pull of the quadriceps to create excessive lateral tracking and contact pressure of the patella on the femur.15,32
SUMMARY
CHAPTER III METHODOLOGY
SUBJECTS
A convenience sample of 50 male and female volunteers was recruited to participate in this study. A sample size of approximately 25 was needed to achieve a power of 0.80, d = 0.86, with this analysis based on differences in transverse plane hip joint angles between a group with neutral rearfoot alignment and a group with 5 degrees of induced rearfoot eversion.34 Subjects were assigned to two groups of equal size based on their scores on the FPI-6.46 Subjects receiving a score of 0 to 4, corresponding to a “normal” foot posture on FPI-6, were placed into the control group. Subjects receiving a score of 7 to 9, corresponding to a “pronated” foot posture on FPI-6 were placed into the control group.
Inclusion/Exclusion Criteria
Subjects were required to meet the following criteria to be eligible for
participation: between 18 and 35 years of age; physically active for at least 30 minutes per day, three times per week for the three months prior to participation; no symptoms resulting from a LE or low back injury within the three months prior to participation; no previous history of LE surgery; and no history of foot orthotics use. Prior to participation, subjects read and signed an informed consent form approved by the Biomedical
24 Screening Session
Testing was conducted over the course of two sessions including a screening session and data collection session, which were separated by no more than two weeks’ time. During the first session, subjects were screened to determine if they met the inclusion criteria. After determining that subjects adequately satisfied the inclusion criteria, subjects had their static foot posture assessed using the FPI-6. Each subject’s height, weight, and age were also recorded along with measurements of femoral
antetorsion and external tibial torsion. All screening procedures and experimental testing were performed on subjects’ dominant leg. Leg dominance was identified by asking subjects which foot they would normally use to kick a soccer ball for distance.76 Based on their score on the FPI-6, subjects were placed in either the “pronation group” or the “control group” or were excluded from participation in the study.
The FPI-6 was used to assess static foot posture. A total of six static foot posture measurements were observed by a trained researcher, the principal investigator, including talar head palpation, curvature superior and inferior to the malleoli, rearfoot
inversion/eversion, talonavicular congruence, medial longitudinal arch height, and
representing foot postures associated with supination. If there was doubt when deciding between two scores, the more conservative score (closer to 0) was used. A detailed description of what constitutes each specific score for each measurement is included in Figure 1. Further information regarding the scoring of this assessment can be found in the FPI-6 user manual.46
After all measurements were completed, the scores from each component were summed. Per identified inclusion/exclusion and grouping criteria, subjects receiving a score of 0 to 4, corresponding to a “normal” foot posture on FPI-6, were assigned to the “control group.” Subjects receiving a score of 7 to 9, corresponding to a “pronated” foot posture on FPI-6 were assigned to the “pronation group”. All included subjects were blinded to their group assignment. Individuals scoring less than 0, indicating a “supinated” or “highly supinated” static foot posture or greater than 9, indicating a “highly pronated” static foot posture, were excluded from the study. This was performed in an effort to preserve the homogeneity of the groups and due to dependence on a convenience sample. Subjects scoring a 5 or 6 on the FPI-6 were also excluded to ensure marked distinction between groups. Previous research has demonstrated high intrarater reliability for the FPI-6 although interrater reliability is not as strong.70 For this reason, the FPI-6 assessment was performed by the same researcher for the entirety of the study.
PROCEDURES
26
pace. Following the warm-up, subjects were fitted with surface electromyography (EMG) electrodes on the gluteus maximus, gluteus medius, and hip adductors according to placement guidelines described below. An EMG unit (Bagnoli-8; Delsys, Inc, Boston, MA) was used to record bioelectrical signals associated with activity of these muscles. Pre-amplified sensors featuring parallel double-bar Ag/AgCl electrodes with an
interelectrode distance of 10 mm, amplification factor of 1,000 (20-450 Hz), and a common mode rejection ratio of 60 Hz (>80 db) were used in this study. EMG data were sampled at a rate of 1,000 Hz.77 After locating where the electrodes will be placed, the area was marked with a permanent marker, shaven clean of hair with an electric razor, abraded with a scouring pad, and then cleansed with isopropyl alcohol. Electrodes were coupled to the skin using a small amount of conductive gel and secured to the skin using an adhesive tape. Electrode placement was confirmed by viewing the EMG activity resulting from contractions of each muscle against manual resistance. Three trials of a five-second maximal voluntary isometric contraction (MVIC) were performed for each of the described manual muscle tests to allow normalization of the EMG data.
• Gluteus Maximus: The electrodes were placed 50% of the distance between the
• Gluteus Medius: The electrodes were placed 50% of the distance from the iliac
crest to the greater trochanter, in the direction of the line from the iliac crest to the greater trochanter.78 Electrode placement was confirmed and MVIC testing was performed by applying pressure directly proximal to the lateral malleolus in the direction of adduction and slight flexion while the hip is abducted to 30° and slightly externally rotated.79
• Hip Adductors: The electrodes were placed on the medial thigh approximately
two cm distal to the pubic bone.80 Electrode placement was confirmed and MVIC testing was performed by having the subject a in side-lying position, with the experimenter supporting the non-test leg in hip abduction while the subject attempted to adduct thigh into resistance applied by the experimenter at the distal thigh.81
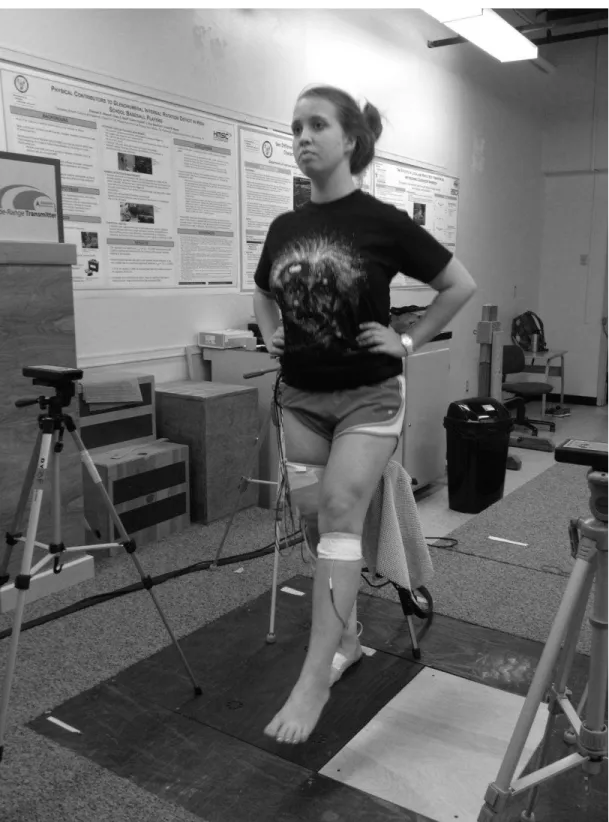
Following MVIC testing, subjects were also fitted with electromagnetic sensors to capture ankle, knee, and hip kinematics. A Motion Star (Ascension Technologies, Inc, Burlington, VT) electromagnetic motion tracking system was used to capture all kinematic data. This system consists of a transducer that creates a spherical
electromagnetic field in which testing is performed. A series of electromagnetic sensors, which create a distortion in this electromagnetic field, are monitored for their three dimensional change in position over time. The world axis system was defined with the positive “X” axis representing forward/sagittal plane motion, the “Y” axis representing frontal plane motion, and the “Z” axis representing vertical/transverse plane motion.
28
using double-sided tape as well as pre-wrap and one and a half inch athletic tape. Sensors located on the foot were secured without pre-wrap using double-sided tape, one and a half inch athletic tape, and two inch elastic tape. Anatomical landmarks were digitized, and changes in segment position were calculated as the motion of distal segments relative to proximal segments with the exception of transverse plane shank motion, which was calculated relative to the rearfoot. Kinematic data were sampled at 100 Hz82 and analyzed using Motion Monitor software (Innovative Sports Training, Inc, Chicago, IL). A
segment-linkage model of the LE was generated by digitizing the medial and lateral malleoli, medial and lateral femoral epicondyles, left and right ASIS, and location of the L5/S1 articulation. The ankle and knee joint center were calculated as the midpoints of the medial and lateral malleoli and medial and lateral femoral epicondyles, respectively.82 The hip joint center was determined using Bell’s method.83
Subjects completed three separate functional tasks during experimental testing. All three tests were completed barefoot to control for potential confounding effects of footwear on foot biomechanics. The order in which the tests were performed was block randomized to control for any potential order effect.
Gait Analysis
for the force plate with the test limb. Gait speed was monitored via infrared timing gates placed one meter apart, with the force plate centered between them. Subjects completed five trials that were used to calculate their mean preferred gait speed followed by five additional trials during which kinematic and EMG data were collected. Thirty seconds were provided between trials. Failure to sufficiently complete the task according to given instructions including only partially stepping on the force plate, failing to walk within ±10% of the mean gait speed assessed during practice trials, stepping on the force plate with the wrong foot, and not completing at least two steps following contact with the force plate were considered grounds for excluding a trial, and performing an additional trial.
Double-Leg and Single-Leg Squat
30
hips and their non-test leg either beside them or in front of them and to not allow it to touch the ground during the trials.
DATA REDUCTION
Motion Monitor software (Innovative Sports Training, Inc, Chicago, IL) was used to collect and process data. Kinematic data were filtered using a 4th order low-pass
Butterworth filter with a cutoff frequency of 10 Hz. Joint angles were interpreted as motion of distal segments relative to proximal segments via Euler angle calculations (YXZ rotation sequence) with the exception of transverse plane shank motion, which was calculated relative to the calcaneus.22,25,84
Custom software developed in LabVIEW (National Instruments, San Antonio, TX) and MATLAB (MathWorks, Natick, MA) was used to derive the dependent
defined as the difference between the values at initiation of the descent phase and the peak value for each motion. Values from each squat were averaged across the five squats from that trial and this mean was averaged across the five trials for each squatting task. Corrected peak rearfoot eversion values were also calculated for all tasks using a “zero” determined from the frontal plane rearfoot angle present at static stance during
digitization of anatomical landmarks as the values yielded by our sensor placement on the posterolateral calcaneus, although precise, did not provide a representation of true frontal plane rearfoot angle.
Raw EMG data were band-pass filtered between 20 and 350 Hz, notch filtered between 59.5 Hz and 60.5 Hz, and smoothed using a root-mean-square sliding window function with a time constant of 20 milliseconds. For EMG data during the gait task, the mean EMG amplitude was calculated over the entire stance phase. For EMG data during both squatting tasks, the mean EMG amplitude was calculated between the initiation of the descent phase and 60° of knee flexion. This mean was averaged across all the squats within a given trial, and this mean was averaged across all trials for each subject. The EMG MVIC normalization values were determined by calculating the mean amplitude over a one-second interval visually identified as stable within each MVIC trial. This mean was then averaged across all three MVIC trials for each subject. EMG
32 STATISTICAL ANALYSIS
All data was analyzed using SPSS 20.0 statistical software. All dependent
CHAPTER IV MANUSCRIPT
INTRODUCTION
Excessive foot pronation is associated with lower extremity (LE) biomechanical alterations which are believed to contribute to a variety of common injuries, including anterior cruciate ligament (ACL) injury, patellofemoral pain syndrome (PFPS), medial tibial stress syndrome (MTSS), Achilles tendinopathy, and plantar fasciitis.12-18 In the closed kinetic chain as the talus plantar flexes and adducts on the calcaneus during pronation, tibial internal rotation occurs as the ankle mortise is obliged to follow the dome of the talus,19-22 also potentially leading to knee valgus motion.15,23-27 This association is important because knee valgus motion has been implicated to play an important role in ACL pathology28-30 and PFPS.15,26,31,32 Though limited transverse and frontal plane knee motion occurs in the closed kinetic chain, it is believed that the femur may also internally rotate and adduct to accommodate this tibial motion,27,33 supported by recent literature that shows associations between greater rearfoot eversion and greater hip internal rotation and adduction,22,34 both of which also contribute to knee valgus
motion.23,30
34
little research has evaluated this influence, and the hypothetical nature of this influence is unclear. The gluteus maximus and gluteus medius play important roles in eccentrically resisting proximal kinematic patterns associated with pronation, while activity of the hip adductors contributes to these unfavorable kinematic patterns.73 Specifically, greater electromyography (EMG) amplitudes may be identified in the gluteals as a compensatory attempt to control hip internal rotation and adduction. At the same time, greater hip adduction and internal rotation would theoretically alter the length-tension relationships of the gluteal and hip adductor musculature. Due to the fact that lesser neural drive (i.e. EMG activity) is necessary for a given force level when a muscle is in a lengthened position compared to a shortened position,38-40 lengthening of the gluteals attributable to hip internal rotation and adduction may result in lesser gluteal EMG amplitudes while shortening of the hip adductors may result in greater hip adductor EMG amplitudes.
There is currently little evidence regarding the influence of foot pronation on hip biomechanics, and we are unaware of any study examining its influence on muscle activation. Tateuchi et al.34 demonstrated that subjects experienced greater hip adduction and internal rotation when a 5° platform that induced greater rearfoot eversion was applied during single-leg standing. However, the changes in rearfoot eversion and hip adduction angles were very small, and rearfoot eversion was increased artificially. Souza et al.22 reported correlations between rearfoot eversion and hip internal rotation and shank and hip internal rotation during gait, but this study only examined transverse plane
medius, and hip adductors) between individuals with “pronated” and “normal” foot postures.
METHODS Subjects
A convenience sample of 50 male and female volunteers was recruited to
participate in this study. A sample size of 25 per group was needed to achieve a power of 0.80 to identify differences in transverse plane hip joint angles between groups.34
Subjects were assigned to two groups of equal size based on their scores on the Foot Posture Index, FPI-6.46 Subjects receiving a score of 0 to 4, corresponding with a
“normal” foot posture, were assigned to the control group. Subjects receiving a score of 7 to 9, corresponding with a “pronated” foot posture were assigned to the pronation group. Subjects scoring a 5 or 6 on the FPI-6 were excluded to ensure distinction between the groups. Subjects scoring greater than a 9 on the FPI-6 were also excluded 1) to preserve homogeneity of the groups and 2) due to our dependence on a convenience sample and potential difficulty in recruiting an adequate number of “highly pronated” individuals to adequately power our study. A detailed description of the FPI-6 assessment is included in Figure 1.46 Testing procedure and scoring were carried out as described by the FPI-6 user manual.46
Subjects were required to meet the following criteria to be eligible for
36
study was approved by the university’s biomedical institutional review board, and subjects provided written informed consent prior to participation.
Screening Session
Testing was conducted over the course of two sessions which were separated by no more than two weeks. During the first session, subjects were screened to confirm that they met the inclusion criteria, after which their static foot posture was assessed using the FPI-6. Based on their score on the FPI-6, subjects were assigned to the pronated group (PRO) or the control group (CON), or were excluded from participation. Subjects were blinded to their group assignment. The same researcher (WL) conducted all screening procedures. All data were obtained from subjects’ dominant leg, which was identified by asking subjects which foot they would normally use to kick a ball for distance.76
Procedures
Prior to data collection, subjects were instructed to warm-up for five minutes on a stationary cycle ergometer at a self-selected pace. Following the warm-up, subjects were fitted with pre-amplified surface EMG electrodes (interelectrode distance = 10 mm, amplification factor = 1,000 (20-450 Hz), common mode rejection ratio @ 60 Hz >80 db) over the gluteus maximus, gluteus medius, and hip adductors which were connected to a base amplifier (Bagnoli-8; Delsys, Inc, Boston, MA) and sampled at 1,000 Hz. Three trials of a five-second maximal voluntary isometric contraction (MVIC) were performed for each muscle (manual muscle tests) to allow for normalization of the EMG data.
posterolateral calcaneus, shank, and thigh of the dominant leg, as well as the sacrum. The world axis system was defined with the positive X axis oriented forward, the positive Y axis oriented leftward, and the positive Z axis oriented upward. A segment-linkage model of the LE was generated by digitizing the medial and lateral malleoli, medial and lateral femoral epicondyles, left and right ASIS, and the L5/S1 articulation. The ankle and knee joint centers were calculated as the midpoints of the medial and lateral malleoli and medial and lateral femoral epicondyles, respectively. The hip joint center was determined as a function of the distance between the digitized anterior superior illiac spines (Bell’s method).83 Kinematic data were then sampled at 100 Hz as subjects completed three separate tasks (gait, double-leg squatting, and single-leg squatting) in a block-randomized order. All tests were completed barefoot to control for potential confounding effects of footwear.
Gait Analysis
38
instructions including only partially stepping on the force plate, failing to walk within ±10% of the mean gait speed assessed during practice trials, stepping on the force plate with the wrong foot, and not completing at least two steps following contact with the force plate were considered grounds for excluding a trial and performing an additional trial.
Double-Leg and Single-Leg Squat
Subjects began by standing with the feet shoulder-width apart and completed a double-leg squat with their arms above their head to a down/down/up/up cadence of 50 beats per minute76 as dictated by a digital metronome. A block (Figure 2) was positioned behind subjects such that it would come into contact with the ischial tuberosity at 80° of knee flexion, and subjects were asked to squat as deeply as they could without coming in contact with the block. Five trials were performed with each trial consisting of five consecutive squats (25 squats total). One minute of rest was provided between trials to reduce the likelihood of fatigue. Subject failure to sufficiently complete the task
according to given instructions, including lifting one foot off the ground, not achieving at least 60° of knee flexion, losing balance, and falling were considered grounds for
excluding that trial and performing an additional trial. Procedures for the single-leg squat were identical to those of the double-leg squat with the exception that subjects were instructed to place their hands on their hips and their non-test leg either beside them or in front of them and to not allow it to touch the ground during the trials.
Data Reduction
Butterworth filter with a cutoff frequency of 10 Hz. Joint angles were interpreted as motion of distal segments relative to proximal segments via Euler angle calculations (YXZ rotation sequence) with the exception of transverse plane shank motion, which was calculated relative to the rearfoot.22,25,84
Custom software developed in LabVIEW (National Instruments, San Antonio, TX) and MATLAB (MathWorks, Natick, MA) was used to derive the dependent
variables. For the gait task, all kinematic dependent variables (peak and excursion values for rearfoot eversion, shank internal rotation, knee valgus, knee internal rotation, hip adduction, and hip internal rotation) were identified during the stance phase of gait, defined as the time from initial ground contact to toe-off and averaged across the five trials. Initial ground contact was identified as the instant the vertical ground reaction force exceeded 10N, and toe-off was identified as the instant the vertical ground reaction force fell below 10N. Excursion values were defined as the difference between the values at initial ground contact and the peak value during stance phase for each motion. For the squatting tasks, these same dependent variables were identified between initiation of the descent phase of the squat and 60° of knee flexion. Initiation of the descent phase was indicated by a direction change in the sagittal plane knee angle. Excursion values were defined as the difference between the values at initiation of the descent phase and the peak value for each motion. Values from each squat were averaged across the five squats from that trial and this mean was averaged across the five trials for each squatting task.
40
mean EMG amplitude was calculated over the entire stance phase. For EMG data during both squatting tasks, the mean EMG amplitude was calculated between the initiation of the descent phase and 60° of knee flexion. This mean was averaged across all the squats within a given trial, and this mean was averaged across all trials for each subject. The EMG MVIC normalization values were determined by calculating the mean amplitude over a one-second interval visually identified as stable within each MVIC trial. This mean was then averaged across all three MVIC trials for each subject. EMG
normalization was performed for all tasks by dividing the EMG amplitude during each task by the mean MVIC normalization value.
Statistical Analysis
All dependent variables were compared between groups via independent samples
t-tests for each experimental task. Statistical significance was established a priori as α≤
0.05.
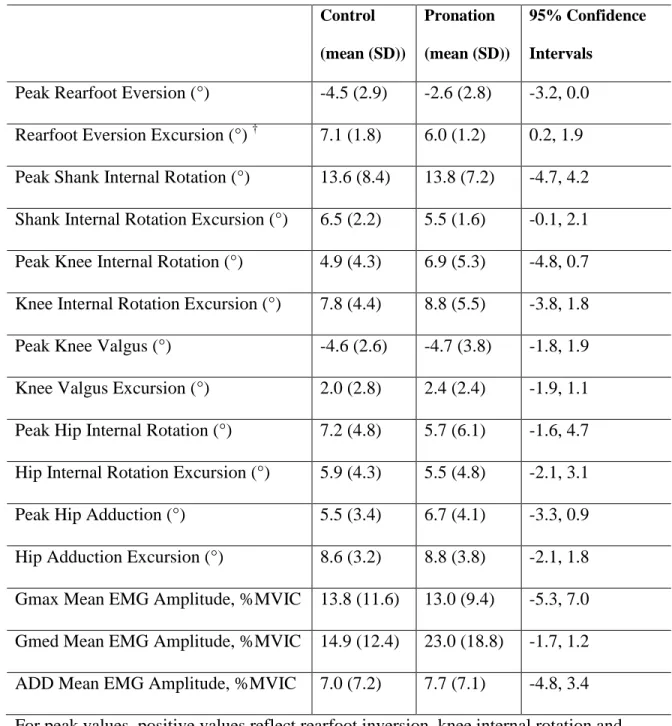
RESULTS Gait
Double-leg Squat
Descriptive statistics for all dependent variables during the double-leg squatting task are summarized in Table 2. No significant differences were noted between groups for any dependent variables during double-leg squatting.
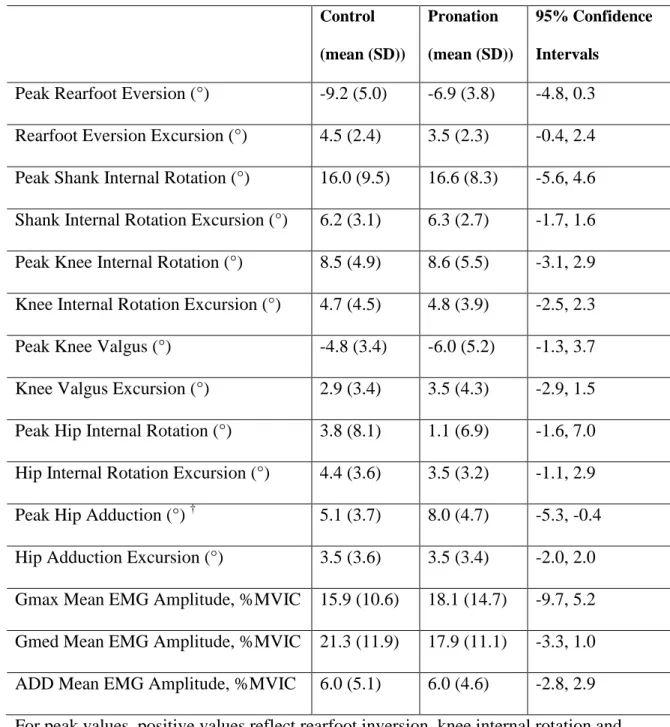
Single-Leg Squat
Descriptive statistics for all dependent variables during the single-leg squat task are summarized in Table 3. The PRO group displayed significantly greater peak hip adduction (t47 = -2.365, p = 0.022) than the CON group. No other significant differences were noted between groups during single-leg squatting.
DISCUSSION
The results of this study indicate that the PRO group demonstrated significantly less rearfoot eversion excursion during gait than the CON group, but did not demonstrate any other significant difference in peak rearfoot eversion angle or rearfoot eversion excursion. These findings are contrary to our research hypotheses that individuals in the PRO group would experience greater peak rearfoot eversion and rearfoot eversion excursion across all tasks, based on previous research that suggests that individuals who experience a greater magnitude of pronation also simultaneously exhibit greater rearfoot eversion.5-7,63 While this significant difference that is contrary to our research hypothesis was observed, it should be noted that the mean difference between groups for this
42
One possible explanation for the greater rearfoot eversion excursion witnessed in the control group during gait is that at heel strike, “pronated” individuals may begin with a greater initial amount of rearfoot eversion and achieve peak rearfoot eversion with less overall excursion than control subjects. However, additional analysis of rearfoot eversion angle at initial ground contact revealed no significant differences between groups (p = 0.520). Considering there was also no significant difference in peak rearfoot eversion during gait, the likely explanation for these paradoxical findings is that the group means for initial and peak rearfoot eversion angles contained a greater amount of variance than those for rearfoot eversion excursion, thus making a smaller difference more easily detectable for rearfoot eversion excursion. Another potential explanation for the lack of greater peak rearfoot eversion in the pronation group concerns the perspective from which rearfoot eversion was calculated. While peak rearfoot eversion with respect to the shank did not differ between groups, it is possible that the rearfoot may have continued to move into greater eversion relative to the world, still creating the appearance of greater pronation with no alteration in rearfoot eversion angle with respect to the shank. However, significant differences in rearfoot eversion relative to the world would have likely altered knee valgus motion due to coupled motion of the calcaneus and shank, which our findings do not substantiate.
difference in peak hip adduction during single-leg squatting. However, there was no significant different in rearfoot eversion or any other variable that give meaning to this finding. This is also contrary to previous literature that has demonstrated an association between greater rearfoot eversion and greater hip adduction although the difference between groups in that study was very small (1.36°) and rearfoot eversion was artificially created using a platform.34 It is possible that this finding may be explained by a
confounding variable that was not accounted for during this study, such as femoral angle of inclination or Q-angle, which could directly influence hip adduction angle during functional activity. Regardless of the source of this difference, it should be noted that the mean difference between groups was 2.9° and carries minimal functional significance.
Given the discrepancy between our findings and previous research that has suggested associations between pronation and shank, knee, and hip kinematics, 15,19-23,27,33,34,41,61
questions are raised concerning the use of the FPI-6 to determine group assignment in this study. The FPI-6 has been demonstrated as a valid assessment of static foot pronation46 and to have high intra-rater reliability but moderate inter-rater
reliability.70 Despite the quantitative nature of the scoring criteria, the assessment relies on a subjective evaluation of characteristics associated with pronation, likely explaining its limited inter-rater reliability. This suggests the potential for ambiguity in classifying individuals based on their static foot postures. As such, this ambiguity poses some threat to the validity of a rater’s assessment as a measure of static foot pronation, which may have been responsible for our groups being less disparate than desired.
44
potentially problematic as a number of variables are introduced during functional activity that may affect pronation. Many functional activities involve stance on a single leg, instantly introducing to that foot at least twice the downward force from body weight that is present to drive pronation that was present during double-leg stance, as in our
assessment of static pronation. This force further increases with any functional activity that involves the transfer of weight to that leg. The FPI-6 is also performed at a state of relative equilibrium while during functional activity, the foot is moving through various ranges of motion to help create/absorb physiologic loading or achieve balance. Because of this, individuals who displayed greater static pronation may have also compensated during functional tasks with heightened muscle activity to prevent an excessive amount of this motion.
Though not central to our hypotheses, to investigate this possibility, we also collected data from the tibialis anterior and soleus, two muscles that assist in dynamically controlling pronation,53,54 to account for this influence. However, EMG amplitudes of these muscles did not differ between groups, lending support to the argument that there was little difference between our groups. We were unable to account for contributions of the tibialis posterior, another important muscle in resisting pronation,53 due to the
Regardless of the source of error, the lack of distinction between groups suggests that the FPI-6 may not be sensitive to detecting changes in dynamic pronation within the grouping parameters used for this study. In the FPI-6 scoring system, 0-5 represents a “normal” static foot posture while 6-9 represent a “pronated” foot posture. These same parameters were used to group subjects except that individuals scoring 5 or 6 were excluded in attempt to create marked distinction between groups. In addition to these scores, an individual may also receive a score of 10-12, representing a “highly pronated” foot posture, a score of -1 to -4, representing a “supinated” foot posture, or a score of -5 to -12, representing a “highly supinated” foot posture. All “supinated” foot postures were excluded as the scope of this study was to compare biomechanical patterns between “pronated” individuals and “normal” individuals. “Highly pronated” individuals were excluded for reasons previously discussed. Although the FPI-6 appears to have limited ability to detect differences in dynamic pronation between individuals with “normal” and “pronated” foot postures, it may discriminate dynamic pronation between more disparate groups such as “normal” and “highly pronated” foot postures. This logic is supported by the findings of an earlier validation study of the Foot Posture Index that found that the assessment may only be sensitive to large-scale differences in static foot pronation.85
46
inversion/eversion component” of the FPI-6 scores revealed significantly greater scores in the PRO group (U = 106.5, p < 0.001), indicating a tendency towards greater rearfoot eversion during static assessment. This discrepancy offers further support to the
previously discussed argument of the problematic nature of the ambiguity created by the subjectivity of the FPI-6 and/or the argument that the FPI-6 may not be indicative of dynamic pronation.
Given the challenges encountered in doing so, previous literature examining the link between foot pronation and LE pathology has employed a wide variety of methods for objectively quantifying pronation including the FPI-6, the navicular drop test, static and dynamic postural observations, static and dynamic foot pressure mapping, and kinematic analysis of dynamic rearfoot motion.12-18,46 Many studies that have examined the relationship between foot pronation and proximal LE kinematics have employed advanced, computer-driven kinematic analysis to investigate correlations between frontal plane rearfoot motion and various LE motions 19,21-25,34. This method is generally
predict previously established LE biomechanical alterations that have been identified as a potential link between these phenomena. This also helps account for the disparity present in the current body of knowledge concerning the influence of “pronation” on LE
pathology.
There are a few additional limitations of this study that should be discussed. The most notable limitation concerns the calculation of peak rearfoot eversion angle during the experiemental tasks, which are corrected values using the frontal plane rearfoot angle present during the digitization of anatomical landmarks as a “zero.” These values were corrected as our sensor placement on the posterolateral aspect of the calcaneus yielded values that, although precise, were not representations of an individual’s true frontal plane rearfoot angle. While this correction offers a more realistic assessment of frontal plane rearfoot angle, it must be noted that this calculation poses some threat to the validity of this measurement as a true zero was not established prior to data collection, (i.e. 5 degrees of rearfoot eversion on individual may be equivalent to 2 degrees of rearfoot eversion on another individual). Despite this limitation, the validity rearfoot eversion excursion values is unaffected, and the mean differences between groups yielded by the corrected peak rearfoot eversion values differed from the mean differences of the original values by less than 1° for all three experimental tasks. Another limitation is that “highly pronated” individuals were excluded from participation. Individuals who
statically display such a degree of pronation may be more likely to experience the
48
Finally, the results of this study are not necessarily generalizable to other types of functional activity, nor do the experimental tasks employed in this study necessarily represent functional activities where individuals have the greatest probability of sustaining a pronation-related injury. Although data from activities such as jogging or jump-landings would provide valuable information, we were limited to choosing experimental tasks that would not be subject to excessive amounts of motion artifact, especially at the foot, which would effectively invalidate our results.
Future research is warranted to continue studying the effects of foot pronation on functional LE biomechanics. This study should be repeated using a different method to group subjects that more accurately reflects differences in dynamic foot pronation. As previous research suggests that foot pronation plays a role in proximal alterations to the kinetic chain, it is critical to ensure marked distinction in foot kinematics between groups before drawing conclusions about the effects on proximal structures. Examining kinetics within the context of the same study design may also be of interest. The findings of such a study are important as they would help scientists and clinicians better understand functional LE biomechanics, allowing for a higher standard of prevention and treatment of common LE pathologies such as ACL injury, PFPS, MTSS, Achilles tendinopathy, plantar fasciitis, and other injuries.
CLINICAL IMPLICATIONS
The results of this study suggest no notable differences in the LE muscle activation and kinematic variables collected between groups of individuals with
providing evidence of lack of a significant relationship between foot pronation and LE muscle activation and kinematics, the widespread absence of notable differences,
especially in rearfoot eversion, suggests there was little to no distinction between groups, and that the FPI-6 is not sensitive to differences in dynamic pronation within the
50 Figure 1 – FPI-6 Reference Sheet46
This assessment should be performed with the subject facing straight ahead in a relaxed stance with equal weight on both legs. It may prove beneficial to ask the subject to march in place several times before completing the assessment to ensure that their weight is equally distributed. The subject should remain completely still while the assessment is performed. A score is given for each of the 6 components below and these scores summed to yield a subject’s composite score. If there is doubt when determining a component score, the more conservative number (closer to 0) should be employed. A composite score of -12 to -5 represents a “highly supinated” foot posture, -4 to -1 a “supinated” foot posture, 0 to 5 a “normal” foot posture, 6 to 9 a “pronated” foot posture, and 10 to 12 a “highly pronated” foot posture.
Rearfoot
Components -2 -1 0 1 2
Talar Head Position
Talar head palpable laterally but not medially Talar head palpable on both sides, but more prominent laterally Talar head equally palpable on both sides Talar head palpable on both sides, but more prominent medially Talar head palpable medially but not laterally Curves Superior/Inferior to the Lateral Malleolus
No curve present inferior to the lateral malleolus, or convex shape Curve inferior to the lateral malleolus is concave but more shallow the curve superior Curves superior and inferior are equal Curve inferior to the lateral malleolus is slightly more concave Curve inferior to the lateral malleolus is markedly more concave than the curve superior Rearfoot Inversion/Eversion Greater than 5 degrees of
rearfoot inversion
Less than 5 degrees of
rearfoot inversion
Vertical
Less than 5 degrees of
rearfoot eversion
Greater than 5 degrees of
rearfoot eversion
Forefoot
Components -2 -1 0 1 2
Talonavicular Bulge
Marked concavity in
area of TNJ
Slight concavity in
area of TNJ
Area of TNJ joint is flat
Area of TNJ bulges slightly
Marked bulge in area of TNJ
Medial Longitudinal Arch Height/Shape Arch is markedly high and acutely angled posteriorly Arch is moderately high and has slightly acute angle posteriorly Normal height and concentrically curved Slightly low arch with flattened appearance Arch is making contact with the ground Forefoot Abduction/Adduction Lateral toes are the only toes visible
Medial toes are slightly more visible,
but lateral toes can still
be seen Medial and lateral toes equally visible Lateral toes are slightly more visible, but medial toes can still
be seen
52 Table 1: Statistical Analyses Table
Question Description Data Source Comparison Method
1 Ankle Kinematics
RQ1A: Is there a significant difference in frontal plane rearfoot motion between PRO
and CON groups?
Frontal plane rearfoot motion (peak and excursion values)
during each functional task
PRO vs CON
Two independent samples t-tests per
task RQ1B: Is there a significant
difference in transverse plane shank motion (relative to rearfoot) between PRO and CON
groups?
Transverse plane shank motion (relative to rearfoot,
peak and excursion values) during each functional task
PRO vs CON
Two independent samples t-tests per
task 2
Knee Kinematics
RQ2A: Is there a significant difference in frontal plane knee
kinematics between PRO and CON groups?
Frontal plane knee motion (peak and excursion values)
during each functional task PRO vs CON
Two independent samples t-tests per
task RQ2B: Is there a significant
difference in transverse plane knee kinematics between PRO
and CON groups?
Transverse plane knee motion (peak and excursion values)
during each functional task PRO vs CON
Two independent samples t-tests per
task 3
Hip Kinematics
RQ3A: Is there a significant difference in frontal plane hip kinematics between PRO and
CON groups?
Frontal plane hip motion (peak and excursion values)
during each functional task PRO vs CON
Two independent samples t-tests per
task RQ3B: Is there a significant
difference in transverse plane hip kinematics between PRO and
CON groups?
Transverse plane hip motion (peak and excursion values)
during each functional task PRO vs CON
Two independent samples t-tests per
task 4
Muscle Activity
RQ4A: Is there a significant difference in mean EMG amplitude of the gluteus maximus between PRO and
CON groups?
Mean EMG amplitude of the gluteus maximus during each
functional task
PRO vs CON
One independent samples t-test per
task RQ4B: Is there a significant
difference in mean EMG amplitude of the gluteus medius between PRO and CON groups?
Mean EMG amplitude of the gluteus medius during each
functional task
PRO vs CON
One independent samples t-test per
task RQ4C: Is there a significant
difference in mean EMG amplitude of the hip adductors between PRO and CON groups?
Mean EMG amplitude of the hip adductors during each
functional task PRO vs CON
One independent samples t-test per
Table 2 – Descriptive statistics for all dependent variables during gait Control
(mean (SD))
Pronation
(mean (SD))
95% Confidence
Intervals
54
Table 3 – Descriptive statistics for all dependent variables during double-leg squatting Control
(mean (SD))
Pronation
(mean (SD))
95% Confidence
Intervals
Table 4 – Descriptive statistics for all dependent variables during single-leg squatting Control
(mean (SD))
Pronation
(mean (SD))
95% Confidence
Intervals
56
REFERENCES
1. Lovett RW, Cotton FJ. Pronation of the Foot, considered from an
Anatomical Standpoint. Journal. Boston Society of Medical Sciences. Apr 1898;2(9):155-161.
2. Elftman H. The transverse tarsal joint and its control. Clinical orthopaedics. 1960;16:41-46.
3. Bojsen-Moller F. Calcaneocuboid joint and stability of the longitudinal arch of the foot at high and low gear push off. Journal of anatomy. Aug
1979;129(Pt 1):165-176.
4. Manter J. Movements of the Subtalar and Transverse Tarsal Joints. The Anatomical record. 1941;80(4).
5. Rockar PA, Jr. The subtalar joint: anatomy and joint motion. The Journal of orthopaedic and sports physical therapy. Jun 1995;21(6):361-372.
6. Root ML OW, Weed JH. Biomechanical Examination of the Foot. Los Angelos, CA: Clinical Biomechanics Corporation; 1971.
7. Root ML OW, Weed JH. Normal and Abnormal Function of the Foot. Los Angelos, CA: Clinical Biomechanics Corporation; 1977.
8. Brown LP, Yavorsky P. Locomotor biomechanics and pathomechanics: a review. The Journal of orthopaedic and sports physical therapy. 1987;9(1):3-10.
9. Morris JM. Biomechanics of the foot and ankle. Clinical orthopaedics and related research. Jan-Feb 1977(122):10-17.