Trends in racial/ethnic and income disparities in foods and beverages
consumed and purchased from stores among US households with
children, 2000–2013
1,2Shu Wen Ng,* Jennifer M Poti, and Barry M Popkin
Department of Nutrition, Gillings School of Global Public Health, University of North Carolina at Chapel Hill, Chapel Hill, NC
ABSTRACT
Background:It is unclear whether racial/ethnic and income differ-ences in foods and beverages obtained from stores contribute to disparities in caloric intake over time.
Objective:We sought to determine whether there are disparities in calories obtained from store-bought consumer packaged goods (CPGs), whether brands (name brands compared with private la-bels) matter, and if disparities have changed over time.
Design:We used NHANES individual dietary intake data among households with children along with the Nielsen Homescan data on CPG purchases among households with children. With NHANES, we compared survey-weighted energy intakes for 2003–2006 and 2009–2012 from store and nonstore sources by race/ethnicity [non-Hispanic whites (NHWs), non-Hispanic blacks (NHBs), and Hispanic Mexican-Americans) and income [#185% federal poverty line (FPL), 186–400% FPL, and.400% FPL]. With the Nielsen data, we compared 2000–2013 trends in calories pur-chased from CPGs (obtained from stores) across brands by race/ ethnicity (NHW, NHB, and Hispanic) and income. We conducted random-effect models to derive adjusted trends and differences in calories purchased (708,175 observations from 64,709 unique households) and tested whether trends were heterogeneous by race/ethnicity or income.
Results:Store-bought foods and beverages represented the largest component of dietary intake, with greater decreases in energy in-takes in nonstore sources for foods and in store sources for bever-ages. Beverages from stores consistently decreased in all subpopulations. However, in adjusted models, reductions in CPG calories purchased in 2009–2012 were slower for NHB and low-income households than for NHW and high-income households, respectively. The de-cline in calories from name-brand food purchases was slower among NHB, Hispanic, and lowest-income households. NHW and high-income households had the highest absolute calories pur-chased in 2000.
Conclusions:Across 2 large data sources, we found decreases in intake and purchases of beverages from stores across racial/ethnic and income groups. However, potentially beneficial reductions in calories purchased were more pronounced in some subgroups over others. Am J Clin Nutr2016;104:750–9.
Keywords: calories purchased, children, disparities, energy in-take, socio-economic
INTRODUCTION
Since the early 2000s, per capita intake and purchases of food and beverage calories have declined with greater relative declines in beverage calories than food calories, particularly among households with children (1–3). Examination of potential racial/ ethnic differences in energy intake among US children has found that the differences are not consistently significant (3). However, other studies have described racial/ethnic or income disparities in consumption of food away from home (FAFH)3 (4, 5). In par-ticular, being black and having lower education have been as-sociated with higher intake of fast food, which may contribute to diet-related health disparities (4–7). Nonetheless, energy intake from FAFH locations has decreased since 2003 across all racial/ ethnic and income subpopulations (5, 8, 9).
Besides FAFH, store-bought foods are the main contributor of energy. Earlier studies show that energy intake from stores fell between 2003 and 2010 among US children (1, 9). Yet it remains unknown whether racial/ethnic or income differences in store-bought foods and beverages also contribute to disparities in energy intake. One study found no differences in intake in foods obtained from stores among US adults across racial/ethnic groups, but the use of pooled data from 2003 to 2008 to obtain sufficient sample sizes for the racial/ethnic groups may mask important trend differences (6). Meanwhile, past investigations into caloric contributions from store purchases have focused on the consumer packaged goods (CPGs) segment. These include evaluations of the Healthy Weight Commitment Foundation (HWCF) marketplace pledge
1Supported by funds from the Robert Wood Johnson Foundation (grants
67506, 68793, 70017, and 71837), the NIH (grants R01DK098072 and R01DK56350), and the Carolina Population Center (grant P2C HD050924).
2Supplemental Data Sources, Supplemental Figures 1–7, and
Supplemen-tal Tables 1–4 are available from the “Online Supporting Material” link in the online posting of the article and from the same link in the online table of contents at http://ajcn.nutrition.org.
*To whom correspondence should be addressed. E-mail: shuwen@unc. edu.
Received November 24, 2015. Accepted for publication June 21, 2016. First published online August 3, 2016; doi: 10.3945/ajcn.115.127944.
3
Abbreviations used: CPG, consumer packaged goods (foods and bever-ages sector); FAFH, food away from home; FPL, federal poverty line; HWCF, Healthy Weight Commitment Foundation; NB, name brand; NHB, non-Hispanic black; NHW, non-Hispanic white; PL, private label.
made by a group of 16 major global food companies (10, 11), which found differential reductions by brand and food or beverage categories. Another analysis of dietary intake and food purchase data until 2010 and 2011, respectively, suggests that there is a plateauing of the calories purchased, especially among black and Hispanic households with children, even after controlling for economic factors (1). Concurrently, research shows shifts in consumer demand toward private-label (PL) products and that the promotion/marketing, and hence popularity of PLs, can vary depending on store type and demographic makeup of customers (12). Nutritionally, there is little evidence of significant or consistent differences in macronutrient profiles of PLs compared with name brands (NBs), at least from studies outside of the United States (13–17). However, there has yet been a study to elucidate whether and how CPG purchases across brands may vary by racial/ethnic or income subgroups over time.
This article seeks to assess the trends in racial/ethnic and income disparities in calories consumed and purchased in US households with children by using data sources on dietary intake and household purchases. It investigates the roles of source (store/home compared with nonstore/away-from-home, hence store compared with nonstore) and whether changes in one source are being offset by another and by brands (HWCF NB, non-HWCF NB, and PL) among CPG purchases from stores. Our focus is to determine whether there are statistically and mean-ingfully significant differences by racial/ethnic and income subgroups and whether these differences (if any) are widening or narrowing. The findings can shed light on whether improvements are limited to specific subpopulations.
METHODS
We used a combination of both individual dietary intake data from 24-h recalls broken down by the location from which food and beverage items were obtained (store compared with non-store), and household purchase data for CPG food and beverage purchases from stores. To maximize comparability, the samples used are representative of individuals living in households with any child in both data sources.Table 1describes the differences
across the 2 data sources in terms of sample representativeness, data captured, and potential sources of measurement error.
Dietary intake by US children and adults from households with children
We used nationally representative surveys of children and adults residing in households with any child with complete data on age, race/ethnicity, and household income from What We Eat In America, the dietary intake interview section of NHANES 2003– 2004 and 2005–2006 (n= 6943 children and 3610 adults), and 2009–2010 and 2011–2012 (n= 5557 children and 3985 adults). The surveys were multistage, stratified-area probability sam-ples of the US civilian noninstitutionalized population. A com-plete description of the complex sampling design and data collection methodology is available elsewhere (18). Briefly, cross-sectional surveys are conducted in 2-y cycles and include individual and family-level interviews. Survey cycles were combined (2003–2004 with 2005–2006 and 2009–2010 with 2011–2012) to increase sample size within racial/ethnic and income subgroups and thereby produce estimates with greater statistical reliability, as recommended by survey administrators, as well as to ensure balanced periods of data for comparison over time. Our study included children aged 2–18 y and adults residing in households with children aged,18 y. In 2011–2012, we identified adults from households with children directly from demographic information about the number of children in the household reported during the family interview. Because this detailed household composition was not reported in the de-mographic information for 2003–2004 through 2009–2010, we included adults from households with children as identified by NHANES when determining eligibility to complete the food security questionnaire for households with children.
Two 24-h dietary recalls were collected by using the USDA’s Automated Multiple-Pass Method by trained interviewers, the first conducted in person and the second 3–10 d later by phone. Recalls for children aged,6 y were completed by a proxy re-spondent, and recalls for children aged 6–11 y were proxy-assisted. Nutrient information for each reported food or beverage
TABLE 1
Description of differences between What We Eat in America–NHANES and the Homescan panel1
What We Eat in America, diet component of NHANES Nielsen Homescan Panel
Years of data used 2003–2006
2009–2012
2000–2013
Sample representation Nationally representative sample of US residents aged.2 y Large panel of US households from 48 contiguous states across 76 metropolitan and nonmetropolitan areas Levels of measurement Individual
Dietary intake on foods and beverages consumed One 24-h recall
Household
Purchases of CPGs
Every reported shopping episode Nutrient information linked to Year or wave-specific USDA Food and Nutrient
Database for Dietary Surveys
Year-specific Nutrition Facts Label information from various sources
Potential source of
underreporting or missing data
Social desirability (underreporting of less-healthy consumption) Forgotten foods
Portion size estimation
Nonpackaged foods (e.g., random-weight meats, store-prepared ready-to-eat or ready-to-eat foods, loose fruits or vegetables)
On-the-go packaged foods that are unreported because of quick consumption
Social desirability (underreporting of less-healthy purchases) Potential source of overreporting Social desirability (overreporting of healthier consumption)
Portion size estimation
Food waste Spoilage
1
was determined from the USDA’s Food and Nutrition Database for Dietary Studies versions 2.0 (2003–2004), 3.0 (2005–2006), 5.0 (2009–2010), and 2011–2012. As recommended by NHANES analytic guidelines, we used only the first day of recall to generate group mean intake (19).
For each recalled food or beverage, respondents reported the location from which the item was obtained; for items that came from the participant’s home food supply and were originally purchased from a retail food store, the location of purchase was recorded as store. We classified each item by source as store or nonstore to more appropriately compare dietary intake with the CPG purchase data for retail food stores. Foods and beverages that came from a store were obtained from grocery stores, su-permarkets, convenience stores, or drug stores and were pre-pared either at the store or in the home. Foods and beverages obtained from fast food, restaurants, schools, vending machines, food/ice cream trucks, at someone else’s home, from other people, and from all other miscellaneous sources were termed nonstore. Individuals were excluded if they were missing in-formation on food source for any calorie-containing item (n = 240) or missing information about the presence of children in the household (n= 143 adults).
Mean daily energy intake from foods and from beverages were estimated for the pooled 2003–2006 and 2009–2012 samples. Nationally representative estimates were obtained by using survey commands within Stata (StataCorp LP) to take into ac-count complex survey design and dietary sample weights, which account for differential probabilities of selection, nonresponse, and noncoverage. For food intake and beverage intake (kcal/d) from all sources, from stores, and from nonstore sources, dif-ferences were examined by race/ethnicity [non-Hispanic whites (NHWs), non-Hispanic blacks (NHBs), and Mexican Ameri-cans] and by household income [categorized on the basis of the gross federal poverty level (FPL) as#185% FPL (low income), 186–400% FPL (middle income), and .400% FPL (high in-come)]. Intake by Mexican Americans, rather than all Hispanics, was analyzed because What We Eat In America–NHANES first adequately surveyed all Hispanics in 2007–2010 (20). Differ-ences across subpopulations within a given year and changes across time (comparing 2009–2012 with 2003–2006) within each subpopulation were compared by using 2-sided paired t tests with P, 0.05 after Bonferroni correction for multiple comparisons considered significant.
Food and beverage purchases by US households with children
Although the dietary intake data provide useful information about individual level intakes by race/ethnicity and household income for those aged$2 y, the need to combine 2 waves (4 y) of NHANES because of small sample sizes within sub-populations limits our ability to understand trends. In addition, the NHANES data are limited in their ability to distinguish the contribution of NBs compared with PL products to US diets and how they may have changed over time by the various subgroups. To handle these issues, we used the 2000–2013 Nielsen Homescan purchase data (21) to measure changes in CPG food and beverage purchases from stores. These data miss informa-tion about the purchases of items without barcodes, such as loose fruit and vegetables, cut-to-order meats or cheeses, and
bulk grains or nuts. A detailed review of these data sources is provided elsewhere (11, 22) and under Supplemental Data Sources,Supplemental Table 1,andSupplemental Figure 1. Identification of HWCF products was based on information in 2013 on the brand and manufacturer of each barcode provided by Nielsen Homescan following the approach described in an earlier evaluation (11). The CPGs were hence mutually exclu-sively categorized as HWCF NB, non-HWCF NB, and PL.
Household food and beverage CPG purchase statistical analyses
The 2000–2013 Nielsen Homescan household CPG food and beverage purchase data were used to estimate trends in calories purchased per capita per day among US households with chil-dren (64,709 unique households). Using household sampling weights, we present the crude weighted but unadjusted 2000– 2013 trends in calories purchased from CPGs by racial/ethnic and household income groups. The outcomes of interest were calories from CPG foods and from CPG beverages purchased per capita per day and purchases by brand category (CPG cal-ories purchased from HWCF NB products, from non-HWCF NB products, and from PL products per capita per day).
Because of the panel nature of these data and the longer period of time reflected, models adjusted for changes in the US socio-demographic composition, market-level unemployment rates (as a measure of macroeconomic condition), and food prices were used to estimate the number of calories purchased in the absence of changes in these factors over the 14-y period. Maximum likelihood random-effect models (a form of multilevel modeling) with clustering at the household level were used to derive the model-adjusted trends in CPG calories purchased by the sample of households with children aged 2–18 y in 2000–2013, (708,175 household-quarter observations from 64,709 unique house-holds). Details on the variables and modeling specifications are available under “Household CPG food and beverage purchase modeling” in the Supplemental Data Sources. Briefly, the models adjust for household-level variables, such as the number of household members in each sex and age group category, the educational attainment of the head of household, race/ethnicity of the head of household, and household income (based on FPL). We also controlled for market- and quarter-specific un-employment rates in which a household resides and market- and quarter-specific real prices (using the value of a US dollar in the first quarter of 2000 in Los Angeles as the base) of products across food or beverage categories. Market dummies were in-cluded to control for time invariant endogeneity because of unobservables at the market level that affect both market- and individual-level decisions, quarter dummies addressed seasonality in purchases, and year dummies captured secular trends.
We did this by deriving changes in calories purchased per capita per day over the 2003–2006 period compared with the 2009– 2012 period assuming linear trends. We broke this down by racial/ethnic groups and by income groups for foods and bev-erages from each brand category.
All analyses for both data sources were conducted in 2015 by using Stata, version 14 (23).
RESULTS
Unadjusted calories consumed from store compared with nonstore sources among Americans residing in households with children
Energy intake from store-bought foods did not significantly change between 2003–2006 and 2009–2012 for any racial/ethnic group (Figure 1); however, per capita intake from nonstore sources decreased slightly among NHBs (237 kcal/d,P= 0.3) and significantly for NHWs (276 kcal/d,P= 0.01). Meanwhile, per capita energy intake from store-bought beverages signifi-cantly decreased across time for all racial/ethnic groups, par-ticularly among Mexican Americans (272 kcal/d,P,0.001); no significant changes occurred in beverage intake from non-store sources. In 2009–2012, there were no significant differ-ences in energy intake from store-bought foods or beverages across racial/ethnic groups.
Differences in energy intake from foods between 2003–2006 and 2009–2012 were not statistically significant for any income groups regardless of the source (Figure 2). Consistent with patterns across racial/ethnic groups, per capita energy intake from store-bought beverages significantly decreased during this time span for all income groups (low income:249 kcal/d,P, 0.001; middle income: 254 kcal/d, P = 0.001; high income:
242 kcal/d, P = 0.004), with no changes in beverages from nonstore sources. At both time points, participants from low-income households had significantly greater energy intake from store-bought beverages than other income groups. In Supplemental Figures 2–5, we present the results among US children aged 2–18 y and among US adults aged$19 y from households with children to show how reductions from store-obtained beverages among children are the most notable and occurred across all racial/ethnic groups and incomes.
Unadjusted trends in calories purchased by brand categories
The contribution of each of the 3 brand categories for CPG food and beverage calories purchased over time are shown in
Table 2. We found that in general the caloric share of HWCF foods and beverages fell over time, particularly in more recent years, while the caloric share of PLs rose over time. Unadjusted trends (seeSupplemental Figures 6 and 7) and between-group
FIGURE 1 Daily energy intake from stores and nonstore sources of foods (A) and beverages (B) by race/ethnicity among US children and adults from households with children. Data are from 20,095 children and adults from households with children aged,18 y participating in NHANES 2003–2006 and 2009–2012. Values are mean per capita energy intake from stores and from nonstore sources (fast food, restaurant food, schools, vending machines, etc.) reported on the first day of 24-h dietary recall. All values are weighted to be nationally representative and account for complex survey design. Results not shown for participants reporting other races or Hispanic origin other than Mexican.>,y,zMean total energy intake, intake from stores, and intake from nonstore sources were compared across racial/ethnic groups for the specified survey year by using pairwisettests withP,0.05 after Bonferroni correction for multiple comparisons considered statistically significant.>NHW and NHB are significantly different.yNHW and MexAm are significantly different. zNHB and MexAm are significantly different. *Mean total energy intake, intake from stores, or intake from nonstore sources was significantly different in
differences were generally consistent for the unadjusted and adjusted results, so we focused on the modeled estimates.
Model-adjusted trends in calories purchased by brand categories
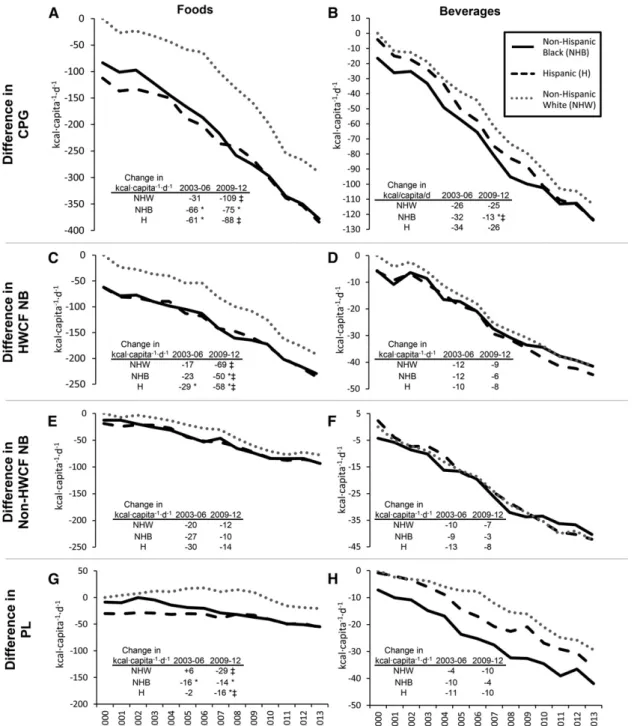
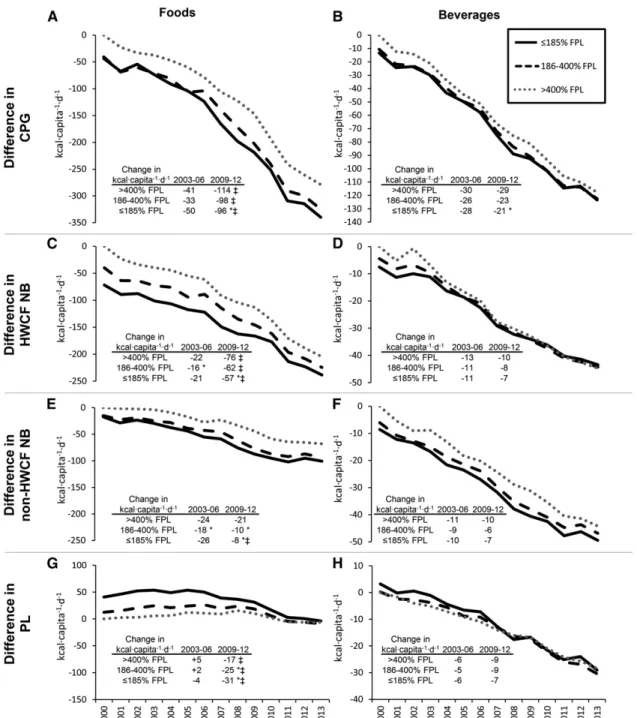
The estimates from the maximum likelihood random-effect models for total CPG calories are shown inSupplemental Table 2. To aid with interpretability, we predicted the adjusted outcomes for each year for the racial/ethnic groups (Figure 3) relative to NHW households in 2000 and household income groups (Figure 4) relative to high-income households at.400% FPL.
Across all racial/ethnic groups and holding all else con-stant, CPG purchases were lower than they were for NHW households in 2000. However, among CPG food purchases, the rate of decline varied by race/ethnicity and over time. NHB and Hispanic households had a higher rate of decline than NHW households did in 2003–2006. However, this ac-celerated in 2009–2012 for both NHW and Hispanic house-holds but did not change significantly for NHB househouse-holds. Moreover, in 2009–2012, the absolute decline in total food calories purchased was significantly lower for NHB than for NHW households.
When looking at brand categories of CPG foods purchased, we see that HWCF foods in particular had larger absolute declines in 2009–2012 than in 2003–2006 across all racial/ethnic groups, but NHB and Hispanic households had significantly lower rates
of decline in 2009–2012 than NHW households did. The de-clines in non-HWCF NB foods were consistent over time and not significantly different by race/ethnicity. Meanwhile, PL foods had higher declines in 2009–2012 among NHW and Hispanic households but little change among NHB households compared with 2003–2006.
Among CPG beverages, the decline in calories purchased by NHB households stalled in 2009–2012 relative to 2003–2006 and became significantly less than the continued reductions by NHW house-holds. For each brand, the reductions in calories purchased over time by racial/ethnic groups were generally not statistically different.
In model-adjusted comparison of changes in CPG purchases by income and holding all else constant, packaged food and beverage purchases by high-income households appeared to be the highest throughout 2000–2013. Reductions in CPG food purchases were greater in 2009–2012 than in 2003–2006, but low-income households fell the least, whereas the high-income households had the highest reductions in 2009–2012. This acceleration in 2009–2012 was largely driven by reductions in food calories purchased from HWCF brands for all income groups. Meanwhile, low-income households had the highest absolute calories from PLs in 2000, and the largest decline in PL foods compared with the other income groups over time. Low-income households also had the lowest absolute calories from HWCF foods in 2000 and the lowest decline for HWCF and non-HWCF NB foods in 2009– 2012. Also of note is that low-income households had the lowest
absolute calories from beverages, with significantly lower re-ductions in beverage purchases than high-income households had in 2009–2012, although the differences were small in magnitude.
DISCUSSION
Disparities in calories from foods and beverages among households with children are nuanced, source- and brand-specific, and evolving over time. Across 2 large-scale data sources, we consistently found substantial decreases in intake and pur-chases of beverages from stores among all racial/ethnic and income groups. Moreover, we found that these decreases in calorie intake from store-bought beverages were not offset by increases in nonstore intake between 2003 and 2012, confirming
that stores may be contributing to overall declines in energy intake. In addition, model-adjusted comparisons of changes in CPG purchases by race/ethnicity and income reveal evidence of disparities in calories purchased, because NHW and high-income households had the steepest declines in both food and beverage purchases over time. Our results suggest that potentially beneficial reductions in calories purchased, par-ticularly between 2009 and 2012, were slower for NHB and low-income households than for NHW and high-income house-holds, respectively.
The finding that NHW and high-income households had higher caloric purchases are not consistent with the NHANES findings on intake, but this may be due to food waste (24), which might vary across subpopulations, and it is possible that NHB, Hispanic, and
TABLE 2
Proportion of weighted-unadjusted calories purchased from brand categories among households with children by race/ ethnicity and income for select years1
Subpopulation
CPG food calories by brand, % CPG beverage calories by brand, %
HWCF non-HWCF PL HWCF non-HWCF PL
Non-Hispanic white
2000 43.8 32.8 23.4 32.2 32.8 35.0
2003 42.0 33.1 24.9 33.3 32.2 34.5
2006 41.3 32.5 26.2z 31.0 31.2 37.8z
2009 39.1z 32.0 28.9z 28.5z 32.5 39.0z
2012 36.6z 34.8z 28.6z 27.0z 32.8 40.2z
Hispanic
2000 41.2 36.8* 22.0 29.3* 36.6* 34.1
2003 39.5 37.0* 23.4 31.7z 33.2 35.2
2006 39.1 36.0 24.9z 31.0 32.3z 36.7z
2009 37.2z 36.1* 26.7z 27.3 33.9 38.8z
2012 35.2z 38.5 26.4z 26.5z 36.6* 37.0*z
Non-Hispanic black
2000 40.7* 34.9 24.4 33.7 34.4 32.0
2003 38.8* 35.0 26.3 34.1 34.0 31.9*
2006 40.1 33.7 26.1 33.4* 35.1* 31.4*
2009 37.9z 35.1 27.0z 29.7z 36.9*z 33.4*
2012 36.0z 36.9 27.0z 30.5*z 38.1*z 31.4*
#185% FPL
2000 38.8* 32.8 28.3* 30.8 31.5* 37.6*
2003 35.9* 33.6 30.5*z 31.7 31.6* 36.8*
2006 36.7* 32.3 31.0*z 31.3 30.5* 38.2*
2009 35.6*z 32.1 32.3*z 29.4 30.9* 39.7*z
2012 34.5*z 35.2z 30.3* 29.0* 32.8* 38.1
186–400% FPL
2000 43.5 33.5 22.9* 32.3 33.2 34.5
2003 41.5 33.8 24.7* 33.6 31.9 34.5
2006 41.3 33.3 25.4*z 31.6 31.5 37.0*z
2009 39.3z 32.9 27.8*z 27.9z 32.7* 39.3*z
2012 36.8z 35.6z 27.6*z 26.2z 34.4z 39.4z
.400% FPL
2000 47.3 34.6 18.1 32.5 36.3 31.1
2003 45.2 34.7 20.0 33.8 34.6 31.6
2006 44.9z 34.5 20.6z 31.3 34.9 33.8z
2009 41.7z 35.2 23.1z 27.9z 38.5z 33.5z
2012 38.1z 37.5z 24.4z 26.0z 36.4 37.6z
1The 2000–2013 Nielsen sample size = 708,175 quarter observations representing 2,146,375,933
low-income households waste less food than NHW and higher-income households do. However, there have been no studies on racial/ethnic- or income-specific food wastage to date (25, 26).
Meanwhile, studies on food marketing toward children suggest that the food industry may be marketing certain NB products more heavily toward NHB and lower-income areas (27–30) or marketing nutritionally poor food products toward Spanish-speaking children (31), affecting their food culture (32). This
might encourage brand loyalty and could explain the slower decline among NHB, Hispanic, and lowest-income households over time for HWCF and other NB foods. Concurrently, al-though CPG manufacturers and retailers purport to be re-formulating their products to be “better-for-you” (33), these products tend to be more expensive (34, 35), less marketed to-ward lower income households, and thus less purchased by these households. It is also unclear if reformulations are necessarily
occurring in the most important categories of CPG foods. Among grabased desserts, a major contributor to energy in-take for children (36), research has showed no noticeable re-formulation between 2005 and 2012 (37). Meanwhile, among sugar-sweetened beverages there is some evidence of growth in the lower-calorie options (38, 39), which is also evident in the caloric reductions from beverages found in this study. However, what is still unknown and requires additional analysis is to what
extent these reductions in beverage calories are due to con-sumers’ behavioral change, reformulations by beverage manu-facturers, and/or retailers stocking lower-calorie beverages.
There are multiple pathways that can lead to disparities in food purchases, diet, and health, ranging from broader contextual forces to individual-level behavioral choices (40). Although parents or caregivers are the primary purchasers of foods for households, children’s preferences can drive purchasing decisions
and shopping behavior (41, 42). Children’s food preferences have been found to be highly susceptible to branding and marketing strategies (43, 44) and are highly associated with dietary prefer-ences and health outcomes later in life (45). Consequently, efforts to limit disparities in diet and health need to begin in childhood. A main limitation of our analysis of dietary intake is the use of self-reported data, because systematic misreporting of energy intake has been consistently shown and may be associated with race/ethnicity and income (46, 47). Because NHANES does not consistently collect detailed information about brands of products consumed by respondents, it is not possible to determine how changes in purchases for different brand categories across various subpopulations relate to diet and health outcomes. NHANES also does not capture many of the product reformulations ongoing in the CPG sector (48). However, this article shows that store-bought foods and beverages are large contributors of calories consumed. We are in the process of completing linkage of the barcodes for every CPG food and beverage available since 2007 with the USDA data used in NHANES from 2007–2008 through 2011–2012 (48). Among other important research questions, this will allow us to assess the associations between the food industry and retailer pledges and their widely varying reformulations with measured changes in US diets, particularly those of children in lower-income and racial/ethnic populations at greatest risk of childhood obesity.
A second critical issue is that of food waste as mentioned earlier (24), which suggests that reductions in calories consumed may not be as large as found in the reductions in calories sold or purchased (49). Last, this study focuses on calories because of their direct relation with obesity and does not look at other nutrients of concern, particularly excess consumption of solid fats, added sugars, refined carbohydrates, and sodium (9, 50). Nonetheless, the overall improvements in terms of calories found in this article are in line much of the research that has documented a plateauing of obesity prevalence across most age, racial/ethnic, and so-cioeconomic subpopulations (51, 52). Future work needs to explore the role of CPGs and brand categories in contributing to the various nutrient intakes and health status of children and vulnerable subpopulations.
As we and others have shown, energy intakes across all racial/ ethnic groups have declined over the past 14 y. These declines were greater in nonstore sources for food and greater in store-sources for beverages. For store purchases, NHW and high-income households started with the highest absolute calories purchased in 2000 and had the greatest reduction in CPG calories purchased from 2000 to 2013. There was also a slower decline among NHB, Hispanic, and lowest-income households over time for HWCF and other branded foods than in NHW and high-income households, respectively. Jointly, these results suggest overall improvements but greater improvements in diet for NHW and higher-income households. The health implications of these dietary shifts remain unexplored except for the presumed pla-teauing of obesity among most age, gender, and racial/ethnic subpopulations.
We thank Donna Miles, Kuo-Ping Li, and Phil Bardsley for exceptional data management and programming support; Jessica Davis, Bridget Hollings-worth, Julie Wandell, and Emily Ford Yoon for excellent research assistance; and Denise Ammons for graphics assistance.
The authors’ responsibilities were as follows—SWN and JMP: conducted the research and analyzed the data; SWN: had primary responsibility for the
final content; and all authors: designed the research, wrote the manuscript, and read and approved the final manuscript. BMP has been a co-investigator of one randomized controlled trial funded by Nestlé’s Water USA but has never consulted for them. BMP had a contract with Kraft to cofund the dietary intake portion of the National Nutrition and Health Survey conducted in Mexico by the National Institute of Public Health, Mexico. The other authors reported no conflict of interest related to this study. The funders had no direct role in this study.
REFERENCES
1. Ng SW, Slining MM, Popkin BM. Turning point for US diets? Re-cessionary effects or behavioral shifts in foods purchased and con-sumed. Am J Clin Nutr 2014;99:609–16.
2. Ervin R, Ogden C. NCHS data brief 113: trends in intake of energy and macronutrients in children and adolescents from 1999–2000 through 2009–2010. Atlanta (GA): Centers for Disease Control and Prevention; 2013.
3. Mendez MA, Sotres-Alvarez D, Miles DR, Slining MM, Popkin BM. Shifts in the recent distribution of energy intake among U.S. children aged 2–18 years reflect potential abatement of earlier declining trends. J Nutr 2014;144:1291–7.
4. Poti JM, Duffey KJ, Popkin BM. The association of fast food consump-tion with poor dietary outcomes and obesity among children: is it the fast food or the remainder of the diet? Am J Clin Nutr 2014;99:162–71. 5. Powell LM, Nguyen BT, Han E. Energy intake from restaurants:
de-mographics and socioeconomics, 2003–2008. Am J Prev Med 2012;43: 498–504.
6. Drewnowski A, Rehm CD. Energy intakes of US children and adults by food purchase location and by specific food source. Nutr J 2013;12:59. 7. Fryar CD, Ervin RB. NCHS data brief 114: caloric intake from fast food among adults: United States, 2007–2010. Hyattsville (MD): Na-tional Center for Health Statistics; 2013
8. Smith LP, Ng SW, Popkin BM. Trends in US home food preparation and consumption: analysis of national nutrition surveys and time use studies from 1965–1966 to 2007–2008. Nutr J 2013;12:45.
9. Poti JM, Slining MM, Popkin BM. Solid fat and added sugar intake among U.S. children: the role of stores, schools, and fast food, 1994– 2010. Am J Prev Med 2013;45:551–9.
10. Ng SW, Slining MM, Popkin BM. The Healthy Weight Commitment Foundation Pledge: calories sold from U.S. consumer packaged goods, 2007–2012. Am J Prev Med 2014;47:508–19.
11. Ng SW, Popkin BM. The Healthy Weight Commitment Foundation pledge: calories purchased by U.S. households with children, 2000– 2012. Am J Prev Med 2014;47:520–30.
12. Volpe R. The relationship between national brand and private label food products: prices, promotions, recessions and recoveries. Eco-nomic research report no ERR-129. Washington (DC): USDA; 2011. 13. Cano-Sancho G, Perelló G,Nadal M, Domingo JL. Comparison of the
nutritional composition and the concentrations of various contaminants in branded and private label yogurts. J Food Compos Anal 2015;42:71–7. 14. Nutrition Department of the French Observatory of Food Quality. Car-actérisation de l’offre alimentaire, par secteur et segment de marché. [Characterizing the nutritional quality of foods by market segments.] Maisons-Alfort (France): ANSES (French Agency for Food Envi-ronment and Occupational Health & Safety; 2015 (in French). 15. Menard C, Dumas C, Gillot N, Laurent L, Labarbe B, Ireland J, Volatier
JL. The French OQALI survey on dairy products: comparison of nutrient contents and other nutrition information on labels among types of brands. J Hum Nutr Diet 2012;25:323–33.
16. Thomas R, Ahuja J. Market share and nutrient comparisons of private-label and national brand ready-to-eat breakfast cereals. J Acad Nutr Diet 2015;115(9 Suppl):A41 (abstr).
17. Cooper S, Nelson M. ‘Economy’ line foods from four supermarkets and brand name equivalents: a comparison of their nutrient contents and costs. J Hum Nutr Diet 2003;16:339–47.
18. NHANES. National Health and Nutrition Examination Survey Data: 2003–2004, 2005–2006, 2007–2008, 2009–2010, 2011–2012. Atlanta (GA): CDC.
20. CDC. National Health and Nutrition Examination Survey: Analytic note regarding 2007–2010 survey design changes and combining data across other survey cycles. In: CDC, editor. NCHS home surveys and data collection systems National Health and Nutrition Examination Survey questionnaires, datasets, and related documentation. Atlanta (GA): CDC; 2012.
21. The Nielsen Company. [Internet]. New York: The Nielsen Co. [cited 2016 Jul 9]. Available from: http://en-us.nielsen.com/.
22. Ng SW, Popkin BM. Monitoring foods and nutrients sold and con-sumed in the United States: dynamics and challenges. J Acad Nutr Diet 2012;112:41–5.e4.
23. StataCorp. Stata statistical software: release 14. 14th ed. College Sta-tion (TX): StataCorp LP; 2015.
24. Hall KD, Guo J, Dore M, Chow CC. The progressive increase of food waste in America and its environmental impact. PLoS One 2009;4:e7940. 25. Neff RA, Spiker ML, Truant PL. Wasted food: U.S. consumers’ reported
awareness, attitudes, and behaviors. PLoS One 2015;10:e0127881. 26. Buzby JC, Hyman J. Total and per capita value of food loss in the
United States. Food Policy 2012;37:561–70.
27. Powell LM, Szczypka G, Chaloupka FJ. Trends in exposure to tele-vision food advertisements among children and adolescents in the united states. Arch Pediatr Adolesc Med 2010;164:794–802. 28. Grier SA, Kumanyika SK. The context for choice: health implications
of targeted food and beverage marketing to African Americans. Am J Public Health 2008;98:1616–29.
29. Powell LM, Wada R, Kumanyika SK. Racial/ethnic and income dis-parities in child and adolescent exposure to food and beverage televi-sion ads across the U.S. media markets. Health Place 2014;29:124–31. 30. Bibeau WS, Saksvig BI, Gittelsohn J, Williams S, Jones L, Young DR. Perceptions of the food marketing environment among African American teen girls and adults. Appetite 2012;58:396–9.
31. Kunkel D, Mastro D, Ortiz M, McKinley C. Food marketing to chil-dren on U.S. Spanish-language television. J Health Commun 2013;18: 1084–96.
32. Williams JD, Crockett D, Harrison RL, Thomas KD. The role of food culture and marketing activity in health disparities. Prev Med 2012;55: 382–6.
33. Walmart.com. Our commitments [Internet]. Bentonville (AR): Wal-Mart Stores, Inc. [cited 2016 Jul 9]. Available from: http://corporate. walmart.com/global-responsibility/hunger-nutrition/our-commitments. 34. Drewnowski A, Darmon N. The economics of obesity: dietary energy
density and energy cost. Am J Clin Nutr 2005;82:265S–73S. 35. Drewnowski A. The cost of US foods as related to their nutritive value.
Am J Clin Nutr 2010;92:1181–8.
36. Slining MM, Mathias KC, Popkin BM. Trends in food and beverage sources among US children and sdolescents: 1989–2010. J Acad Nutr Diet 2013;113:1683–94.
37. Mathias KC, Ng SW, Popkin B. Monitoring changes in the nutritional content of ready-to-eat grain-based dessert products manufactured and purchased between 2005 and 2012. J Acad Nutr Diet 2015;115:360–8. 38. Piernas C, Ng SW, Popkin B. Trends in purchases and intake of foods and beverages containing caloric and low-calorie sweeteners over the last decade in the United States. Pediatr Obes 2013;8:294–306. 39. Popkin BM, Hawkes C. The sweetening of the global diet, particularly
beverages: patterns, trends and policy responses. Lancet Diabetes En-docrinol 2016;4:174–86.
40. Gordon-Larsen P, Popkin B. Understanding socioeconomic and racial/ ethnic status disparities in diet, exercise, and weight: underlying con-textual factors and pathways. J Am Diet Assoc 2011;111:1816–9. 41. O’Dougherty M, Story M, Stang J. Observations of parent-child
co-shoppers in supermarkets: children’s involvement in food selections, pa-rental yielding, and refusal strategies. J Nutr Educ Behav 2006;38:183–8. 42. Wingert K, Zachary DA, Fox M, Gittelsohn J, Surkan PJ. Child as change agent: the potential of children to increase healthy food pur-chasing. Appetite 2014;81:330–6.
43. Roberto CA, Baik J, Harris JL, Brownell KD. Influence of licensed characters on children’s taste and snack preferences. Pediatrics 2010; 126:88–93.
44. Kraak VI, Story M. Influence of food companies’ brand mascots and entertainment companies’ cartoon media characters on children’s diet and health: a systematic review and research needs. Obes Rev 2015;16:107–26. 45. Birch LL, Fisher JO. Development of eating behaviors among children
and adolescents. Pediatrics 1998;101(Suppl 2):539–49.
46. Hill RJ, Davies PS. The validity of self-reported energy intake as de-termined using the doubly labelled water technique. Br J Nutr 2001;85: 415–30.
47. Murakami K, Livingstone MB. Prevalence and characteristics of mis-reporting of energy intake in US adults: NHANES 2003–2012. Br J Nutr 2015;114:1294–303.
48. Slining MM, Yoon EF, Davis J, Hollingsworth B, Miles D, Ng SW. An approach to monitor food and nutrition from “factory to fork”. J Acad Nutr Diet 2015;115:40–9.
49. Parfitt J, Barthel M, Macnaughton S. Food waste within food supply chains: quantification and potential for change to 2050. Phil Trans R Soc Lond B Bio Sci 2010;365:3065-81.
50. Gunn JP, Barron JL, Bowman BA, Merritt RK, Cogswell ME, Angell SY, Bauer UE, Frieden TR. Sodium reduction is a public health priority: reflections on the Institute of Medicine’s report, sodium intake in pop-ulations: assessment of evidence. Am J Hypertens 2013;26:1178–80. 51. Ogden CL, Carroll MD, Kit BK, Flegal KM. Prevalence of childhood and
adult obesity in the United States, 2011-2012. JAMA 2014;311:806–14. 52. Ogden CL, Carroll MD, Kit BK, Flegal KM. Prevalence of obesity and