ANALYSIS OF RECEIVER DOMAIN DEPHOSPHORYLATION KINETICS
Stephani Cyrisse Page
A dissertation submitted to the faculty at the University of North Carolina at Chapel Hill in partial fulfillment of the requirements for the degree of Doctor of Philosophy in the Department
of Biochemistry and Biophysics in the School of Medicine.
Chapel Hill 2015
© 2015
ABSTRACT
Stephani Page: Analysis of Receiver Domain Dephosphorylation Kinetics (Under the direction of Robert Bourret)
Plants and microorganisms use two-component signal transduction systems (TCSs) to mediate responses to stimuli. Canonical TCSs consist of a sensory component, the sensor kinase (SK), and a response-mediating component. The phosphorylation state of the SK is regulated by the presence of stimuli. The response-mediating component, the response regulator (RR) accepts the phosphoryl group from the SK. Receiver domains are the conserved domain of RRs, and contain the site of phosphorylation, a conserved Asp. Receiver domain dephosphorylation results in signal termination, and can occur through phosphotransfer to water or histidine. The kinetics of self-catalyzed Asp ! water phosphotransfer (autodephosphorylation) of RRs appear to be tuned to the timescales of the biological processes in which RRs participate, and reported rate constants span six orders of magnitude. More complex variations of TCSs, called
phosphorelays, contain histidine-containing phosphotransfer domain (Hpt), which contain the phosphoaccepting histidine in Asp ! His phosphotransfer.
autodephosphorylation. We also report results of additional bioinformatics analysis of receiver domain sequences assigned to RR subfamilies (determined by the presence of specific output domains).!
Second, this work represents the first reported demonstration of a small molecule analog for Hpts in TCSs. Imidazole is the functional group of His. Here, we characterize the imidazole-mediated dephosphoryation reaction of receiver domains. Additionally, we use imidazole to probe non-conserved active site residues as potential determinants of TCS Asp ! His
phosphotransfer reactions. Further, we show the structure of a receiver domain in the presence of a phosphomimic and imidazole.
ACKNOWLEDGEMENTS
Words cannot express my gratitude for undergoing this process under the guidance of Bob & Ruth. You have been advisers, mentors, and advocates. Many thanks to you, the current and former members of the Bourret lab, and the TCS community.
Thank you to my committee, and other members of the departments of Biochemistry & Biophysics and Microbiology & Immunology, who have offered support and encouragement far beyond what I had ever expected.
I would like to also acknowledge NC A&T SU Departments of Chemical Engineering and Biology, UNC IMSD and TIBBS, UNC Molecular and Cellular Biophysics Program, The Biophysical Society Summer Course, ASBMB OPA, Morehead Planetarium and Science Center, NC Science Festival, Greenleaf, Emmanuel, VUU School of Divinity, the #BLACKandSTEM community, my family and friends for their ongoing support.
Daddy, I have learned a lot about love and forgiveness. I have learned that bonds run deep – deeper than space and time, mistakes and missteps. To experience closeness with you in the months before having to say goodbye was a gift from God. I love you deeply. I miss you terribly. I finally wrote my book! Rest in peace.
mountains/Walked through all the valleys/And you never left me behind” – Stronger by Mary J. Blige
Momma, you raised this woman who did this thing that so many people said she could not do. You have been my example and my standard. Thank you for loving me in spite of me. Thank you for making squirt feel so loved. My purple lady, I love you.
Aidan, I never knew what I was capable of until I was holding you in my arms. You are always bigger than the toughest moments. You are always the reason to keep going. This is ours. You changed my life. You opened my heart. I love you.
TABLE OF CONTENTS
LIST OF TABLES ... xiv
LIST OF FIGURES ...xv
LIST OF ABBREVIATIONS ... xvii
CHAPTER 1: INTRODUCTION ...1
1.1 Background ...1
1.1.1 Microbial signal transduction ...1
1.1.2 Protein phosphorylation in signal transduction ...1
1.1.3 Two-component signal transduction ...2
1.1.4 Response regulator architecture ...2
1.2 Receiver domains ...3
1.2.1 Receiver domain of response regulators ...3
1.2.2 Variation of proteins containing receiver domains ...3
1.2.3 Receiver domain phosphotransfer reactions ...4
1.2.4 Receiver domain dephosphorylation biochemistry ...4
1.2.5 Receiver domain evolution ...5
1.3.1 Chapter 2: Using bioinformatics-guided assessment of non-conserved features to probe functional variation within
protein families ...6
1.3.2 Chapter 3: Characterization of a new small molecule analog for TCSs ...8
1.4 Figures...9
CHAPTER 2: BIOINFORMATICS GUIDED ANALYSIS OF FUNCTIONAL VARIATION IN PROTEIN FAMILIES: RECEIVER DOMAIN AUTODEPHOSPHORYLATION ...12
2.1 Summary ...12
2.2 Introduction ...13
2.3 Material and Methods ...16
2.3.1 Bioinformatics analysis ...16
2.3.2 Mutagenesis and protein purification ...19
2.3.3 Autodephosphorylation rate constant measurement using 32P ...20
2.4 Results ...21
2.4.1 20 D+2/T+2 pairs account for half of receiver domain sequences ...21
2.4.2 Substitutions at D+2 and T+2 in CheY modulated autodephosphorylation rate constants over two orders of magnitude ...22
2.4.3 Substitution mimicking CheY at T+2 in PhoBN enhanced autodephosphorylation ...24
2.4.5 CheY autophosphorylation with PAM and
autodephosphorylation vary inversely ...27
2.4.6 Certain D+2/T+2 pairs are enriched in receiver domains from different classes of response regulators ...28
2.5 Discussion ...30
2.5.1 Autodephosphorylation rate constants of CheY variants correlate to wild type response regulators with the same D+2/T+2 pair ...30
2.5.2 Residues at D+2 and T+2 modulated CheY autodephosphorylation over a continuous range ...30
2.5.3 Mechanistic insights from inverse relationship between CheY kdephos and kphos/KS ...31
2.5.4 Amino acids enriched in response regulator subfamilies correlated to autodephosphorylation kinetics ...32
2.5.5. Bioinformatics-guided experimental design has broad implications in strategies to assess variation within protein families ...33
2.6 Tables ...35
2.7 Figures...39
CHAPTER 3: IMIDAZOLE AS A SMALL MOLECULE ANALOG IN TWO-COMPONENT SIGNAL TRANSDUCTION ...47
3.1 Summary ...47
3.2 Introduction ...48
3.3 Materials and Methods ...50
3.3.2 CheY dephosphorylation rate constant measurement
by 32P ...51
3.3.3 PhoB dephosphorylation assayed by 32P ...52
3.3.4 TLC analysis of phosphorylated small molecules ...53
3.3.5 Artificial phosphorelay ...53
3.3.6 Crystallization, data collection, structure solution and refinement ...53
3.3.7 CheY dephosphorylation rate constant measurement by pH jump/stopped-flow fluorescence ...55
3.3.8 CheY autophosphorylation rate constant measurement using stopped-flow fluorescence ...56
3.4 Results ...56
3.4.1 Imidazole stimulates dephosphorylation of the RR CheY ...56
3.4.2 Imidazole enhances dephosphorylation by acting as a nucleophile ...57
3.4.3 Imidazole-mediated dephosphorylation requires the intact RR active site ...58
3.4.4 Phosphoryl groups reversibly transfer between CheYMPI and imidazole ...59
3.4.5 Imidazole can act as a rudimentary Hpt in an artificial phosphorelay ...60
3.4.6 Non-conserved residues at D+2, T+1, and T+2 interact with the imidazole ring in the RR active site ...61
3.4.8 Non-conserved active site residues influence phosphorylation reactions in CheY variants that mimic
phosphorelay receiver domains ...64
3.5 Discussion ...66
3.5.1 Phosphotransfer reactions in TCSs: Hpt domains allow bidirectional His/Asp phosphotransfer ...66
3.5.2 Small molecule analogs as kinetic probes of TCSs ...67
3.5.3 Receiver domain active sites account for some kinetic preference in phosphotransfer reactions involving Hpts ...67
3.5.4 RRs contain the primary catalytic machinery for Asp ! His phosphotransfer ...69
3.5.5 Imidazole orients similarly to Hpts in Asp ! His phosphotransfer ...71
3.5.6 Non-conserved active site residues differentiate between nucleophiles ...71
3.5.7 Practical applications of imidazole ...73
3.6 Tables ...74
3.7 Figures...79
CHAPTER 4: FUTURE DIRECTIONS AND CONCLUSIONS ...87
4.1 PROBING FUNCTIONAL VARIATION WITHIN PROTEIN FAMILIES ...87
4.1.1 Broad application of bioinformatics-guided assessment of functional variation within protein families ...87
4.1.3 Potential avenues for additional analysis of functional variation of receiver domains based on RR
sub-categories ...89 4.2 APPLICATIONS OF IMIDAZOLE IN TWO-COMPONENT
SYSTEMS ...91 4.2.1 Applications of imidazole in analysis of
phosphotransfer reactions ...91 4.2.2 Comparisons between effects with water and
imidazole may reveal mechanistic insight into receiver
LIST OF TABLES
Table 2.1 CheY autodephosphorylation rate constants ...35
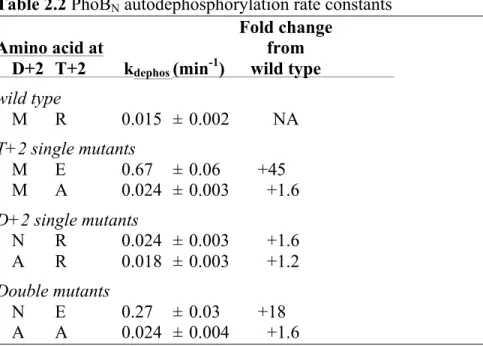
Table 2.2 PhoBN autodephosphorylation rate contants ...37
Table 2.3 Top 10 D+2/T+2 pairs for response regulator subfamilies ...38
Table 3.1 Data collection and refinement statistics ...74
Table 3.2 Rate constants for dephosphorylation of CheY variants with imidazole and water ...75
Table 3.3 Rate constants for “His ! Asp” phosphotransfer ...76
Table 3.4 Rate constants for “Asp ! His” phosphotransfer ...77
LIST OF FIGURES
Figure 1.1 Canonical two-component signal transduction components ...9 Figure 1.2 Active site of receiver domain CheY ...10 Figure 1.3 Phosphotransfer schemes in two-component signal transduction
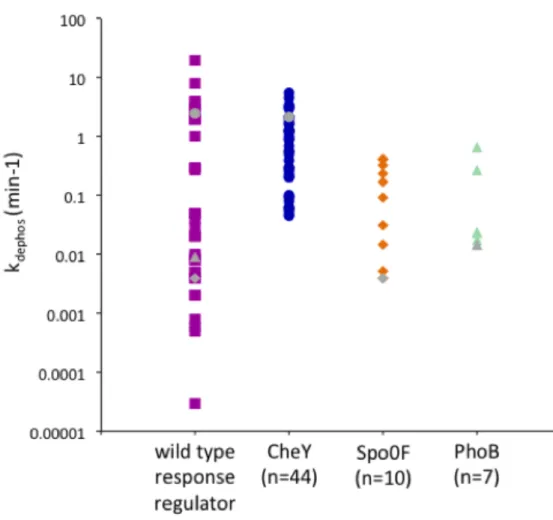
systems ...11 Figure 2.1 Ranges for kdephos ...39 Figure 2.2 Bubble plot showing distribution of D+2/T+2 pairs found in a
non-redundant receiver domain database ...40 Figure 2.3 Top 50 D+2/T+2 pairs in non-redundant database of 33,252
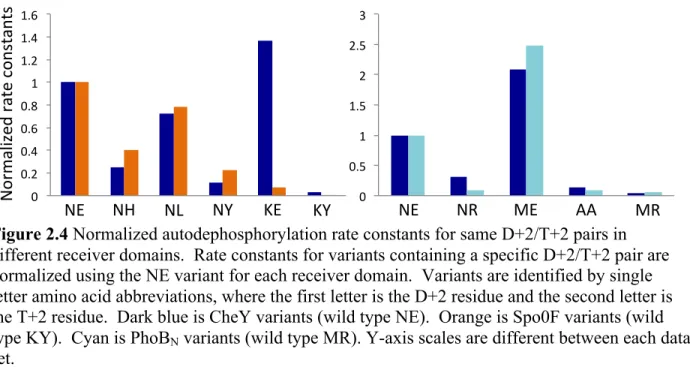
receiver domain sequences ...41 Figure 2.4 Normalized autodephosphorylation rate constants for same
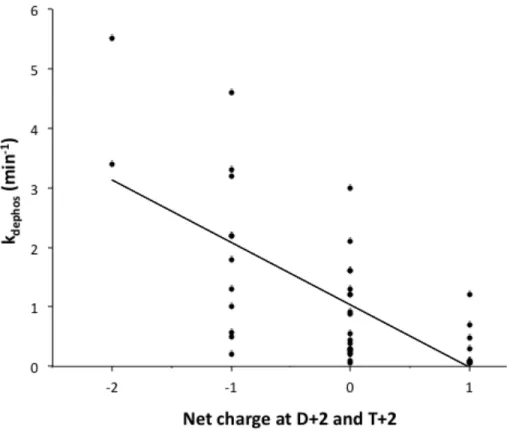
D+2/T+2 pairs in different receiver domains ...42 Figure 2.5 Correlation between net charge at positions D+2 and T+2 and
CheY autodephosphorylation rate constants ...43 Figure 2.6 Comparisons of effects on kdephos due to removal of acidic
residues at T+2 and D+2 in CheY, Spo0F, and PhoBN ...44 Figure 2.7 Relationship between CheY kdephos and kphos/KS with PAM ...45 Figure 2.8 Correlation between kdephos for wild type response regulators
and CheY variants with same residues at D+2 and T+2 ...46 Figure 3.1 CheY-P dephosphorylation kinetics in the absence and presence
of imidazole ...79 Figure 3.2 Nucleophilic activity of imidazole in the dephosphorylation of
CheY-P ...80 Figure 3.3 CheY-P dephosphorylation in the presence of imidazole or
Figure 3.5 [32P]CheYMPI-P reaction with imidazole ...83 Figure 3.6 The role of imidazole in an artificial phosphorelay ...84 Figure 3.7 Structure showing imidazole poised for nucleophilic attack in
CheYMPI"BeF3- ...85 Figure 3.8 Structures showing imidazole oriented in the active site similarly
LIST OF ABBREVIATIONS
Å angstrom, 10-10 meter µM micromolar, 10-6 moles/liter 2X two-fold concentrated
32P radioactive phosphorus isotope
AcP acetyl phosphate Ala, A amino acid alanine Arg, R amino acid arginine Asn, N amino acid asparagine Asp, D amino acid aspartate Asp-P phosphorylated aspartate
Asp1/Asp2 first or second aspartate in a phosphorelay scheme ATP adenosine triphosphate
Be beryllium
BeCl2 beryllium chloride
BeF3- beryllium trifluoride; stable phosphomimic C-terminal carboxyl-terminal
CheA-P phosphorylated CheA
CheY Escherichia coli chemotaxis response regulator CheY-P phosphorylated CheY
CheYlarge CheY F14E N59M E89R CheYMPI CheY F14Q N59K E89Y CheYSKN7 CheY N59V A88G E89N CheYSLN1 CheY N59Q E89F
CheYSSK1 CheY N59Q E89S CheYsmall CheY N59A E89A CheYwt wild type CheY
D conserved aspartate; site of phosphorylation in receiver domains D+1 residue one position C-terminal to the conserved aspartate D+2 residue two positions C-terminal to the conserved aspartate
DD conserved acidic residues, coordination of metal in receiver domains DHp dimerization and histiding phosphotransfer domain of sensor kinases DNA deoxyribonucleic acid
EX class of receiver domain variants containing an acidic residue at D+2, and varying at T+2
Gly, G amino acid glycine
Hepes (4-(2-hydroxyethyl)-1-piperazineethanesulfonic acid) HCl hydrogen chloride
His, H amino acid histidine His-P phosphorylated histidine
His1/His2 First or second histidine in a phosphorelay scheme His6 peptide tag consisting of six consecutive histidines HK histidine kinase; alternative name for sensor kinase Hpt histidine-containing phosphotransfer domain Hpt-P phosphorylated Hpt
K conserved lysine, coordination of phosphoryl group in receiver domains KCl potassium chloride
kdephos dephosphorylation rate constant kphos phosphorylation rate constant kobs observed rate constant
M2+ divalent metal cation Met, M amino acid methionine Mg2+ magnesium cation MgCl2 magnesium chloride mM millimolar, 10-3 moles/liter Mn2+ manganese cation
MnCl2 manganese chloride MPI monophosphoimidazole N-terminal amino-terminal
NaF sodium fluoride
Ni-NTA nickel immobilized by nitrilotriacetic acid P-O bond bond between a phosphorus and an oxygen atom PAGE polyacrylamide gel electrophoresis
PAM phosphoramidate
Phe, F amino acid phenylalanine
PhoB Escherichia coli phosphate regulation response regulator PhoB-P phosphorylated PhoB
PhoR Escherichia coli phosphate regulation sensor kinase PO32- phosphoryl group
R2 correlation coefficient
Rf retention factor; in TLC, distance migrated divided by total distance covered by solvent
RR response regulator
RR-P phosphorylated response regulator SDS sodium dodecyl sulfate
Ser, S amino acid serine
SK sensor kinase
Spo0F Bacillus subtilis sporulation response regulator
T conserved threonine/serine, coordination of phosphoryl group in receiver domains T+1 residue one position C-terminal to the conserved threonine/serine
T+2 residue two positions C-terminal to the conserved threonine/serine TCS two-component signal transduction systems
Thr,T amino acid threonine TLC thin layer chromatography
Tris Tris(hydroxymethyl)aminomethane Trp, W amino acid tryptophan
v/v volume solute / total volume of solution Val, V amino acid valine
XE class of receiver domain variants containing an acidic residue at T+2, and varying at D+2
XZ class of receiver domain variants containing non-acidic residues at D+2 and T+2 in which the same D+2 residues in contained in an XE variant
ZX class of receiver domain variants containing non-acidic residues at D+2 and T+2 in which the same T+2 residues in contained in an EX variant
CHAPTER 1: INTRODUCTION
1.1 BACKGROUND
1.1.1 Microbial signal transduction. The ability of organisms to respond to
environmental changes is a necessity. For microorganisms, environmental changes are sensed through the detection of stimuli such as light, chemical compounds, or temperature (1-5). Signal transduction encompasses the processes that detect stimuli, internally represent the presence of stimuli, and elicit appropriate responses. Signal transduction systems in microorganisms regulate processes that range from cell division and development to virulence and motility. Motivations of studies of microbial signal transduction include understanding of fundamental molecular strategies for signaling, revealing potential targets and agents for prevention and treatment of disease (6-9), and improving and developing industrial applications (10-16).
1.1.2 Protein phosphorylation in signal transduction. Although the possible stimuli and responses encompass a great deal of variety, there are very few categories of molecular processes that are employed as a means to encode the presence of stimuli (5, 17). One fundamental molecular strategy for signal transduction is protein phosphorylation (17-19). Despite the essentiality of phosphotransfer reactions in biological processes, even beyond signal transduction, questions remain regarding fundamental aspects of phosphotransfer reactions, such as whether enzymes change the transition states of catalyzed reactions compared to the
leaving groups (18, 20).
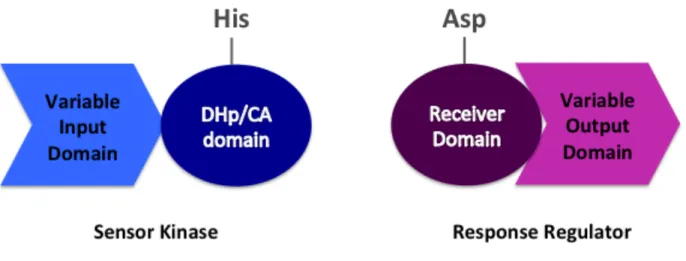
1.1.3 Two-component signal transduction. Plants, yeast, bacteria, and archaea use two-component signal transduction systems (TCSs) to mediate responses to stimuli (1, 17, 21). Any one bacterium can contain upward of a hundred individual TCSs. Canonical TCSs contain a sensory and a response-mediating component (Fig. 1.1), and employ phosphotransfer to encode the presence of stimuli. The phosphorylation state of the sensory component, the sensor kinase (SK), is regulated by the presence of stimuli. The SK contains a variable input domain that detects stimuli. The SK self-catalyzes the phosphorylation of its own conserved histidine with the γ-phosphoryl group of ATP. The phosphoryl group is then transferred from the SK to a conserved aspartate on the response-mediating component, called a response regulator (RR). The RR may contain a variable output domain that mediates the appropriate response. The RR then transfers the phosphoryl group to water through self-catalyzed or phosphatase-aided dephosphorylation, producing inorganic phosphate (Pi). RR dephosphorylation results in signal termination.
1.1.4 Response regulator architecture. Response regulators can be single domain proteins or contain variable output domains (17, 22, 23). Classification of response regulators is typically based on the structure of the output domain, if one is present (24). Broad categories of output domains inform the types of molecular processes that response regulators are involved in: protein-binding domains, DNA-binding domains, enzymatic domains, etc. (24, 25). For
1.2 RECEIVER DOMAINS
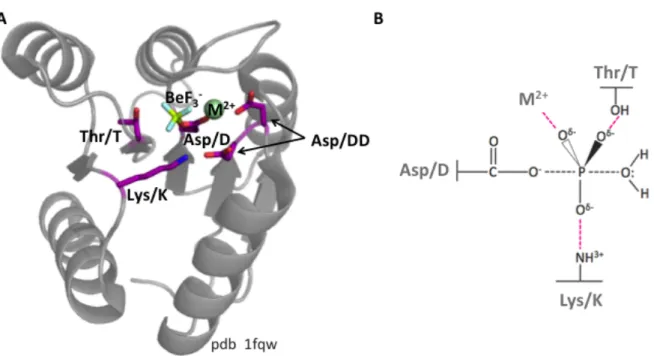
1.2.1 Receiver domains of response regulators. Receiver domains are the conserved domains of RRs (22, 23). Receiver domains contain the conserved aspartate that is the site of phosphorylation in addition to four conserved residues that mediate phosphorylation chemistry: two consecutive aspartates (denoted DD) that coordinate the required divalent metal, a conserved threonine (or serine) and lysine that directly coordinate the phosphoryl group (denoted T and K, respectively) (Fig. 1.2). Nomenclature of non-conserved residues in receiver domains is based on proximity to conserved residues. For example, non-conserved residues located two positions C-terminal to the conserved Thr/Ser are named “T+2”. Receiver domains also have a conserved structure consisting of alternating strands and α-helices. In the folded protein, the five β-strands are arranged in a β-sheet sandwiched by the five α-helices. The phosphorylation active site is contained within the loops that connect the strands and helices.
1.2.2 Variation in proteins containing receiver domains. Increased complexity in TCSs results in greater regulation of the flow of phosphoryl groups and, therefore, response-mediation. There are variations of TCSs (28) in which receiver domains are contained in
proteins other than response regulators (29). Phosphorelays, for example, are variations of TCSs that typically contain two receiver domains; one as a part of a canonical response regulator, and another as a part of a hybrid kinase (30-33). In hybrid kinases, the phosphoryl group is
transferred from a SK domain to a C-terminal receiver domain within the same protein. Within phosphorelays, dephosphorylation of the hybrid kinase receiver domain is the source of signal termination.
1.2.3 Receiver domain phosphotransfer reactions. As briefly discussed before,
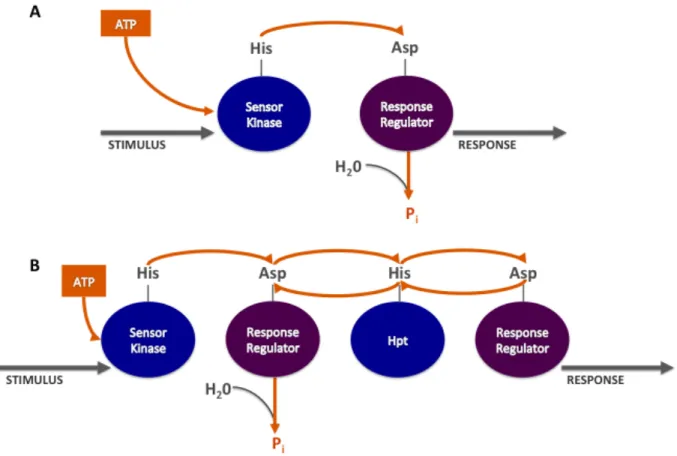
self-catalyze their own phosphorylation with small molecular phosphodonors (34), and contain the core catalytic machinery of His ! Asp phosphotransfer. One small molecule phosphodonor, acetyl phosphate is physiologically available (35). In canonical two-component systems the flow of phosphoryl groups around the receiver domain include phosphotransfer from the SK histidine to the receiver domain aspartate, then from the receiver domain aspartate to water resulting in the following reaction scheme: ATP ! SK ! RR ! water or ATP ! His ! Asp ! water (Fig. 1.3). Recall that phosphorelays can (but do not always) use hybrid kinases that contain a receiver domain in addition to a canonical response regulator. Phosphorelays also vary from canonical TCSs by using a histidine-containing phosphotransfer domain (Hpt) – which is the phosphotransfer domain that connects the two receiver domains (30, 31). In phosphorelays, the phosphotransfer reaction scheme is: ATP ! His1 ! Asp1 ! His2 ! Asp2! His2 ! Asp1 ! water (Fig. 1.3), where His1 and His2 are in the SK and Hpt domains, respectively. Notably, the presence of the Hpts in phosphorelays adds in Asp ! His phosphotransfer, which is not a feature of canonical TCSs. Additionally, while Asp ! water phosphotransfer is non-reversible (Pi product) essentially removing phosphoryl groups from the system, Asp ! His phosphotransfer is reversible, potentially adding another layer of regulation (17, 21).
residues from the phosphatase serve to enhance the reaction through mechanisms such as positioning of the nucleophile (39-44). In addition to water, histidines (from Hpts) act as nucleophiles for attack on phosphorylated receiver domains in TCSs (17, 45).
Similar to water, direct in-line attack is also required when a histidine is acting as the nucleophile, but it was previously unclear what differences and similarities existed between water- and histidine-mediated dephosphorylation of response regulators. Though structural analysis suggests that the receiver domain contains the primary catalytic machinery of Asp ! His phosphotransfer (46), we were not aware of experimental demonstration of catalysis of the reaction by a receiver domain prior to our work reported here. We found that both reactions require the intact receiver domain active site, and that receiver domains contain the primary catalytic machinery of Asp ! His phosphotransfer. In order for the imidazole to attack the phosphoryl group, the imidazole must be deprotonated, resulting in a pH-dependence not
observed with reactions with water. Imidazole-mediated dephosphorylation is at least 1000-fold faster than water-mediated dephosphorylation, depending on the D+2/T+2 residues present. Further, water- and imidazole-mediated dephosphorylation are both influenced by D+2/T+2 residues, but the reactions may be influenced differently, such that residues at D+2/T+2 may discriminate between the two nucleophiles.
SKs and output domains (4, 32, 50). Analyses also showed that SK and output domains can influence what residues are found at specific positions within receiver domains (4, 50). 1.3 OVERVIEW OF DISSERTATION WORK
1.3.1 Chapter 2. Using bioinformatics-guided assessment of non-conserved features to probe functional variation within protein. In the age of high-throughput genome
sequencing, the number of protein sequences attributed to protein families is rapidly growing. DNA sequences are translated into protein sequences, which are aligned to identify areas of sequence similarity. Areas of protein sequence similarity define conserved domains, which are then used to identify members of specific protein families.
Two decades ago, sequence analysis of RRs involved fewer than one hundred protein sequences (22). Now, the MiST2 database contains ~250,000 receiver domains sequences (1). The availability of such a large number of sequences begs the question of how to utilize
sequence information beyond assigning sequences to broad protein families. Bioinformatics analysis, in general, involves the use of computational tools to probe, for example, databases of sequence information for patterns or relationships.
co-variation (54) – ranking #6 out of ~6000 pairwise comparisons - and appear to have co-evolved (unpublished, Thane Miller and Robert Bourret).
The following text is a summary of work and observations detailed in Chapter 2.
Bioinformatics analysis of a non-redundant database of receiver domain sequences revealed that 5% of possible D+2/T+2 pairs represented 50% of receiver domain sequences. Furthermore, analysis of D+2/T+2 distribution across different RR subfamilies (determined by output domains) showed an enrichment of particular D+2/T+2 pairs within individual RR subfamilies in a manner that suggests functional importance.
Using two receiver domains – E. coli CheY and PhoB - residues at D+2 and T+2 were changed, and assessed for kinetic effects on autodephosphorylation, expanding previous analysis using CheY and Bacillus subtillus Spo0F. Previous work by Thomas, et al. (52) and Pazy, et al. (36, 52) involving analysis of 17 E. coli CheY variants and nine B. subtilis Spo0F variants focused on mimicking active sites of fewer than ten wild type response regulators. This work expands analysis by adding 26 new CheY variants and analysis in E. coli PhoB.
Residues at D+2 and T+2 modulated RR autodephosphorylation rate constants over two orders of magnitude. All but one D+2/T+2 pair tested in two different receiver domains had similar effects on autodephosphorylation. Further, autodephosphorylation rate constants for CheY variants correlated to audodephosphorylation rate constants of wild type RRs containing the same D+2/T+2 pair.
1.3.2 Chapter 3. Characterization of a new small molecule analog for TCSs. Receiver domains can transfer phosphoryl groups to water or histidine. The functional side chain of histidine is the imidazole ring. Despite the knowledge that small molecule
phosphodonors for receiver domains had been informative in dissecting determinants of His ! Asp phosphotransfer (34), we are not aware of any previous demonstration that a small molecule other than water could accept phosphoryl groups from receiver domains.
The following text is a summary of work and observations detailed in Chapter 3.
1.4 FIGURES
CHAPTER 2: BIOINFORMATICS GUIDED ANALYSIS OF FUNCTIONAL VARIATION IN PROTEIN FAMILIES: RECEIVER DOMAIN
AUTODEPHOSPHORYLATION1
2.1 SUMMARY
Plants and microorganisms use two-component signal transduction systems (TCSs) to mediate responses to environmental stimuli. TCSs mediate responses through phosphotransfer from a conserved histidine on a sensor kinase to a conserved aspartate on the receiver domain of a response regulator. Typically, signal termination occurs through dephosphorylation of the receiver domain, which can catalyze its own dephosphorylation. Despite strong structural conservation between receiver domains, reported autodephosphorylation rate constants (kdephos) span a million-fold range. Non-conserved receiver domain active site residues D+2 and T+2 (two amino acids C-terminal to conserved phosphorylation site and Thr/Ser respectively) influence kdephos values, but the extent and mechanism of influence are unclear. We used bioinformatics analysis of a large database of naturally occurring receiver domain sequences to design mutant receiver domains for deeper kinetic analysis of autodephosphorylation. When combined with previous analyses, kdephos values were obtained for CheY variants that represented D+2/T+2 pairs found in 55% of receiver domain sequences. kdephos of CheY variants altered at
!!!!!!!!!!!!!!!!!!!!!!!!!!!!!!!!!!!!!!!!!!!!!!!!!!!!!!!!
1!This work was submitted for publication in the Journal of Bacteriology. Bioinformatics
D+2/T+2 correlated with kdephos of wild type receiver domains containing the same D+2/T+2 pair. Further, a given pair of amino acids!at D+2/T+2 generally had similar effects on kdephos in CheY, PhoBN, and Spo0F. Negative charge at D+2/T+2 enhanced kdephos. Rate constants for
autophosphorylation with phosphoramidate and autodephosphorylation of CheY variants altered at D+2/T+2 were inversely correlated, suggesting D+2/T+2 residues interact with aspects of the ground or transition states that differ between the two reactions. Additionally, particular
D+2/T+2 pairs are enriched in different response regulator subfamilies, suggesting functional significance.
In the age of genomics, one protein family can include hundreds of thousands of
sequences. Characterization of a conserved domain can lead to prediction of general function. However, a general strategy to assess features that differentiate between members of the same protein family (e.g. non-conserved residues in a conserved domain) would be useful. Fully exploring just two positions could mean assessment of 400 (20 x 20) variants. Instead, we created and analyzed a non-redundant database of receiver domain sequences. Five percent of D+2/T+2 pairs in the database were sufficient to represent 50% of receiver domain sequences. Using bioinformatics to prioritize mutant choice made it feasible to experimentally probe the influence of positions D+2 and T+2 on receiver domain autodephosphorylation.
2.2 INTRODUCTION
sequenced bacterial genomes (4, 29), one species contains tens to more than a hundred TCSs. TCSs regulate a wide range of processes from cell development to virulence. Signal
transduction by TCSs occurs through the transfer of phosphoryl groups between histidyl and aspartyl residues of different protein components (17). Canonically, the sensory component (the sensor kinase) is a phosphodonor to the response regulator (the response-mediating component) (17). The conserved domain in the response regulator, the receiver domain, functions as a molecular switch. The phosphorylation status of a conserved Asp on the receiver domain corresponds to turning the output response on and off. Typically, receiver domain
phosphorylation initiates the output response, and dephosphorylation terminates the response. Dephosphorylation can occur with the assistance of another protein, such as a phosphatase, or by self-catalysis by the receiver domain, which is termed autodephosphorylation.
Reported autodephosphorylation rate constants of receiver domains span almost six orders of magnitude (51) (Fig. 2.1). The large variation in receiver domain
Non-conserved residues located within or close to the receiver domain active site could potentially be positioned to exert influence on the catalysis of autodephosphorylation. Residues at D+2 (located two amino acids C-terminal to the site of phosphorylation on the β3-α3 loop) and T+2 (located two amino acids C-terminal to the conserved Thr/Ser on the β4-α4 loop) are located such that their side chains may potentially interact with conserved active site residues, the
phosphoryl group, and/or the attacking water nucleophile. In previous studies using a limited set of Escherichia coli CheY and Bacillus subtilis Spo0F mutants based on the wild type sequences of fewer than ten receiver domains, we found that the particular amino acids at positions D+2 and T+2 altered the autodephosphorylation rate constant by almost two orders of magnitude (36, 52). Due to the small data set, the full extent to which residues at D+2 and T+2 can influence receiver domain autodephosphorylation is unknown. Further, the mechanisms by which positions D+2 and D+2 influence autodephosphorylation remain unclear.
Here, we extend investigation of the D+2 and T+2 residues and their influence on receiver domain autophosphorylation by significantly expanding our data set to be much more representative of response regulators. Pursuing a larger and more relevant data set would
potentially mean that conclusions could be applied more broadly to receiver domains. However, expansion of the data set would need to be experimentally feasible. Bioinformatics analysis revealed that 20 (out of 400 possible) D+2/T+2 pairs account for 50% of receiver domain sequences found in a non-redundant database of naturally occurring response regulators – in essence, only 5% of possible amino acid pairs accounts for the majority of amino acid sequences. We also expanded our experimental analysis to include another receiver domain, PhoBN,
expanded mutant collection showed that residues at D+2 and T+2 modulated
autodephosphorylation rate constants over two orders of magnitude, indicating that additional factors are required to account for the much larger range of kdephos values reported for response regulators. A particular pair of amino acids at D+2 and T+2 generally had similar effects on autodephosphorylation in different response regulators. Negatively charged amino acids at D+2 or T+2 enhanced autodephosphorylation in all three receiver domains tested, but positively charged amino acids did not have a consistent effect on hydrolysis. The previously measured rate constants for autophosphorylation with phosphoramidate (57) and autodephosphorylation of CheY variants that differ at D+2 and T+2 are inversely correlated, suggesting the amino acids at D+2 and T+2 interact with aspects of the ground or transition states that differ between the two reactions.
Finally, analysis of receiver domains from different response regulator families revealed dramatically different distributions of D+2/T+2 pairs between receiver domain subclasses. Typically, a few pairs composed of chemically similar amino acids and exerting similar effects on the autodephosphorylation rate constant dominated the D+2/T+2 pairs in each response regulator family. The biased distribution strengthens the notion that amino acids at positions D+2 and T+2 are functionally important.
2.3 MATERIALS AND METHODS
(data not shown). The up-to-date analysis used to generate amino acid frequencies given in this report is described below.
The sequences of 250,546 proteins containing receiver domains, identified using the Agfam signaling domain library of the Microbial Signal Transduction (MiST2.2) database (1), were provided by the curators on February 11, 2015 (Database S2). To reduce bias and
redundancy from multiple closely related genomes, one genome (the first encountered in the list) was chosen for each genus and proteins from all other genomes in the same genus were
discarded. This process left 39,132 sequences. Random reordering of the original list of
sequences using a Fisher-Yates shuffle resulted in different genome sequences being in the final database, but did not significantly change reported results.
similarity and response regulators are on average only ~25% identical (22), the screen against high sequence identity was not applied between clumps.
The positions of the five conserved active site residues that are critical for receiver domain function (23) were then located. Each clump of aligned sequences was searched to identify the positions that had the highest number of matches to "DD" (two adjacent Asp and/or Glu residues), "D" (Asp only), "T" (Ser or Thr), and "K" (Lys only) with the constraint that the identified positions must occur in the listed order from N- to C-terminal. The 6,772 sequences that did not initially appear to contain all five conserved residues were cycled through the clumping, alignment, and conserved residue identification procedures again. On the second filtering attempt, 1,643 sequences met the criterion of containing all five conserved residues. Most of the sequences that passed upon rescreening came from the same few clumps in the first attempt and appeared to have initially failed due to sequence misalignment. Sequences that passed the first and second attempts were pooled to yield a collection of 33,252 receiver domain sequences. The 5129 sequences (13.4%) that failed to pass the second screen for the presence of all five conserved residues were presumed to be pseudo-receiver domains (61) and were not considered further.
where + signifies in the C-terminal direction and - signifies in the N-terminal direction) can be identified for each entry in spite of differences in length. Sequences that match a specified search criterion (e.g. Met at position D+2) can also be retrieved.
Finally, response regulators can be categorized based on their output domains (24). Therefore, the primary receiver domain database was subdivided into secondary databases representing the major classes of response regulators. The AseqID was used to query Seqdepot for the Pfam (62) domain annotation associated with each protein in the primary database. The presence of specific domains led to assignment to families as follows: PF00486 (Trans_reg_C) domain, OmpR family; PF00196 (GerE) domain, NarL/FixJ family; both PF00158
(Sigma54_activat) and PF02954 (HTH_8) domains, NtrC family; PF04397 (LytTr) domain, LytR family; PF02518 (HATPase_c) domain, hybrid kinase family. Proteins that had exactly one receiver domain in Agfam annotation and no domains other than PF00072 (Response_reg) in Pfam were assigned to the single receiver domain family. 188 proteins (~0.6%) were assigned to more than one family. 6697 proteins were not assigned. The sorting process resulted in seven secondary databases (the six families listed above plus the proteins without assignment) that can be individually searched (Databases S4-S10). Databases created for this work are available at http://www.unc.edu/~bourret/PageSupplementalDatabaseFiles.htm.
thrombin cleavable His6-tagged PhoB1-127, as a template. Thrombin cleavage leaves the N-terminal GSH. PhoB variants were purified as described for CheY. His6-tagged PhoR193-431 was expressed and purified as described (63). All protein variants were gel filtered using a Superdex 75 1660 size exclusion column (GE Biosciences) to remove impurities.
We apply a nomenclature for discussion of CheY and PhoBN mutants in which the first letter is the D+2 residue and the second letter is the T+2 residue. One D+2/T+2 pair in the top 20 was not assessed. EL (D+2 is E, T+2 is L), twelfth in abundance, was made in CheY, but attempts at protein purification were unsuccessful. Only six of the next 14 pairs were tested. The GY, KF, KH, RS, EY, HD, TY, and HS pairs (#21-23, 28-31, 33, respectively) were not made because they were not among the most prevalent pairs in our initial database analysis. Notably, analysis of Spo0F in (52) included three pairs (EL, KH, and EY) missing from the CheY mutant set.
2.3.3 Autodephosphorylation rate constant measurement using 32P.
were plotted versus time and fit to one phase exponential decays yielding the
autodephosphorylation rate constant, kdephos. Each time course was designed to follow loss of 32P over at least 4-5 half lives (~3-6% 32P remaining on [32P]CheY-P). All measurements were repeated three times.
To determine the autodephosphorylation rate constants of PhoBN variants, 4 µM His6-tagged PhoR was incubated with 0.3 mM [γ-32P]ATP in 3.5 mM MgCl2, 35 mM KCl, and 35 mM Tris pH 8.0 for 30 minutes at room temperature to generate [32P]PhoR-P. The reaction mixture containing [32P]PhoR-P was pipetted onto a 0.22 µm PVDF centrifugal filter column (Millipore) containing ~200 mL of a Ni-NTA Agarose (Qiagen) slurry that was equilibrated in 35 mM Tris pH 8.0, 3.5 mM MgCl2, and 35 mM KCl buffer. After centrifugation, the column was washed multiple times with equilibration buffer to remove excess ATP. PhoBN (wild type PhoB1-127) (90 µM in 60 µL of equilibration buffer) was added directly to the slurry, mixed, and then incubated at room temperature for 5 min on the column to allow for sufficient
phosphotransfer from [32P]PhoR-P to PhoBN. The column was centrifuged to elute [32P]PhoBN-P. Time courses were completed and phosphorimaging was analyzed as described above for CheY. 2.4 RESULTS
2.4.1 20 D+2/T+2 pairs account for half of receiver domain sequences. Previous analysis of the influence of D+2 and T+2 residue pairs on receiver domain
autodephosphorylation (52) was limited to pairs that mimicked fewer than ten receiver domains. Bioinformatics was employed to guide experimental design for assessing the impact of D+2/T+2 residues in a manner that represented receiver domains more broadly and that was
sequences to one genome per genus and then removing sequences with ≥ 90% sequence identity (Database S3). Out of 400 possible amino acid combinations at D+2 and T+2, 364 pairs were present (Fig. 2.2). Strikingly, 20 D+2/T+2 pairs (only 5% of the possible combinations)
accounted for 50% of natural receiver domain sequences. The pair frequencies are displayed in Figure 1 such that the bubble area reflects the total number of sequences in our database that contain a specific D+2/T+2 pair (Fig. 2.3). Some pairs, such as MK (the first letter is the D+2 residue and the second letter is the T+2 residue) and MR, were quite abundant, each accounting for more than 5% of sequences analyzed. CheY mutants were made with the goal of completing a set of the most common D+2/T+2 pairs. In the end, the collection included 19 of the top 20 and 25 of the 34 most frequent D+2/T+2 pairs (wild type CheY pair NE was #11). Because making the majority of D+2/T+2 pairs in CheY required double substitutions, single mutants were also made and tested in order to determine the contribution of each D+2 or T+2 substitution individually.
2.4.2 Substitutions at D+2 and T+2 in CheY modulated autodephosphorylation rate constants over two orders of magnitude. Autodephosphorylation rate constants were
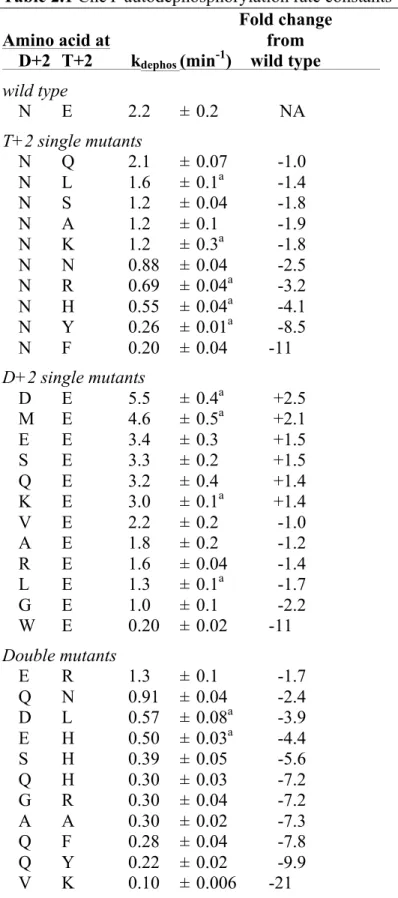
measured for 26 CheY variants. With consolidated CheY data from (36, 52), the expanded data set (Table 2.1) contained twelve D+2 single mutants, ten T+2 single mutants, and 20 double mutants in CheY that, together (including the NE pair found in wild type CheY), represent 55% of receiver domains. At T+2, amino acids L, K, R, H, and Y were assessed in (52), and
residue size and hydrophobicity increased; aromatics (H, Y, F) made up the slowest T+2 single mutants.
In contrast, single substitutions at D+2 (changing the Asn) resulted in both enhanced and diminished rate constants. D, M, E, K, and L were assessed at D+2 in (52), which was extended to include S, Q, V, A, R, G, and W in this study. Overall, single substitutions at D+2 resulted in a ~30-fold range in rate constants. Almost all (11/12) D+2 single mutants resulted in rates constants that were within three-fold of wild type CheY. One D+2 single mutant (Trp), which slowed the reaction by 11-fold, was responsible for the added order of magnitude in the range of CheY D+2 single mutants.
Double mutants DL, EH, MR, MK, and KY were analyzed in (52); RH and ML were analyzed in (36). This study expanded analysis of CheY double mutants to include: ER, QN, SH, QH, GR, AA, QF, QY, VK, WH, RF, RY, and VY. A ~30-fold range in autodephosphorylation rate constants was observed for the consolidated CheY double mutants with simultaneous substitutions at D+2 and T+2. All of the CheY D+2/T+2 double mutants exhibited diminished autodephosphorylation rate constants compared to wild type. Altogether, single and double substitutions at D+2 and T+2 in CheY resulted in a range in autodephosphorylation rate constants that spans two orders of magnitude.
constants by ~30% to 120-fold. The expanded data set is more representative of naturally occurring D+2/T+2 pairs than the original, and includes D+2/T+2 pairs found in wild type response regulators exhibiting a five order of magnitude range in autodephosphorylation rate constants. Therefore, we can reasonably expect to attribute about two orders of magnitude of the range in wild type response regulator autodephosphorylation rate constants to the particular amino acids at positions D+2 and T+2 and conclude that other factors must contribute to variation between receiver domains in the rate of autodephosphorylation.
2.4.3 Substitution mimicking CheY at T+2 in PhoBN enhanced
autodephosphorylation. E. coli PhoBN, a receiver domain with a relatively slow
Single and double substitutions at D+2 and T+2 were made in PhoBN (changing Met and Arg at D+2 and T+2, respectively) that mimic CheY (Table 2.2). Mutants with Glu substitutions at T+2 resulted in the largest increases compared to the wild type PhoBN autodephosphorylation rate constant (PhoBN NE and PhoBN ME autodephosphorylated 18- and 45-fold faster than wild type PhoBN, respectively).
The PhoBN mimics of CheY were compared to single and double Ala mutants of PhoBN. Steric occlusion, i.e. hindrance of the in-line attack of nucleophilic water by large residues, was previously hypothesized as one mechanism by which D+2 and T+2 residues might influence receiver domain autodephosphorylation (36). Based on this hypothesis, removal of the large Arg and/or Met residues by substitution to Ala should result in enhanced autodephosphorylation. The autodephosphorylation rate constant of PhoBN AR was unchanged from wild type PhoBN,
whereas rate constants for PhoBN MA and PhoBN AA were both two-fold faster than wild type PhoBN. The relatively small effect of single and double Ala substitutions in PhoBN suggests that steric obstruction is not the key mechanism of influence by D+2/T+2 residues. Because
introducing a Glu at T+2 had a much larger effect than an Ala, it is clear that the key influence in the enhanced autodephosphorylation rate constant of PhoBN ME was from adding a beneficial feature of Glu as opposed to removing a detrimental feature of Arg.
to all three backbones, thus indicating generality. Data was analyzed to determine whether kinetic effects correlated to features of the amino acids (such as size, solvent accessibility, hydrophobic surface area) present at D+2 and T+2. Though relationships were not observed for other features, a plot of autodephosphorylation rates constants against net charge at D+2 and T+2 revealed that more negatively charged active sites correlated to faster autodephosphorylation rate constants (best fit R2 = 0.44) (Fig. 2.5). Deeper inspection provides additional evidence that charge had a role in modulating autodephosphorylation. There are 13 CheY variants with Glu at T+2 (Table 2.1). Because the D+2 residue was varied experimentally, for purposes of discussion, this class of variants is designated XE. Of the XE variants, 12 have a related double mutant in which the Glu is replaced with another amino acid, designated XZ. In all 30 of the CheY XE versus XZ comparisons, the autodephosphorylation rate constant is faster for the XE variant (Fig. 2.6A). Because Glu is the wild type residue at T+2 in CheY, the result could be explained as loss of wild type function. However, in both PhoBN (3/3) and Spo0F (6/6) (Fig. 2.6A) - in which Glu is not the wild type residue at T+2 - all of the XE mutants tested resulted in a gain of
function compared to the corresponding XZ mutants. The dominant accelerating effect of Glu at T+2 in CheY is consistent with the modest range in autodephosphorylation rate constants for CheY XE mutants (with the exception of CheY WE).
Spo0F, acidic substitutions at D+2 resulted in faster autodephosphorylation (52). There are two Spo0F EX variants that can be compared to ZX variants with the same T+2 residue. Of the four Spo0F comparisons, all of the EX variants autodephosphorylated faster (Fig. 2.6B). There were no PhoBN mutants in this study that contain an acidic residue at D+2.
Deeper inspection of positively charged residues did not yield similar outcomes. When looking amongst groupings of variants that included some with a positively charged residue (Arg, Lys, or His), we did not discern a relationship between kinetic data and removal or addition of a positive charge. Further, because His has a pKa within a reasonable pH range for
autodephosphorylation experiments, we were able to directly assess pH-dependence of CheY variants with a His at T+2. Changing the pH will alter the charge of a His between neutral and positive. Autodephosphorylation rate constants of the CheY QH, RH, and WH variants were not affected by pH (data not shown), suggesting that positive charge at T+2 may not influence autodephosphorylation. Alternatively, positively charged residues (K, R, H) also contain large hydrophobic surface areas. Thus, hydrophobic surface area or size, rather than positive charge, may be the means by which Arg, Lys, and His residues influence autodephosphorylation.
2.4.5 CheY autophosphorylation with PAM and autodephosphorylation vary
autophosphorylation rate constants were measured. Plotting kdephos versus kphos/Ks revealed an inverse relationship between the rate constants for the two reactions (Fig. 2.7).
The plot of kdephos versus kphos/KS showed informative correlations between the amino acids found at T+2 and the rate constants for each reaction. Pairs containing residues with hydrophobic surface areas and/or that are large typically had faster PAM autophosphorylation rate constants and slower autodephosphorylation rate constants (Fig. 2.7). Pairs containing acid or amide residues at T+2 were typically faster for autodephosphorylation and slower for PAM autophosphorylation, with CheY variants containing an acid residue at T+2 having the greatest impact. In contrast to enhancing autodephosphorylation in CheY, more negative active sites diminished autophosphorylation with PAM (57), consistent with the inverse relationship between kdephos and kphos/KS.
distributed differently. Strikingly, while MK and MR made up 14% of receiver domain
sequences overall, they made up 49% of receiver domain sequences in the OmpR family (Table 2.3). Further, 72% of all sequences containing MK or MR are in the OmpR family. OmpR family receiver domains typically function to regulate transcription, a relatively slow process, and receiver domains containing MK or MR at D+2/T+2 have autodephosphorylation rate constants at the slow end of the range of wild type response regulators. Changing D+2/T+2 in CheY to MK or MR made CheY autodephosphorylation rate constants at least an order of magnitude slower (Table 2.1).
phosphate sink to drain phosphoryl groups out of the system through autodephosphorylation (67-70). The enrichment of particular D+2/T+2 pairs in receiver domains within different response regulator families strengthens the correlation between which D+2/T+2 pairs are present in a receiver domain and the biological function of that particular receiver domain.
2.5 DISCUSSION
2.5.1 Autodephosphorylation rate constants of CheY variants correlate to wild type response regulators with the same D+2/T+2 pair. Observed autodephosphorylation rate constants for CheY, Spo0F, PhoBN variants were generally consistent with the effects of substitutions at D+2 and T+2 anticipated from rate constants for wild type response regulators containing the same D+2/T+2 pairs. For example, wild type Rhodobacter sphaeroides PrrA is at the slower end of the range of autodephosphorylation rate constants for wild type response regulators, and contains RY at D+2/T+2. In CheY, the RY variant is one of the slowest of the CheY variants (Table 2.1). The correlation between kdephos for wild type response regulators and corresponding CheY variants generally holds in spite of the observation that the effects of changing amino acids at D+2 and T+2 in CheY are sufficient to account for <1% of the range in autodephosphorylation rate constants observed among wild type response regulators. When log kdephos for wild type response regulators was plotted versus log kdephos for CheY variants with the same D+2/T+2 pair, there was a direct correlation (R2 = 0.7) (Fig. 2.8). Presumably, the
correlation indicates that other factors affecting kdephos often evolved to reinforce the direction set by the amino acids at D+2 and T+2.
(including variants containing Ala) are spread continuously over a range of values rather than grouped into functional versus non-functional classes (Table 2.1 and Fig. 2.1). The continuous rather than bimodal distibution suggests that residues at D+2 and T+2 are influential but not essential for receiver domain autodephosphorylation.
2.5.3 Mechanistic insights from inverse relationship between CheY kdephos and kphos/KS. Analysis of relationships between autodephosphorylation rate constants and amino acid characteristics revealed that negative charge at D+2/T+2 influenced the
autodephosphorylation reaction (Fig. 2.6). Because the correlation between negative charge at D+2/T+2 and enhanced kdephos was consistent in three different receiver domains, there was the potential for further analysis to reveal generally applicable mechanistic insights. Comparison of rate constants for autodephosphorylation and autophosphorylation with PAM for 20 CheY variants (Fig. 2.7) elucidated potential explanations for the negative charge correlation.
Receiver domains self-catalyze both dephosphorylation and autophosphorylation with small molecule phosphodonors, such as PAM. Both reactions are substitution reactions at the phosphoryl atom. The proposed transition states for autodephosphorylation and
(phosphodonor for autophosphorylation). Notably, the residues at D+2/T+2 are within appropriate distance to affect the regions around the water or PAM.
In contrast to enhancing autodephosphorylation, negative charge at D+2/T+2 correlates to diminished CheY autophosphorylation with PAM (57). Thomas, et al. proposed that the
diminishing effects were due to charge repulsion between the incoming PAM anion and the negative charge on the side chains. For autodephosphorylation, interactions between the
incoming water and the negatively charged side chains could enhance the reaction by stabilizing the attacking water molecule. Alternatively, increased negative charge in the vicinity of the phosphoryl group could destabilize the ground state.
2.5.4 Amino acids enriched in response regulator subfamilies correlate to
autodephosphorylation kinetics. In some of the response regulator subfamilies represented in this work, particular amino acids were enriched at D+2 and/or T+2. For example, in the ‘LytR’ subfamily, 82% of residues found at T+2 are aromatic (Y, F, H) (data not shown). Similarly, in the ‘NtrC’ subfamily, 81% of sequences contain an aromatic amino acid as the T+2 residue (data not shown). However, there are distinctions in what residues are prevalent at D+2 in the two subfamilies. For ‘LytR’ 52% of sequences contain a Gln or Glu at D+2 as opposed to Arg and Lys, which are found at D+2 in 53% of ‘NtrC’ sequences. In this case, it appears that the residue at D+2 may distinguish between functional timescales and mechanisms for influence.
autodephosphorylation rate constants. Likewise, the kdephos values of CheY variants containing RY, RF, RH, or KY grouped together. It is reasonable to expect that, given the correlations between association with a particular subfamily and the effect on CheY autodephosphorylation, one could roughly predict the autodephosphorylation rate constants for CheY variants containing EF, EY, KF, or KH (closely related variants not yet tested). Using similar relationships may enhance our ability to estimate kinetic effects on autodephosphorylation as a result of containing a certain D+2/T+2 pair.
2.5.5 Bioinformatics-guided experimental design has broad implications in strategies to assess variation within protein families. With the advancements in genome sequencing, the known sizes of protein families have dramatically increased. While conserved domains identify the family to which a protein belongs, questions of functionality remain. Assessment of
functionality within a protein family has historically focused on conserved residues within the conserved domain. Typically, amino acid sequences are aligned to determine the conserved residues, the conserved residues are changed to alanines or other amino acids, and the mutant proteins are assessed using functional assays. However, when considering the different
functionalities within a family of proteins, it is often the non-conserved features that distinguish one protein in a family from another. Bioinformatics analysis dramatically enhanced the
feasibility of studying non-conserved features of a large protein family, response regulators. Not only were we able to assess receiver domain autodephosphorylation kinetics of a mutant set that reflects what is found in nature, but we were also able to gain more confidence in the
autodephosphorylation, the larger data set reported here suggests with more confidence that negative charge is a key means of influence.
Bioinformatics analysis also revealed distinctions between response regulator subfamilies. The D+2/T+2 pairs enriched in the response regulator subfamily databases (Table 2.3)
2.6 TABLES
Table 2.1 CheY autodephosphorylation rate constants
Fold change
Amino acid at from
D+2 T+2 kdephos (min-1) wild type wild type
N E 2.2 ± 0.2 NA
T+2 single mutants
N Q 2.1 ± 0.07 -1.0
N L 1.6 ± 0.1a -1.4
N S 1.2 ± 0.04 -1.8
N A 1.2 ± 0.1 -1.9
N K 1.2 ± 0.3a -1.8
N N 0.88 ± 0.04 -2.5
N R 0.69 ± 0.04a -3.2 N H 0.55 ± 0.04a -4.1 N Y 0.26 ± 0.01a -8.5 N F 0.20 ± 0.04 -11 D+2 single mutants
D E 5.5 ± 0.4a +2.5 M E 4.6 ± 0.5a +2.1
E E 3.4 ± 0.3 +1.5
S E 3.3 ± 0.2 +1.5
Q E 3.2 ± 0.4 +1.4
K E 3.0 ± 0.1a +1.4
V E 2.2 ± 0.2 -1.0
A E 1.8 ± 0.2 -1.2
R E 1.6 ± 0.04 -1.4
L E 1.3 ± 0.1a -1.7
G E 1.0 ± 0.1 -2.2
W E 0.20 ± 0.02 -11 Double mutants
E R 1.3 ± 0.1 -1.7
Q N 0.91 ± 0.04 -2.4
D L 0.57 ± 0.08a -3.9 E H 0.50 ± 0.03a -4.4 S H 0.39 ± 0.05 -5.6
Q H 0.30 ± 0.03 -7.2
G R 0.30 ± 0.04 -7.2
A A 0.30 ± 0.02 -7.3 Q F 0.28 ± 0.04 -7.8
W H 0.098 ± 0.01 -22 M R 0.094 ± 0.012a -23 M K 0.078 ± 0.004a -28 K Y 0.062 ± 0.006a -35 R H 0.060 ± 0.008b -37 M L 0.060 ± 0.006b -37 R F 0.056 ± 0.003 -39 R Y 0.048 ± 0.004 -46 V Y 0.045 ± 0.008 -49
Table 2.2 PhoBN autodephosphorylation rate constants
Fold change
Amino acid at from
D+2 T+2 kdephos (min-1) wild type wild type
M R 0.015 ± 0.002 NA T+2 single mutants
M E 0.67 ± 0.06 +45
M A 0.024 ± 0.003 +1.6 D+2 single mutants
N R 0.024 ± 0.003 +1.6 A R 0.018 ± 0.003 +1.2 Double mutants
N E 0.27 ± 0.03 +18
T ab le 2. 3 T op 10 D +2/ T +2 pa irs f or re spons e re gul at or s ubf am il ie s All H ybri d S ingl e N on - re ce ive rs ki na se O m pR dom ai n N arL /F ixJ N trC L yt R as si gne d D +2/ D +2/ D +2/ D +2/ D +2/ D +2/ D +2/ D +2/ T +2 a % b T +2 % T +2 % T +2 % T +2 % T +2 % T +2 % T +2 % MK c 7.7 QN 8.0 MK 24 NS 10 RF 16 RY 16 QY 19 EL 9.2 MR 6.0 MK 5.4 MR 24 NE 7.8 RY 8.1 RH 13 EY 11 RY 6.5 RY 4.0 QH 4.3 GR 15 MK 4.0 RH 8.0 WH 7.8 NY 8.0 ML 4.6 GR 3.2 VY 4.0 ML 5.9 VK 3.0 SH 6.2 RF 7.0 QF 7.5 MK 3.1 RF 2.9 MR 3.8 NR 5.1 RY 2.5 NH 3.1 KY 6.0 RY 6.8 KY 2.9 ML 2.9 GY 3.6 MM 1.4 KS 2.4 EF 2.8 NY 5.2 HY 4.1 NY 2.8 NS 2.5 E R 3.4 TR 1.2 NY 2.3 NS 2.8 KF 4.2 EH 2.8 KF 2.5 RH 2.5 ML 2.5 SR 1.2 KY 1.7 NY 2.6 KH 3.4 KY 2.3 KH 2.1 QN 2.1 TY 2.2 NL 0.93 SH 1.7 QF 2.5 NW 2.6 QH 2.3 RH 2.0 NY 2.1 IY 1.7 DA 0.78 QF 1.7 HS 2.1 QY 2.1 DH 1.8 NE 1.7 Σ d 36 39 80 37 54 67 66 37 a A m ino a ci ds a t pos it ions D +2 a nd T +2 i n t he indi ca te d s ubf am il y.
b % of
s ubf am il y m em be rs c ont ai ni ng t he indi ca te d D +2/ T +2 pa ir. c Bl ue f ont indi ca te s D +2/ T +2 pa irs f ound i n the
top 10 of
a ll re ce ive r dom ai ns .
d % of
s ubf am il y m em be rs re pre se nt
ed by t
he
top 10 D
!
2.7 FIGURES
!
!
!
! Figure 2.2 Bubble plot showing distribution of D+2/T+2 pairs found in a non-redundant receiver domain database (Database S3). The position of the bubble corresponds to a certain D+2 (x-axis)/T+2 (y-axis) pair. The area of the bubble reflects the frequency of that pair in the database. In purple are the 5% of pairs that make up 50% of sequences.
!
! Figure 2.3 Top 50 D+2/T+2 pairs in non-redundant database of 33,252 receiver domain sequences. Pairs in blue were tested in CheY, Spo0F, and/or PhoB.!
!
!
Figure 2.4 Normalized autodephosphorylation rate constants for same D+2/T+2 pairs in different receiver domains. Rate constants for variants containing a specific D+2/T+2 pair are normalized using the NE variant for each receiver domain. Variants are identified by single letter amino acid abbreviations, where the first letter is the D+2 residue and the second letter is the T+2 residue. Dark blue is CheY variants (wild type NE). Orange is Spo0F variants (wild type KY). Cyan is PhoBN variants (wild type MR). Y-axis scales are different between each data set. ! ! N or m al ize d+ rate +c on stan ts + CheY+vs+Spo0F* CheY+vs+PhoB* NR+
NE+ ME+ AA+
KY+ MR+
NH+
NE+ NL+ NY+ KE+ 0"
!
Figure 2.5 Correlation between net charge at positions D+2 and T+2 and CheY
autodephosphorylation rate constants. His was considered neutral for calculations of net charge. Best fit R2 = 0.44.
!
Figure 2.6 Comparisons of effects on kdephos due to removal of acidic residue at T+2 (XE in Panel A) and D+2 (EX in Panel B) in CheY, Spo0F, and PhoBN.
!
!
!
!
CHAPTER 3: IMIDAZOLE AS A SMALL MOLECULE ANALOG IN TWO-COMPONENT SIGNAL TRANSDUCTION23
3.1 SUMMARY
In two-component signal transduction systems (TCSs), responses to stimuli are mediated
through phosphotransfer between protein components. Canonical TCSs use His ! Asp
phosphotransfer in which phosphoryl groups are transferred from a conserved His on a sensory
histidine kinase (HK) to a conserved Asp on a response regulator (RR). RRs contain the
catalytic core of His ! Asp phosphotransfer, evidenced by the ability of RRs to
autophosphorylate with small molecule analogs of phospho-His proteins. Phosphorelays are a
more complex variation of TCSs that additionally utilize Asp ! His phosphotransfer through the
use of an additional component, the histidine-containing phosphotransferase (Hpt), which reacts
with RRs both as phosphodonors and phosphoacceptors. Here we show that imidazole has
features of a rudimentary Hpt. Imidazole acted as a nucleophile and attacked phosphorylated
RRs (RR-P) to produce monophosphoimidazole (MPI) and unphosphorylated RR.
Phosphotransfer from RR-P to imidazole required the intact RR active site, indicating that the
RR provided the core catalytic machinery for Asp ! His phosphotransfer. Imidazole functioned
in an artificial phosphorelay to transfer phosphoryl groups between unrelated RRs. The X-ray !!!!!!!!!!!!!!!!!!!!!!!!!!!!!!!!!!!!!!!!!!!!!!!!!!!!!!!!
2!This work was reprinted with permission from Biochemistry,!54!(49),!pp!7248–7260. Copyright 2015 American Chemical Society.
!
crystal structure of an activated RR•imidazole complex showed imidazole oriented in the RR
active site similarly to the His of an Hpt. Imidazole interacted with RR non-conserved active site
residues, which influenced the relative reactivity of RR-P with imidazole versus water. Rate
constants for reaction of imidazole or MPI with chimeric RRs suggested that the RR active site
contributes to the kinetic preferences exhibited by the YPD1 Hpt.
3.2 INTRODUCTION
Microorganisms across all domains of life as well as slime molds and plants use
two-component systems (TCSs) to mediate responses to stimuli (21, 74). TCSs regulate many
different biological functions from development and motility (21) to antibiotic resistance (75, 76)
and virulence (77, 78). In TCSs, the “signal” is transmitted amongst protein components through
the transfer of phosphoryl groups. The initial phosphotransfer event occurs when the sensory
component, the stimulus-regulated histidine kinase (HK), catalyzes phosphotransfer from ATP to
its own conserved His. Phosphotransfer proceeds to a conserved Asp on the receiver domain of
the response-mediation component, the response regulator (RR). Phosphorylation activates the
RR to carry out its output function, e.g. transcription regulation. Finally, termination of the
signal results from phosphotransfer from the RR Asp to water. Thus, the typical pathway for
phosphotransfer in a canonical TCS is ATP ! His ! Asp ! H2O.
Phosphorelays are a more complex variation of TCSs in which phosphotransfer follows
an ATP ! His1 ! Asp1 ! His2 ! Asp2 pathway (30, 45). Bacteria contain some of the most
well characterized phosphorelays (68, 70, 79, 80) and the vast majority of TCSs found in plants
and fungi are phosphorelays (45). In phosphorelays, the sensory HK (His1) transfers the
phosphoryl group to a RR receiver domain (Asp1) that does not have an output function. The
!
(Hpt), and then to a RR (Asp2), which executes the output response. In phosphorelays, signal
termination often occurs by reverse phosphotransfer (Asp2 ! His2 ! Asp1 ! H2O) (68, 80).
In contrast to canonical TCSs, phosphotransfer from Asp ! His is essential for function in
phosphorelays.
Optimal functioning of any TCS requires meticulous regulation of the flow of phosphoryl
groups on and off of RR(s). In phosphorelays, the varied kinetics and directionality of
phosphotransfer for different Hpt/RR pairs (81) reflects multiple roles for Hpt domains in
directing phosphoryl group flow. In addition to acting as both the source and recipient of RR
phosphoryl groups, some Hpts can transfer phosphoryl groups to three RRs, to provide a branch
point in a signaling circuit (33, 45), or bind to a RR-P to prevent its dephosphorylation (69).
Bidirectional phosphotransfer to one response regulator and unidirectional phosphotransfer to
another response regulator allows the second response regulator to act as a phosphate sink for the
first (67). The structural determinants, of either Hpts or RRs, that underlie the variation in
directionality and kinetics of phosphoryl group flow are not currently known. In particular,
protein determinants that favor or disfavor Asp ! His phosphotransfer have not been elucidated.
Small molecule analogs of phosphoproteins have been extremely useful in probing the
catalytic contributions of protein components in His ! Asp phosphotransfer. Two small
molecule phosphodonors, monophosphoimidazole (MPI) and phosphoramidate (PAM), represent
progressively reduced portions of the His-P side chain. The observation that RRs can
autophosphorylate with small molecule phosphodonors demonstrated that RRs contain the core
catalytic machinery for His ! Asp phosphotransfer (34). Small molecule phosphodonors have