Echocardiography allows for analysis of
pulmonary arterial flow in mice with congenital
diaphragmatic hernia
Mansi Shah, MD, Michael R. Phillips, MD, Megan Quintana, MD,
Gary Stupp, RDCS, and Sean E. McLean, MD*
University of North Carolina, Chapel Hill, North Carolina
a r t i c l e i n f o
Article history:
Received 3 February 2017 Received in revised form 8 June 2017
Accepted 28 June 2017
Keywords:
Congenital diaphragmatic hernia Pediatric surgery
Pulmonary hypertension Echocardiography
a b s t r a c t
Background:Congenital diaphragmatic hernia (CDH) is a structural birth defect associated with pulmonary hypoplasia and pulmonary arterial hypertension (PAH). We hypothesize that echocardiography provides a method to assess real-time right ventricle (RV) function, remodeling, and pulmonary artery (PA) flow.
Materials and methods:Slit3 wild-type (WT) (n¼6) and knockout (KO) (n¼5) mice were analyzed at 2-3 months of age. Mice were anesthetized using isoflurane. Echocardiography was performed to analyze left and right ventricular wall thickness, internal diameter (ID), and function. Color Doppler was used to analyze flow in the PA and across the tricuspid valve.
Results:There was significant RV dilation in the KO miceversusWT, with an average RVID of 1.99 mmversus1.26 mm, respectively (P¼0.007). Flow in the PA of KO mice was altered compared to WT, with elevated PA velocity time indices, 30.68 mm versus 22.13 mm (P¼0.012), elevated PA peak velocities, 952.61 mm/sversus628.73 mm/s (P¼0.003), and decreased pulmonary acceleration times, 8.94 msversus16.18 ms (P¼0.002), respectively. Pulmonary vascular resistance, calculated by measuring tricuspid regurgitation peak ve-locity and right ventricular outflow tract veve-locity time index, was increased in KOversus WT mice, 17.61 mm2/sversus8.91 mm2/s (P¼0.003), respectively.
Conclusions:Slit3 KO mice with CDH show evidence of PAH and resultant RV dilation. Using direct cardiac puncture, elevated RV systolic pressures have been demonstrated in KO mice as evidence of PAH. Echocardiography allows direct analysis of the PA and real-time RV function without sacrifice of the mouse. This mode of evaluation allows longitudinal study in mice with PAH and CDH.
ª2017 Elsevier Inc. All rights reserved.
Introduction
Congenital diaphragmatic hernia (CDH) is a relatively com-mon congenital disorder affecting approximately 1 in 3000
children. There is significant morbidity and mortality related to CDH, and 10%-35% of all CDH patients do not survive beyond the neonatal period. Of the survivors, 50% will have long-term morbidity.1 Morbidity and mortality in CDH are
This material was presented, in part, at the 2015 American College of Surgeons Meeting.
* Corresponding author.Department of Surgery, Division of Pediatric Surgery, University of North Carolina, CB 7223, Chapel Hill, NC 27599. Tel.:þ919 966 4643; fax:þ919 843 2497.
E-mail address:[email protected](S.E. McLean).
Available online at
www.sciencedirect.com
ScienceDirect
journal home page: www.Journa lofSurgicalResea rch.com
0022-4804/$esee front matterª2017 Elsevier Inc. All rights reserved.
(septum transversum) CDH in humans.3Previous studies in
humans with CDH have shown pathologic changes in the pulmonary arteries and veins, known as pulmonary vascular remodeling, that lead to the development of PAH.4The Slit3
KO mouse is a unique mouse model for CDH because the mice are viable, which provides the unique opportunity to measure for changes consistent with PAHin vivo.
Current methods to evaluate PAH in mouse models include right heart catheterization and measurement of the right ventricular systolic pressure (RVSP), which in the absence of pulmonary stenosis allows for an estimation of PAH.5 However, right heart catheterization is a terminal
procedure in mice, which precludes longitudinal study. Furthermore, right heart catheterization is difficult in Slit3 KO mice with CDH that often have distorted thoracic anat-omy as a result of the diaphragmatic hernia. Therefore, assessment of RVSP by direct cardiac puncture has been performed in our laboratory to estimate PAH. However, this too results in sacrifice of the mouse. The aforementioned limitations result in an inability to serially assess PAH in mouse models and prevent the longitudinal assessment of mice with PAH before and after potential treatment mo-dalities, inhibiting the investigation of the mechanisms leading to the development of PAH in CDH.
In humans, although right heart catheterization is required to confirm the diagnosis of PAH, echocardiography is a commonly used screening test, and the only noninvasive technique to follow the course of the disease.6Furthermore,
studies have shown that echocardiography can successfully assess pulmonary hypertension in rat and mouse models in a noninvasive manner.7,8 We hypothesize that transthoracic
echocardiography provides a method to assess real-time right ventricle (RV) function, remodeling, and pulmonary artery (PA) flow in the Slit3 KO mouse model for CDH.
Methods
Slit3 WT and KO mice were bred and housed at our institu-tional animal facility under Instituinstitu-tional Animal Care and Use Committee protocol. Six WT and five KO mice were analyzed at 2-3 months (adult) of age, of which six mice were males and five mice were females. To perform transthoracic echocardi-ography, the mice were lightly anesthetized using isoflurane anesthesia. Inhaled isoflurane was administered at 3%
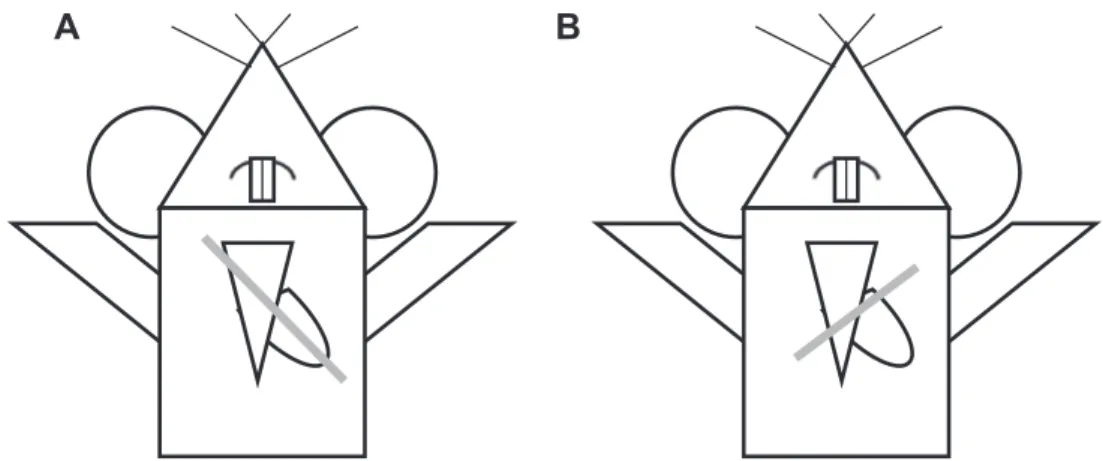
the VisualSonics Vevo 2100 ultrasound machine (FUJIFILM VisualSonics, Inc, Toronto, Ontario, Canada). Aquasonic Gel (Parker Laboratories, Inc, Fairfield, NJ), kept in a gel heater, was applied to the anterior chest. The transducer probe (40 MHz, VisualSonics Model MS550D) was applied to the anterior chest first in a parasternal long axis view, with an approximately 30 angle counterclockwise, left of the parasternal line with the transducer notch pointing caudally8(Fig. 1A). In this position, using the B mode setting of the ultrasound machine, a full view of the left ventricle (LV) in the parasternal long axis view can be obtained (Fig. 2). Once the left ventricle is clearly visualized, the ultrasound can be switched to M mode, the mode representing the movement of structures over time, with the indicator line positioned to go through the widest portion of the LV chamber, using the aorta as a landmark. This view can saved via cine store on the ultrasound machine to be used to perform off-line calculations of heart rate, LV anterior and posterior wall thickness, LV internal diameter, LV ejection fraction, and LV fractional shortening (Fig. 2).
Next, the parasternal short axis view is obtained. The ul-trasound is placed back in B mode, and the transducer probe is rotated 90clockwise from the parasternal long axis view, to obtain the parasternal short axis view (Fig. 1B). The probe can be tilted gently toward the cranium to obtain a cross-sectional view of the heart at the level of the aortic valve. In this view, the right atrium can be seen, separated from the RV by the tricuspid valve (Fig. 3). Once this view is obtained, the ultra-sound can be switched to the color Doppler mode. The pulse wave (PW)-line of the ultrasound, the line placed in the di-rection of flow, can be placed over the tricuspid valve to measure flow through the tricuspid valve. This can be used for off-line calculations of pulmonary vascular resistance (PVR), using the equation,
PVR¼TRmax velocity
VTIRVOT
where TRmax velocity is the maximum velocity of tricuspid
regurgitation (Fig. 4), divided by the velocity time integral of the right ventricular outflow tract, VTIRVOT.9
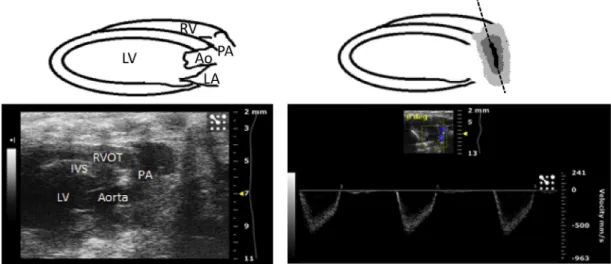
mode, the ultrasound can be switched to the color Doppler mode. The PW line of the ultrasound can be placed along the PA, parallel to the direction of blood flow in the vessel, to obtain a flow waveform (Fig. 5). This can be repeated for flow across the pulmonary valve and for the flow through the right ventricular outflow tract. These views can be saved via cine store on the ultrasound and can be used to perform off-line calculations of PA velocity time index, PA peak flow velocity (Fig. 6), pulmonary valve velocity time index, and right ven-tricular outflow tract velocity time index. Mean pulmonary arterial pressure (MPAP) cannot be accurately calculated in the mouse using the Vevo 2100 ultrasound; therefore, the PA ac-celeration time (PAT) was used as an estimate of MPAP.10The
MPAP equation used in the Vevo 2100 ultrasound is based on human clinical equations, where the PAT is much higher than in the mouse, generally greater than 120 ms, due to the much lower human heart rate compared to the mouse. Therefore, the equation is inaccurate when applied to mice. PAT is used instead as an estimate of MPAP and is calculated by measuring the time between the initiation of the pulmonary arterial waveform and the pulmonary arterial peak velocity (Fig. 6) and is known to decrease as pulmonary arterial pressure in-creases5and has been shown to inversely and linearly
corre-late with MPAP in humans.11,12
Finally, the last view to be obtained is a modified sternal short axis view. A similar angle is used to the para-sternal short axis view (Fig. 1B); however, the probe is placed at the lateral aspect of the mid-right hemithorax to obtain a cross-sectional view of the heart with the RV anterior to the left ventricle (Fig. 7). Once this view is obtained in the B mode of the ultrasound, the ultrasound can be switched to M mode. The indicator line is then placed such that it transects the widest portion of the RV chamber. This view can be saved via cine store on the ultrasound to perform off-line calculations of RV anterior wall thickness, RV internal diameter (ID)eat diastole and at systole (Fig. 7), and RV fractional shortening (FS). RV FS is calculated using the equation,
RV FS¼ RVend diastolic dimensionRVend systolic dimension
RVend diastolic dimension
100
where the RV end diastolic dimension is calculated as the RVID at diastole, and the RV end systolic dimension is calcu-lated as RVID at systole.13
To validate the echocardiographic findings, after echo-cardiography was performed, the RVSP of three WT and three KO mice was obtained by direct cardiac puncture. All mice were allowed to fully recover from the anesthesia
A
B
Fig. 1eIllustration of probe positioning. Gray line indicates probe position to obtain the (A) parasternal long axis view and (B) parasternal short axis view.
administered during echocardiography. Inhaled isoflurane anesthesia was induced via the drop method, and then maintained via nose cone at 1%-2% isoflurane. Each mouse was placed on a temperature-controlled mouse pad, and all four limbs were restrained with tape. A 25-5/8 gauge needle attached to a pressure transducer was then inserted into the RV transdiaphragmatically. A right ventricular waveform was obtained and analyzed using LabChart6 software.
Off-line data analysis was performed using Vevo 2100 software. Statistical analysis was performed usingt-test with Microsoft Excel. Male and female mice were used in this study, and the gender of the mouse was not considered to be a factor in the statistical analysis of the data. Echocardiography and off-line data analysis was performed by a single observer. The observer was blinded to the genotype of the mouse during off-line data analysis. This study was approved by the University of North Carolina Institutional Animal Care and Use Committee.
Results
WT and KO mice were approximately the same weight on average, 28.5versus28.8 kg, respectively (P¼0.93). Mean heart rate was similar in both groups, 470.49versus503.39 beats per minute (bpm), in WTversusKO mice respectively (P¼0.54). Left ventricular dimension and function was similar in WT versusKO mice, with LVAW (diastole) thickness of 0.82versus 0.69 mm (P¼ 0.07), LVID (diastole) of 3.53versus 3.46 mm (P¼0.84), LVPW (diastole) thickness of 0.96versus0.83 mm (P¼0.29), LV EF of 60.39versus58.66% (P¼0.87), and LV FS of 34.03versus30.75% (P¼0.71). For the aforementioned results please seeTable 1.
Right ventricular function was similar in WTversusKO mice, with RV FS of 39.19versus52.38% (P¼0.19) and right ventricular outflow tract (RVOT) VTI of 21.37versus17.30 mm (P¼0.15). However, the RV dimensions were significantly different in the two groups with a higher RVID (diastole) in KO mice compared Fig. 3eParasternal short axis view at the level of the aortic valve. TV[tricuspid valve; RV[right ventricle;
PV[pulmonary valve; AV[aortic valve; PA[pulmonary artery; RA[right atrium; and LA[left atrium. (Color version of figure is available online.)
to WT, 1.98 versus 1.26 mm, respectively (P¼ 0.007). RVAW (diastole) thickness was similar in both groups, 0.503 versus 0.500 mm in WTversusKO respectively (P¼0.97) (Table 1).
Flow through the PA was significantly altered in KO mice when compared to WT mice. The PA peak velocity was elevated in KO miceversusWT, 952.61versus628.73 mm/s, respectively (P¼0.003). PA VTI was also elevated in KO mice versus WT, 30.68versus22.13 mm, respectively (P¼0.012). PAT was decreased in KO mice versus WT, 8.94 versus 16.18 ms, respectively (P¼ 0.002), which suggests an esti-mated increased MPAP for KO compared to WT mice. Furthermore, pulmonary vascular resistance was increased in KO miceversusWT, 17.61versus8.91 mm2/s, respectively (P¼0.003) (Table 1).
To validate these echocardiographic findings, RVSP was calculated via direct cardiac puncture. The RVSP was signifi-cantly elevated in KO mice compared to WT mice, 35.393.41 versus16.011.70 mmHg, respectively (P¼0.0009;Fig. 8).
Discussion
In this study, we are able to demonstrate that transthoracic echocardiography can accurately and reproducibly charac-terize PAH and resultant RV remodeling in Slit3 KO mice with CDH and PAH. Thus, we are able to assess PAH in a noninva-sive manner that does not require sacrifice of the mouse. Before this method, studies of PAH relied largely on Fig. 5e(Left) Modified parasternal long axis view demonstrating the right ventricular outflow tract and pulmonary artery in B mode of the ultrasound. (Right) Same view in color Doppler mode, used to assess flow through the pulmonary artery. The PW line is seen along the pulmonary artery on the right, positioned parallel to the direction of blood flow in the vessel, and can also be positioned to assess flow across the pulmonary valve and right ventricular outflow tract. RV[right ventricle; RVOT[right ventricular outflow tract; PA[pulmonary artery; LV[left ventricle; IVS[interventricular septum; Ao[aorta; and LA[left atrium. (Color version of figure is available online.)
estimation of PAH by obtaining RVSP measurement via right heart catheterization or direct cardiac puncture, both of which are nonsurvivable procedures. We also demonstrate the abil-ity to validate our echocardiographic results with RVSP mea-surements obtained by direct cardiac puncture.
Slit3 KO mice do not exhibit changes in LV structure or function, with similar LVAW, LVPW, and LVID dimensions and LV EF and LV FS measurements to WT mice. Therefore, the presence of CDH does not appear to affect the left side of the heart in Slit3 KO mice, which is understandable given the knowledge that Slit3 KO mice with CDH develop central or right sided diaphragmatic hernias. Furthermore, although there is RV remodeling in Slit3 KO mice, with RV dilation, the RV function seems to be preserved, with similar RVOT VTI and RV FS measurements in KO and WT mice. The preserved RV function may account for the viability of the KO mice. Finally, we are able to demonstrate altered PA flow in a number of different ways, including significant differences in PA VTI, PA peak velocity, PAT, and PVR in KO compared to WT mice. These findings were validated by demonstrating elevated RVSP by direct cardiac puncture in the KO compared to WT mice.
Taken together, these echocardiographic techniques allow for a comprehensive assessment of PA flow and RV remodel-ing. PVR is able to be indirectly calculated, but PA flow is able thumbnail above, the yellow dashed line represents the indicator line positioned at the widest portion of the RV chamber. In the M mode view below, measurements of the RV internal diameter (RVID) and RV anterior (RVAW) dimension can be calculated. RVAW[right ventricle anterior wall; RV[right ventricle; IVS[interventricular septum; LV[left ventricle. (Color version of figure is available online.)
Table 1eEchocardiographic measurements and RVSP
calculated by direct cardiac puncture in WT and KO mice.
Measurements WT (n¼6) KO (n¼5) Pvalue
Weight (kg) 28.47 28.76 0.93
Heart rate (bpm) 470.49 503.39 0.54
LVAW diastole (mm) 0.82 0.69 0.07
LVID diastole (mm) 3.53 3.46 0.84
LVPW diastole (mm) 0.96 0.83 0.29
LV EF (%) 60.39 58.67 0.87
LV FS (%) 34.03 30.75 0.71
RV FS (%) 39.19 51.38 0.19
RVOT VTI (mm) 21.37 17.30 0.15
RVID diastole (mm) 1.26 1.99 0.007
RVAW diastole (mm) 0.503 0.500 0.97
PA peak velocity (mm/s) 628.73 952.61 0.0028
PA VTI (mm) 22.13 30.68 0.012
PAT (ms) 16.18 8.94 0.002
PVR (mm2/s) 8.91 17.61 0.03
RVSP (mmHg) 16.01
WT (n¼3)
35.39 KO (n¼3)
0.0009
Bpm¼ beats per minute; LVAW¼ left ventricle anterior wall; LVID¼left ventricle internal diameter; LVPW¼left ventricle pos-terior wall; LV EF¼left ventricle ejection fraction; LV FS¼left ventricle fractional shortening; RVOT VTI ¼ right ventricular outflow tract velocity time index; RVID¼right ventricle internal diameter; RVAW ¼ right ventricle anterior wall; PA VTI¼pulmonary artery velocity time index; PAT¼pulmonary ar-tery acceleration time; PVR¼pulmonary vascular resistance.
Fig. 8eRight ventricular systolic pressure measured via direct cardiac puncture. RV systolic pressure is
to be directly assessed by measuring PA VTI and PA peak ve-locity. Furthermore, although we were unable to accurately calculate MPAP, we were able to provide an estimate of MPAP by calculating PAT. Also, we were able to document the effect of ongoing PAH on the RV, by visualizing significant RV dilation.
As this noninvasive technique does not require sacrifice of the mouse, it provides a novel manner to longitudinally monitor the development of PAH in Slit3 KO mice with CDH. As we simultaneously work to understand the mechanisms driving the pulmonary vascular remodeling that causes PAH in CDH, echocardiography allows a method through which mice can be assessed over time to track the progression of PAH, and if possible, potentially monitor for reversal of PAH with appropriate treatment. Currently, there is limited in-formation in the literature in general regarding right heart evaluation by echocardiography in the mouse, which through this study we demonstrate is indeed possible. Furthermore, the techniques described in this study can be used in a wider scope to investigate all murine models for pulmonary hypertension, further adding to the significance of this study.
A limitation to this method is that the mice required anesthesia. Fortunately, we have been able to limit the total procedural time to 10-15 min, minimizing the exposure of the mice to the anesthetic. We were also able to successfully anesthetize the mice with a low level of inhaled isoflurane, which has minimal cardiac side effects.14The mice were also
continuously monitored for evaluation of heart rate, breathing pattern, and response to toe-pinch, to assure that the mice were not deeply anesthetized. The heart rate in both groups of mice, WT and KO, were similar, suggesting an equivalent anesthetic effect that should not impede on echocardio-graphic measurements.
Conclusion
CDH is a relatively common congenital disorder with morbidity and mortality due to associated pulmonary hypo-plasia and PAH. The Slit3 KO mouse model is a reliable model with which to study PAH in the context of CDH. Transthoracic echocardiography reliably and accurately is able to assess altered pulmonary arterial flow and resultant right ventricular remodeling in the Slit3 mouse model for CDH. This noninva-sive method of assessment does not require sacrifice of the mouse and allows for a unique method to longitudinally study PAH in the context of CDH.
Acknowledgment
The authors would like to thank Dr Jennifer Whitham and Dr Scott Buck for their guidance in echocardiographic technique. The authors would also like to thank Dr. James Faber for technical assistance and overall guidance. They also would also like to greatly thank Maria Gambarian for her assistance in the care of the mice used in this study. This research was conducted under the aid of the UNC T32 Training Grant (grant
number T32GM008450) and the Robert Wood Johnson Harold Amos Faculty Development Program (67069).
Authors’ contribution: M.S. ([email protected]. edu) and S.E.M. ([email protected]) contributed for conception, design, experimentation, analysis and interpre-tation, and writing of the manuscript. M.R.P., (miphilli@unch. unc.edu) M.Q., ([email protected]), and G.S. ([email protected]) contributed for experimenta-tion and revision of the manuscript.
Disclosure
The authors report no proprietary or commercial interest in any product mentioned or concept discussed in this article.
r e f e r e n c e s
1. Wynn J, Krishnan U, Aspelund G, et al. Outcomes of congenital diaphragmatic hernia in the modern era of management.J Pediatr. 2013;163:
114e119.e1.
2. Dillon PW, Cilley RE, Mauger D, Zachary C, Meier A. The relationship of pulmonary artery pressure and survival in congenital diaphragmatic hernia.J Pediatr Surg.
2004;39:307e312. discussion 307-312.
3. Yuan W, Rao Y, Babiuk RP, Greer JJ, Wu JY, Ornitz DM. A genetic model for a central (septum transversum) congenital diaphragmatic hernia in mice lacking Slit3.Proc Natl Acad Sci U S A. 2003;100:5217e5222.
4. Taira Y, Yamataka T, Miyazaki E, Puri P. Adventitial changes in pulmonary vasculature in congenital diaphragmatic hernia complicated by pulmonary hypertension.J Pediatr Surg. 1998;33:382e387.
5. Thibault HB, Kurtz B, Raher MJ, et al. Noninvasive assessment of murine pulmonary arterial pressure: validation and application to models of pulmonary hypertension.Circ Cardiovasc Imaging. 2010;3:157e163.
6. McLaughlin VV, Archer SL, Badesch DB, et al. ACCF/AHA 2009 expert consensus document on pulmonary hypertension: a report of the American College of Cardiology Foundation Task Force on Expert Consensus Documents and the American Heart Association: developed in collaboration with the American College of Chest Physicians, American Thoracic Society, Inc., and the Pulmonary Hypertension Association.
Circulation. 2009;119:2250e2294.
7. Jones JE, Mendes L, Rudd MA, Russo G, Loscalzo J, Zhang YY. Serial noninvasive assessment of progressive pulmonary hypertension in a rat model.Am J Physiol Heart Circ Physiol. 2002;283:H364eH371.
8. Cheng HW, Fisch S, Cheng S, et al. Assessment of right ventricular structure and function in mouse model of pulmonary artery constriction by transthoracic echocardiography.J Vis Exp. 2014:e51041.
9. Abbas AE, Fortuin FD, Schiller NB, Appleton CP, Moreno CA, Lester SJ. A simple method for noninvasive estimation of pulmonary vascular resistance.J Am Coll Cardiol. 2003;41:1021e1027.
10.Granstam SO, Bjo¨rklund E, Wikstro¨m G, Roos MW. Use of echocardiographic pulmonary acceleration time and estimated vascular resistance for the evaluation of possible pulmonary hypertension.Cardiovasc Ultrasound. 2013;11:7.