Mengnan Wang. Design and Implement a New Remote Web-Based Visualization System for the Clinical Examination and Treatment of Skin Lesions. Evaluate the System Based on Interview Feedback. A Master’s Paper for the M.S. in I.S degree. April, 2019. 47 pages. Advisor: David Gotz
In the field of dermatology research, researchers commonly take pictures of the skin lesion area with traditional cameras and measure its size over time to determine the effectiveness of the treatment process. To revolutionize this current practice, along with the help of an application that takes 3D captures and AR measurements, the proposed web-based visualization system follows user-centric design principles to clean, re-structure, process, and present the collected raw data in an intuitive, interactive, simplistic, and responsive manner. The system couples state-of-the-art modern web development with a secure and robust logical server through application programming interfaces (API) designed following best practices in the industry. An evaluation study with five participants was conducted to assess certain design choices of the system. Subjective feedbacks on the system were positive overall, with suggestions toward certain detailed aspects of the system that can be implemented in future development.
Headings:
Data visualization
Electronic Health Records Web development
DESIGN AND IMPLEMENT A NEW REMOTE WEB-BASED VISUALIZATION SYSTEM FOR THE CLINICAL EXAMINATION AND TREATMENT OF SKIN
LESIONS. EVALUATE THE SYSTEM BASED ON INTERVIEW FEEDBACK
by Mengnan Wang
A Master’s paper submitted to the faculty of the School of Information and Library Science of the University of North Carolina at Chapel Hill
in partial fulfillment of the requirements for the degree of Master of Science in
Information Science.
Chapel Hill, North Carolina April 2019
Approved by
Table of Contents
Introduction ... 5
Rationale ... 5
Statement of Problem ... 6
Literature Review... 8
Information Systems ... 8
Medical Systems ... 8
Medical Data Visualization... 9
System Design ... 10
Technology Stack... 11
Evaluation ... 12
System Requirement ... 14
Target Audience and User-centricity ... 14
Data Description ... 15
Functionality Requirements ... 15
Design and Implementation ... 17
Data Source ... 17
User-centered Workflow ...20
Functionalities ... 22
Evaluation ... 33
Methodology ... 33
Results ... 35
Conclusion ... 37
Bibliography ... 39
Introduction
Rationale
As technology advances, more and more applications are generating data in the order of magnitudes we have never seen before. It’s quite beneficial in theory, but
sometimes not in practice. Professionals need to quickly locate and make use of the specific data they need regardless of the data size. How to properly manage, process and
present those data has become an emerging major field of study.
The healthcare industry is great examples of this. Large amounts of patient data are generated in the form of images, sound and video recordings, general document
records, frequently seen as symptom descriptions, diagnosis results, diagrams, test results, clinical notes and etc. Naturally, with larger datasets, we need ways to help
healthcare practitioners set to the information they need, when they need it, in a way that facilitates their tasks. A common issue in modern system infrastructure is that the amount of data became so tremendous that it is difficult to locate and see what is being stored and
to analyze desired data, sometimes even resulting in lower efficiency compared to not using these new digitalizing tools in the first place. Specifically, for the field of skin
Statement of Problem
This study investigates the design, implementation, and assessment of a
web-based skin lesion medical data management and visualization system. The system should enable users to view the skin lesion related medical data in an interactive manner,
automatically process the messy raw images so that they look clear and unified. Also,
with multiple patients, lesions and captures, managing their relationship became a problem. How to navigate, connect captures over time for the same patient lesion and
visualize the variation of the measurements were issues this proposed system strived to solve. The data will be acquired from an upstream application, which makes use of a 3D camera and a segmentation server to identify the lesion area and segment it from the
background, then return various measurements of the skin lesion along with image and mask. This system is designed to facilitate the use of the aforementioned application by
visualizing the raw data into a more user-friendly presentation.
Design and implementation of the system involve several fields of study. As a visualization system that focuses on medical data, especially images, general guidelines
of medical data are followed when processing and preserving such data during the development process. To achieve better efficiency on the system, a well-structured data
model was designed in the system. As the system also has to preprocess images in the backend before visualizing them in the frontend, image processing is also one of the major focuses. Visualization of the skin lesion data uses state-of-the-art visualization
tools to create intuitive charts and tables to better display the medical records.
visualization along with automated backend processing, communicating through best practice API design.
Literature Review
Information Systems
Information systems have been around ever since the rise of modern computation devices. Researches around it have then become mainstream. Information systems
research is generally interdisciplinary concerned with the study of the effects of
information systems on the behavior of individuals, groups, and organizations. Generally,
researches are categorized into behavioral science and design science. (Von Alan et al., 2004) This particular study looks into research activities involving building an artifact to perform certain tasks through the information system and evaluating the artifact to
determine its effectiveness.
Medical Systems
Currently, electronic health records (EHR) are widely adopted in medical
practices, with the majority of the physicians using EHR giving positive feedbacks to it (The Office of the National Coordinator for Health Information Technology, 2011). And
yet in the field of dermatology, medical practitioners were significantly less likely to adopt this technology (Grinspan, 2013). However, the work process in this field tends to be flexible in some sense, as there’s no fixed process of conducting the diagnosis and
management technologies, further motivating their increased usage in the healthcare domain. (Reijers, Russell, Van der Geer, and Krekels, 2009). Thus encouraging the use of
systematic management in this field.
In the scope of dermatology, a critical part of it is to regularly examine the size of the lesion area so as to identify the medication effectiveness during the treatment period.
Doctors could then make adjustments to the prescription accordingly. As more and more technologies are engaging in medical practices, it seems a bit outdated if the nurses are
still using traditional methods to measure the size and volume of the affected area.
Technological approaches should be, and some have even been proven useful in this area.
As a matter of fact, different attempts such as AI driven skin lesion analysis was researched and even tested out in practice (Korotkov, and Garcia, 2012). Similar to Korotkov’s research, the application that collects data for this study uses AI driven image
processing technology to segment lesion area from the background. Technical detail about the application will be discussed in later sections.
Medical Data Visualization
Existing practices like the Omaha System (Lee, 2018) and Gregson’s trials (2015) are representing state-of-art developments of visualization in the medical area. These are
great examples of this proposed system to learn from. Clinical records by nature contain longitudinal data of patient visits over time, with records of changing problems,
medications, treatments, and responses related to evolving health status. Graphs are
routinely used to illustrate data in a way that comparisons, trends, and associations can be easily understood (West, 2014). The data over time nature of medical data inspires the
timely manner. For instance, dermatologists may put their focus on the size of the infected area, and compare this data over time, and that’s the feature EHRs should
include.
System Design
The system design process can make use of these successful examples, one of the
designs that can be adopted is to separate the presentation and processing. Norman & Draper (1986) summarized that in research on interface design, we frequently allude to
the creation of environments for enhanced interaction and problem-solving. Similarly, we often distinguish the aesthetics of an interface from its functionality, and we emphasize the importance of the satisfaction of a human user as a criterion for evaluation rather than
the objective analysis of the technological power of a particular system. Hence it makes sense to separate the functional design and the interface design into two sections of the
system design in this study.
Presentation wise, it was shown that users clearly preferred an easy to learn and understandable design with familiar visualizations (Pohl et al., 2011), which inspired the
design of this proposed system to have minimal UI components so as to reduce user learning cost.
Processing wise, before the data can be visualized, all images need to be processed so that they can appear to be on the same scale. Image processing in the medical field is also a well-studied area. Generally, processing dermatological images are
more about the segmentation of the affected area or enhancing the quality of the image (Dougherty, 2009). Whereas in this specific application, more focus is given to mapping
Additionally, the idea of user-centered design sparked decades ago and it is still widely used in current application and system designs. Functionality design of this
web-based medical data management system follows this as well. The goal of this project is to develop a state-of-art responsive web system to enable those features. Web development is the basis of the project. For years, online patient-accessible systems for clinical data
display and storage has been used in practice (Dickerson et al., 2004). However, the interface and design pattern seems outdated somehow. This project aims to apply the
latest web technology to the clinical care process, in order to achieve an enhanced workflow.
Technology Stack
For system implementation, several prevalent technologies were investigated to find the best fit for this system. As said before, separating presentation and processing in
this case, means having both a client-side application, which runs on the browser in different platform and requires a modern framework to ensure scalability, security and efficiency purposes, as well as a server application to do the processing. VueJs and
ReactJs are being considered for this project in the client application. As a result of being lightweight and relatively less time-consuming to develop (Macrae, 2018), Vue turned
out to be a better fit for this task.
Server-side application is in charge of handling client authentication, requests and the processing of data. One of the major tasks of the system is to process medical data in
JSON format on its server, and there are several options of language to achieve this purpose like PHP, Java, and Python. PHP has some problems compared to others. Its very
programmers from security vulnerabilities (Holovaty & Kaplan-Moss, 2009). Flask and Django made it possible to use python for backend server applications (Grinberg,
2018).
Server application and client application communicate through HTTP requests and responses, those messages sent via both sides should obey a certain type of pattern to
make sure extensibility and uniformity. The RESTful API design is the most recognized design used in the industry (Pautasso, Zimmermann and Leymann, 2008). This project
will employ REST for API designs.
Evaluation
Zahabi et al. (2015) suggested that for Electronic Medical Records (EMR),
comparison of different versions of existing EMRs from a usability perspective is a good practice. Such analysis might reveal usability limitations that would otherwise be
overseen when comparing an EMR design to use of paper-based records. This provides a guideline for how to conduct the interviews for evaluating the system. A proper way to judge a system’s capability is to conduct a comprehensive evaluation.
Evaluations toward modern web-based systems, especially for medical systems are also instructive for this study. A clinical data system should have its main focuses on
presenting the data accurately and timely (Pieczkiewicz and Finkelstein, 2010). To evaluate the performance of the system in terms of these goals, certain forms of user-involved assessment will be required. According to Wu et al. (2019), evaluation studies
on data visualization and visual analytics in healthcare tend to (1) use task-based measurements, user feedback, and surveys with both qualitative responses and scoring
analytics systems in a clinical environment. This instructs this study to use a semi-structured interview to conduct performance evaluation and to get feedback from
participants, focusing on task-based measurements and user feedbacks. Clinical
assessment and lab setting scoring could not be included due to resource constraints. User testing and heuristic analysis were found to be complementary and should not be
competing. In order for better evaluation results, both user testing and heuristic analysis are still needed. (Tan, Liu & Bishu, 2009). Details will be discussed in the methodology
System Requirement
Target Audience and User-centricity
The target audience of this proposed system is mainly medical professionals that focus on skin diseases, dermatologists and dermatological researchers mostly. This group
of users usually possess skills related to treatment or research on certain skin diseases. One common thing they do each time the patient pays a visit is to use a traditional DSLR
camera to take pictures of the infected area, and then use professional tools to take the measurement of the area of the skin lesion area in metric units. Then, they will record these measurements into a data storage system (e.g. Excel), that already contains the
basic information of the patient. The target users also need to manually crop the images into the same size and shape (usually square), which means all the image captures should
appear in the same scale (e.g. one edge of the square represents 50 millimeters in the real world), for easier comparison. Without any automated visualization systems or tools, researchers have to manually create charts and graphs using the collected data every time
for treatment experiment analysis.
With the user needs clearly recognized, the system has to be developed around the
Data Description
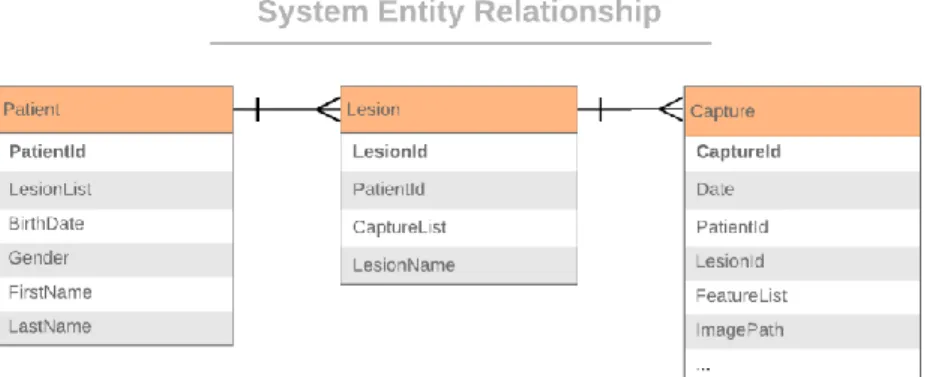
Figure 1 System entity relationship diagram
The data this proposed system needs to deal with mainly fall into three types. Basic information of the patient, measurements of the skin lesion area and the images taken for the lesions. These data are used by the target users to evaluate and judge the
effectiveness of a certain type of treatment experiment. Regardless of the exact format or storage solution, these three types of data are integral to the process. Details will be
discussed in the data source section.
Functionality Requirements
The general function that this proposed system has to meet is to simplify and
automate the user’s workflow of (1) taking pictures of the lesion; (2) taking the measurement; (3) recording and storing patient information data, captures and
measurement data; (4) categorize and archive the data; (5) process and crop images to scale; (6) create graphs and tables of data over time; (7) evaluate the results.
In this process, the upstream application takes care of the first three steps, and this
Data categorization and archive. With the help of the upstream application, the system would have access to raw data regarding the three types of information, and it
needs to clean, process, re-arrange, categorize the data. The final result should be a clearly structured data repository within the system, uniformly and securely archived.
Capture image processing. Different from the traditional approach, images captured for this system are not as high quality as pictures taken with DSLR. However, there are also 3D capabilities in these captures, which brings more possibilities. The
system will have to automate the process of cropping the images with the help of 3D information gathered. The final result of this should be capture images cropped to the
same scale, making it easier for one-to-one comparison.
Over time data visualization. To help users compare and evaluate the sizes measured, there have to be ways to present the data that allows intuitive visualized
comparison. Line charts and tables with histograms approaches were taken for this purpose. The final result should be responsive charts that emphasize on the changes and
trends of the data; dynamic tables that emphasizes on the overall data summary; an innovative tool that helps to compare same-scale capture images over time.
Evaluate results. With the data and tools in place. The users need a well-structured flow design to conduct these tasks. It could either be the linear process as described before, or it could take advantage of the technology capabilities of web-based
Design and Implementation
Data Source
Raw data for this system is provided by an application developed to take captures of skin lesions and using an Intel RealSense Camera to measure the size of the lesion
area. The camera uses a regular color camera and an inferred camera with inferred dot projector to capture the 3D image. Then the image was sent to a dedicated segmentation
server running a Convolutional Neural Network trained with Tensorflow. Segmentation returns a mask image and coordination of the lesion area, which is used to map to the 3D image capture and to calculate the measurement of the skin lesion.
Figure 2 Example capture and the mask image
All the data outputs are stored in a single folder, with one JSON file for each patient, along with subfolders that contain the image captures in JPEG format. The 3D
images are stored as point-clouds inside the JSON file.
The data model of the system follows a similar structure as the raw data.
whole entity objects in this system, the entities on each side still follow the same structure and relationship.
User Interface
The user interface design of this project strives to mimic popular web system designs to make sure there’s the least amount of learning cost for users to get used to this
system.
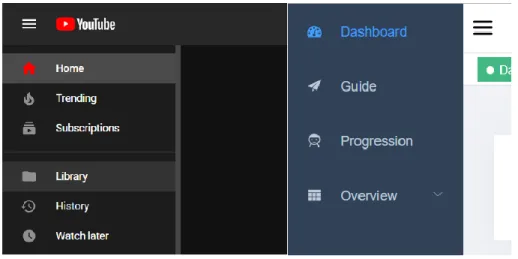
Figure 3 Sidebar navigation from Youtube.com and the proposed system
Routing and Navigation within the system are done in three different ways. The main entrance is from the sidebar menu, which is similar to Google YouTube’s
collapsible sidebar design, offering clear structure and navigation as well as more screen
real estate whenever needed. Another place user can use to navigate is the breadcrumbs on top of each page. This provides a structural view of where the visiting page locates in
the routing structure, as it displays parent routing all the way through the root. The last design for routing and navigation is the tabs. Inspired by mainstream browsers, the tab-like design allows users to open multiple tabs within the same window, and keep their
Understanding Vue Router and Managing the routing of this system turned out to be one of the most challenging tasks during implementation. All the routing structure
are defined inside one file, each route is defined as an object, which will be referred to during rendering, pointing the routing path to the related component. With the help of Vue Router, this process can be done with ease.
Responsive layout. Another major criterion of a robust UI design is its
responsiveness to different devices. As a web-based system, browsers are the ones who
execute the client application. To be adaptive in different device aspect ratios, the system was optimized in a way that it will adjust the size and layout of different components
within one page to take advantage of most of the screen real estate. Currently, the system supports 4:3, 16:9, 16:10 and 21:9 (ultrawide) aspect ratios through maintaining a
responsive layout template as the root component, then loading sub-components onto it.
Additionally, several responsive components like the patient card and dashboard card have different width settings in different device resolutions.
Style. The styling of the system determines what the color scheme, fonts, icons, buttons in this system should look like. Adapting the styles of most prevalent designs, this system put focuses on consistency and efficiency when designing its style.
Consistency within the system is ensured by using the same icon library, the same level of shadow, same font and the same type of animation throughout.
Efficiency is achieved by using less verbal explanation and use
User-centered Workflow
As mentioned in the literature review, the most adopted design in systems and
applications is user-oriented. Which means putting user’s need up front and let user requirements drive the design process. The workflow designed for this system was changed several times due to this matter. The very first prototype of the system was not a
user-driven workflow design. The workflow involved features like a text editor, image cropper, to-do lists and etc. In the following development of the system, which follows
user-centric design, it was realized that some of the features, while well-designed and implemented, seems not quite relevant to the process described in the system
requirement, and eventually, only the core functionalities that are closely related to the
intended task requirements are kept in the system to accomplish better ease of use.
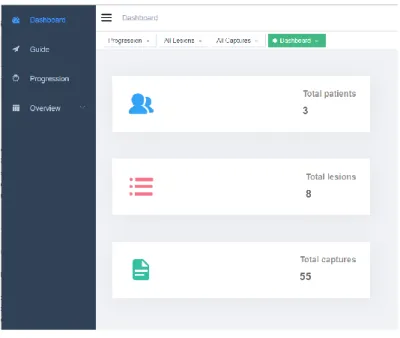
Figure 4 System dashboard
As discussed in system requirement section, the dashboard of the system subtly
using the system. The design and implementation provided options for users to use the system in the way they want as well as provide functionalities that meet their needs in the
treatment and research process.
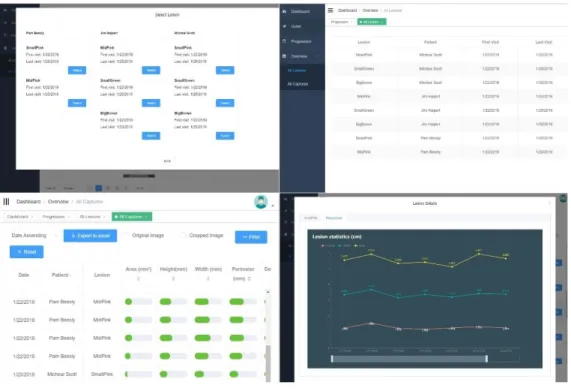
Figure 5 System workflow
The final workflow design kept pages to present lesion details in both webpage format and table format; pages to present capture details in both tabs navigated widgets and in dynamic tables; pages containing patient cards that show summary data for each
patient; a dashboard page of total number of patients, lesions and captures as the landing page of the system. From the dashboard cards, the user can start with patient selection
Functionalities
APIs. Communication between the client and server application are accomplished through HTTP requests. Uniformity and simplicity are the characteristics to look for during API design. This system uses the RESTful API design which essentially means to design the APIs in a way that uses HTTP as what it was designed to be. HTTP requests
fall into categories like GET, POST, UPDATE, DELETE, OPTION and etc. In RESTful API design practices, GET requests should be the ones that fetch information from the
server; POST requests send data to the server, and usually, this type of data will be logged into the storage system, like posting a new article or submitting a form.
Additionally, the API Universal Resource Locators (URLs) also follow a certain
scheme. In this system, API URLs starts with “/api/” to differ from other URLs, and the first path should be the data object that this request deals with, then follows the request
name. For instance, the request to fetch one single patient information with a known patient ID should be a GET request on
“http://serveraddress:port/api/patient/info?patientId=123456”. This design guarantees the
APIs in the system are easy to read, simple and unified.
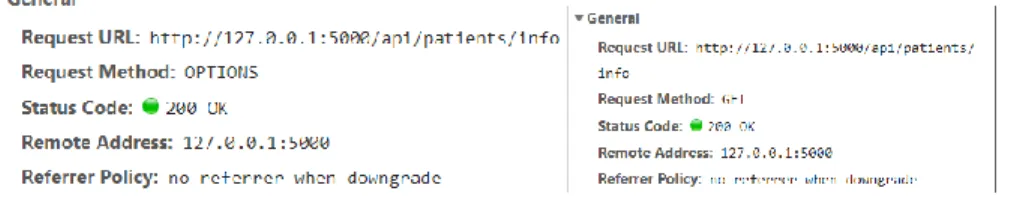
The server application not only has to provide APIs for frontend use, but it also
has to make sure the server would allow such request to be made. In the development environment, the client application and the server application are running on different ports. Without any configuration, the server will only take requests from the exact same
Data cleaning. The raw data have to be preprocessed before it can be presented. This is done whenever the server application starts. The preprocessing is
wrapped inside one single function, so it could be exposed to frontend as an API in future development if needed.
Data preprocess first drop any of the data that is not in use in the system like the
3D point cloud gathered with the 3D camera. The sheer amount of point cloud data is enormous enough to slow down the whole system significantly, so it has to go. Then the
data will be reformatted into the designed data structure in the data model section. Redundant data will be dropped, and unnecessarily long measurements will be trimmed.
User authentication. Before entering any system, a robust and secure user login page is much needed to make sure the security of the data and the whole system. To achieve this, it has to be a joint effort of both the client and the server. The key issue is to
make sure that both sides are synced about whether the user has logged in or not. To initiate the login, the input username and password will be sent to the server,
preferably through HTTPS, and the server will look for the matching username and use SHA-256 algorithm to encrypt the password and compare it to the result stored. If there’s a match, it returns a message to the client application, and stores the user ID and the
message in the session. And when the client receives the message, it’ll keep it and send this back to the server as a token before each request, making sure the login status
Figure 6 Before-each request and the following request
When the user accounts are created, two different groups were set. This group
attribute will be returned from the server once logged in. The client application will then use this attribute to match with the access control set in the routing logic, to make sure
users within one user group only see pages they have access to. This design is currently used to serve the purpose of separating developer access and user access, and could also be extended to user access and administrator access in future developments.
Error handling. Before reaching any core features of the system, it’s inevitable to have errors during use. Because in the browser environment, in the case where users
change the URL, it’s easy to land on a page that does not exist. A 404 page was made to serve the purpose of informing users that this page doesn’t exist and to provide a way to route back.
Componentization. One of the benefits brought by Vue framework is the
introduction of components. Components are similar to the definition of classes in
object-oriented programming languages. In a single Vue file, there would be up to three blocks of logic, template tag wraps all the HTML code that is responsible for holding up the basic structure of what is being presented in this component. Script tag wraps the data
and logic behind the view written in JavaScript and is usually the most sophisticated part of any component. Lastly, there’s style, wrapping CSS that helps to format and
Every Vue project has an App component, which acts as the root component of the whole project. Other individual components will be loaded onto App.vue during
rendering.
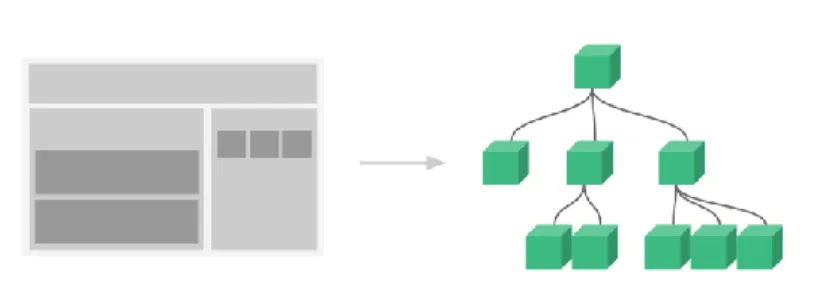
Figure 7 Correspondent relationship between webpage view elements and VUE components
Componentization, to some extent, can be seen as the process of packing up small units into a library. What this really helps in terms of development, is to significantly
structuralize the frontend. Instead of messy webpages, now there are well-defined and structured components, which can be imported from and to each other. Each component
could be a functioning individual itself, which will result in a single page, or it could act as a tool to deal with whatever data fed to it, like a widget.
Looking at a single page, the things shown inside the page are very likely to be
written in several different components. The idea of separating parts into components is to ensure extensibility and reusability. Take the Lesion Detail widow in this project as an
example, this is a widget-type component which uses a tab design. On the very top, there’s a tab for the lesion and progression. Lesion tab shows all the captures and
measurement data related to this particular lesion categorized by date. The progression
tab presents a responsive line chart that shows all the measurement data over time, which gives the user a clear concept of the lesion’s size change. Inside the lesion tab, the sorted
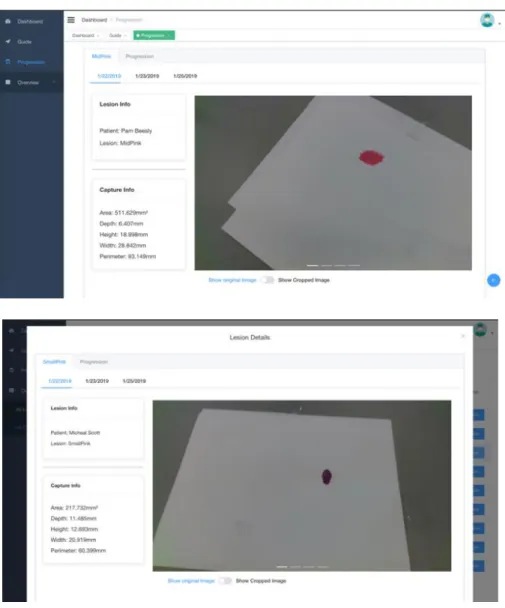
Figure 8 Lesion Detail component used in different pages
So eventually, for the page Progression, in addition to itself being one component, it also contains a patient selection component and a Lesion Detail component. And the
Lesion Detail component contains a line chart component as the second tab. The benefit of this design is threefold. First of all, this reduces the amount of repetitive code for the same task. For instance, in the all lesion overview page, there’s a feature to allow users to
component is used in both progression page and capture table page as a pop-up element (as shown in Figure 8). Secondly, the component was configurable when
imported, creating a responsive component that changes along with the data. Thirdly, it reduces the load of pages. Components, although all inside the same page, could be only loaded when needed through the lazy loading mechanism. This is extremely beneficial to
the overall system efficiency and is a big part of the system optimization.
Lazy loading. As the scale of the project grows, sometimes there’s just too much going on within a single page. Without any sort of componentization, the page has to load all the related data and view models when the page is entered. Obviously, this makes no
sense in modern web design. Ideally, we would like the data to be only accessed when we need them, as well as the page elements. And with the help of Vue, this is exactly the way it was done in this project.
Figure 9 Example data in dynamic capture table
Taking the All Capture overview as an example. To check the details of any
individual lesion, the detail button will call up the Lesion Detail component pop-up, which is shown in Figure 8. During import of the Lesion Detail component, it’s set with lazy load configuration, therefore this specific component will not be loaded until the
user interacts with this. As for data, it will not be requested until the Lesion Detail
component starts loading. Similarly, chart components are loaded in the same way. All of
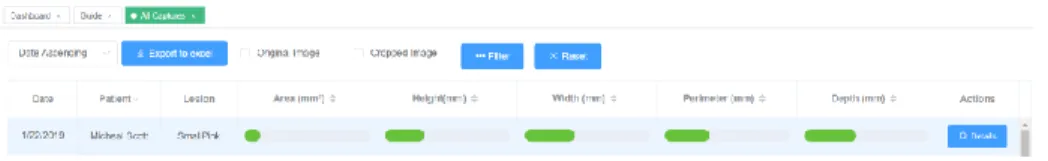
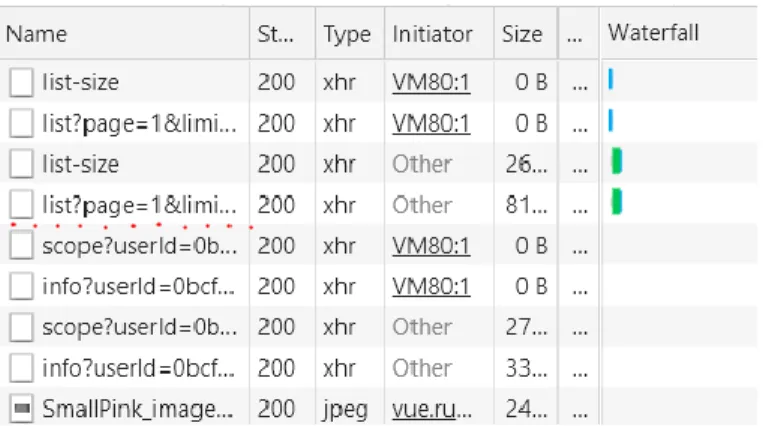
Figure 10 Requests made by the client application recorded with Chrome developer tools (from loading dynamic table to loading one lesion detail)
As shown in Figure 10, the first four requests the client application made was
about retrieving data for the table. And after the user clicks the detail button, we see the rest of the requests regarding details of a specific lesion. This demonstrates how lazy loading mechanism helps to reduce the stress of the system.
Keep alive. On the other hand, there are times that we do not want the progress to be erased when that page is not seen. Particularly with the tab design in this system, we would want to keep the progress of each tab when users open multiple tabs, in order to
reduce repetitive data requests and achieve better workflow. This is where keep-alive is introduced to the system. By employing this mechanism, components with this setting
will be cached, this way, the progress of this page can be kept until the tab is closed by users, and the content of this page can be accessed much faster.
Image process. Capture images are one of the things to focus on the backend. The goal of this task is to crop the captures according to the measurement and
segmentation data. The general strategy of this task is to use some data to map the pixel
of metric measurement user inputs and where exactly the lesion is located inside the image.
Figure 11 Lesion Detail page showing the original image
Figure 12 Lesion Detail page showing the cropped image, with a slider for scope selection
So, the inputs acquired for this feature are (1) a single user input scale in metric units; (2) pixel to metric ratios across different captures; (3) lesion locations in pixel
was one of the reasons that encouraged the server application to use python as discussed in the literature review section.
Measurement data visualization. The measurement data acquired from the raw data file is bulky. The system presents it in three different manners for different purposes. The first one being the detailed measurements shown right next to the captured image.
Figure 13 Comprehensive dynamic capture table
Figure 14 Dynamic table after added capture column and showing patient filtering tab
Secondly, as shown in Figure 14, a comprehensive dynamic table presents all the
tooltips when cursor hovering on top. Measurement data visualized in this manner gives a clear view of the overall size of lesions. The sorting feature allows users to
quickly find the maximum and minimum data, which could help locate lesions of interests. Dynamically changing columns can include or exclude images. This is one of the designs to reduce unnecessary requests and data download. Finally, all the raw data
can be exported into a single Excel file with one click, further facilitating the research workflow.
Figure 15 Pagination widget
As the amount of capture data is rather significant inside the system, a proper
pagination mechanism was designed to dynamically decide how much data should be retrieved from the server. The client first sends a GET request inquiring about the overall size of the captured data with a parameter stating the how many captures user would like
to present in one page, then the server will return the pagination information concerning how many pages there are according to this setting and return the desired capture data.
Finally, the client will present the data and update the pagination at the bottom of the page (shown in Figure 15). This design also facilitates to reduce the unnecessary loading in this page, especially when all the optional columns are included, the image data size
Figure 16 Example data presented in an interactive chart
Charts are the third method to visualize the data. Unlike the table, the chart only
shows measurement data of single lesion over time. With the help of Echart library, an animated line chart allows users to zoom in or out and focus on a certain region of data. Hide/unhide any data line by clicking the legend can help users concentrate on any
certain type of measurement. This chart could possibly be the most useful tool in terms of evaluating the treatment effect in the system.
Evaluation
Methodology
General Strategy. This research mainly focuses on the newly designed system’s effectiveness in assisting the dermatological clinical research process. More specifically,
evaluating the system based on the feedback from study participants for the usefulness of functionalities and the instructiveness and usability of the overall user interface design.
The methods being chosen for this study will be a semi-structured interview. The interview aims to get feedback from general web-system users of the implementation and design of the system. Interviews with five individual participants were conducted and the
collected data and feedback were used to make assessments and improvements on the system.
Sampling. The sample subject for this research is web-system users. The sampling method will be convenience sampling due to convenience and feasibility. The subjects will likely to be selected from UNC students.
Five individuals from UNC will be chosen to participate in the interview. The researcher will reach out to UNC students via email by sending recruitment email to
SILS-master list and participants will be compensated with gift card incentives. Data collection. The process of semi-structured interviews mainly consists of three parts. Firstly, the interviewer will show the consent letter to the interviewee, after
design features and the purpose it serves. Then, the interviewer will ask the interviewee to use the system and get familiar with it for a certain time and try to
discover as many features of the system as possible. During this process, they will be asked to follow the think-aloud protocol, saying their thoughts in the meantime they browse through it. Lastly, a few scripted and unscripted questions will be asked to get
feedback about certain aspects of the system.
During the interview process, both interviewer and interviewee will be looking at
the same version of the online system through the Chrome browser to ensure a controlled environment. The interview process will be screen and audio recorded, which is also
specifically mentioned in the consent form. The interviewer will take notes of the feedback from the interviewee.
Data analysis. The feedback data will be analyzed to conclude different points for improving the system. The users’ actions in the system will be analyzed, places that
confuse the interviewee will be given more attention during the improvement. The order
of navigation being clicked, usage of certain elements, words they say during think-aloud, and features discovered or undiscovered will be analyzed as the result of the interview.
Potential limitation. The interviews were conducted using one exact same device. However, in real user usage, the devices running the system may differ in screen
size, input (touch screen or not), resolution, aspect ratio and network status. This may affect the interview and feedbacks’ applicability to real user’s experience.
The data used for interview sessions were mock data, there could be differences
Most importantly, the participants for the interview are not medical
professionals that are familiar with skin lesion treatment. Their input would be surely
useful for general web system evaluation, but not necessarily instructive toward medical workflow design. The idea of user-centricity is to get as much target user involvement in the research and development process as possible. The target user’s actual need should be
the major factor that drives the development and should be met in the system. In this case, where actual users were not able to be involved in the development process or be
the evaluation participants, the system is surely limited by this and requires future development with actual user’s inputs in order to be more user-centered.
Results
Five participants were selected to be interviewed in regard to the usability of the system. And there are several findings discovered upon analyzing the collected data.
Guide page is designed to provide some guiding information about how to use the system. Its navigation link is at the second place in the sidebar. Only one of the
participants chose to look at the guide first. After being asked about this, one of the
answers is that the page link is not shown at first sight. The other reason mentioned by three participants is that they don’t necessarily want to look at the guide for the system
first, or even at all. They would like to discover what it can do by themselves. Compared to a lengthy verbal instruction, they would much prefer self-explanatory features or features that are demonstrated with animations or icons. This suggests the system make
Participants’ reaction to navigation and multi-tab design was another
interesting point in the interview results. All of the participants instantly figured out how
the navigation works, even collapsing the sidebar to use more screen for content. But only two realized the tab design was actually tabs of pages that help to multitask. Follow up questions about the multi-tab design concluded the reason to be that, firstly, this is a
rather new design that they had not seen before, plus that the tabs are not connected with the page, which is different from the browser’s tab design, thus causing the confusion. A
connected tab and page design might yield better usability result for this matter.
As discussed in user-centered workflow section, users can choose either a linear
process or a multitasking process from tabs to complete tasks. Participants were asked to try out these two methods and comment on them. All of the participants gave positive feedback on keeping both methods of using the system.
Lastly, charts in the system are only accessible within the Lesion Detail component. This was pointed out in the interviews and participants were asked for
suggestions about an alternative location for the charts. None of the participants suggest any other location than the current one. It’s preferred to have the chart right next to the captures so that it’s fast and easy to jump between. One of the participants suggested the
Conclusion
The proposed system, according to evaluation results, achieved the goal to enhance the workflow efficiency of the targeted dermatitis research process. The
innovative visualization system was designed and tested around users' needs, automating the real workflow process with advanced technologies.
User-centered designs impelled the system to adopt an optimized workflow that
matches the target user’s researching process. The system workflow completely
automated the capture, measure, record, archive, crop, and visualize process into a single
platform, providing both linear working and multitasking capabilities. Additionally, users are given freedom over how they want the data to be processed and visualized through various controls and visual representations.
State-of-the-art technologies are applied to the implementation of this system. Modern web development framework inspired by the Model-View-Controller principle facilitated the quick build of the client application in a relatively short period of time. To
maintain a light-weight project scale as well as ensuring security, scalability, and reusability, data processing is separated and implemented solely in a logical server that
System evaluation through semi-structured interviews acquired positive
subjective opinions overall. Several design suggestions were given and could be adopted
in future developments. Due to time and resource constraints, the participants’
demographic remained incomprehensive, compromising target user-centricity to a certain extent.
Bibliography
Dickerson, S., Reinhart, A. M., Feeley, T. H., Bidani, R., Rich, E., Garg, V. K., & Hershey, C. O. (2004). Patient Internet use for health information at three urban
primary care clinics. Journal of the American Medical Informatics Association, 11(6), 499-504.
Dougherty, G. (2009). Digital image processing for medical applications. Cambridge
University Press.
Gregson, C. (2015). Clinical trial data visualization. Trials, 16(2), P187.
Grinberg, M. (2018). Flask web development: developing web applications with python. " O'Reilly Media, Inc.".
Grinspan, Z. M., Banerjee, S., Kaushal, R., & Kern, L. M. (2013). Physician specialty
and variations in adoption of electronic health records. Applied clinical informatics, 4(02), 225-240.
Holovaty, A., & Kaplan-Moss, J. (2009). The definitive guide to Django: Web
development done right. Apress.
Korotkov, K., & Garcia, R. (2012). Computerized analysis of pigmented skin lesions: a
Lee, S., Kim, E., & Monsen, K. A. (2015). Public health nurse perceptions of Omaha System data visualization. International journal of medical informatics, 84(10),
826-834.
Pautasso, C., Zimmermann, O., & Leymann, F. (2008, April). Restful web services vs. big'web services: making the right architectural decision. In Proceedings of the
17th international conference on World Wide Web (pp. 805-814). ACM. Pieczkiewicz, D. S., & Finkelstein, S. M. (2010). Evaluating the decision accuracy and
speed of clinical data visualizations. Journal of the American Medical Informatics Association, 17(2), 178-181.
Pohl, M., Wiltner, S., Rind, A., Aigner, W., Miksch, S., Turic, T., & Drexler, F. (2011, September). Patient development at a glance: An evaluation of a medical data visualization. In IFIP Conference on Human-Computer Interaction (pp. 292-299).
Springer, Berlin, Heidelberg.
Reijers, H. A., Russell, N., Van der Geer, S., & Krekels, G. A. (2009, September).
Workflow for healthcare: A methodology for realizing flexible medical treatment processes. In International Conference on Business Process Management (pp. 593-604). Springer, Berlin, Heidelberg.
Tan, W. S., Liu, D., & Bishu, R. (2009). Web evaluation: Heuristic evaluation vs. user testing. International Journal of Industrial Ergonomics, 39(4), 621-627.
The Office of the National Coordinator for Health Information Technology (2011). EHR Impacts for Physician Practices. Retrieved from
Von Alan, R. H., March, S. T., Park, J., & Ram, S. (2004). Design science in information systems research. MIS Quarterly, 28(1), 75-105.
West, V. L., Borland, D., & Hammond, W. E. (2014). Innovative information
visualization of electronic health record data: a systematic review. Journal of the American Medical Informatics Association, 22(2), 330-339.
Wu, D. T., Chen, A. T., Manning, J. D., Levy-Fix, G., Backonja, U., Borland, D., ... & Kandaswamy, S. (2019). Evaluating visual analytics for health informatics
applications: a systematic review from the American Medical Informatics
Association Visual Analytics Working Group Task Force on Evaluation. Journal
of the American Medical Informatics Association, 26(4), 314-323.
Zahabi, M., Kaber, D. B., & Swangnetr, M. (2015). Usability and safety in electronic medical records interface design: a review of recent literature and guideline
Appendix
University of North Carolina at Chapel Hill Consent to Participate in a Research Study Adult Participants
Consent Form Version Date: ___02/22/2019___ IRB Study # 18-3286
Title of Study: Design, implement, and evaluate a new remote web-based visualization system for the clinical examination and treatment of skin lesions. Evaluate system's performance base on feedback
Principal Investigator: Nick Wang
Principal Investigator Department: School of Information and Library Science Principal Investigator Phone number: (919)-593-1493
Principal Investigator Email Address: [email protected] Faculty Advisor: David Gotz
Concise Summary
The purpose of this study is to test out and evaluate the functionalities in the Progression-System. The information we learn by doing this study may help us to evaluate and enhance the system during future endeavors.
Participants in this study will be given a short introduction of the system of what it does, and what the general structure is, then participants will be asked to perform several tasks on the system within certain time limit. An interview questionnaire will be given to participants to fill out after the tasks are finished or time limit runs out. During the interview process, the device screen and audio will be recorded for data collection. The data collected will not be labeled with any personal information of the participant. There is a very little chance of the collected data being compromised. However, it is virtually impossible to trace back to any of the participants with the collected data.
If you are interested in learning more about this study, please continue to read below.
What are some general things you should know about research studies?
You are being asked to take part in a research study. To join the study is voluntary. You may choose not to participate, or you may withdraw your consent to be in the study, for any reason, without penalty.
Research studies are designed to obtain new knowledge. This new information may help people in the future. You may not receive any direct benefit from being in the research study. There also may be risks to being in research studies.
Details about this study are discussed below. It is important that you understand this information so that you can make an informed choice about being in this research study. You will be given a copy of this consent form. You should ask the researchers named above, or staff members who may assist them, any questions you have about this study at any time.
What is the purpose of this study?
Are there any reasons you should not be in this study?
You will not be able to participate this study if you do not wish to have your interview screen and audio recorded.
How many people will take part in this study?
There will be approximately 5 people in this research study.
How long will your part in this study last?
You will have to participate the one-time interview for approximately 30 minutes. There will be no further requirement for participation of this study. However, you are welcome to reach out to us with questions and suggestions for the study.
The raw data collected during the study will be deleted after the analysis is complete.
What will happen if you take part in the study? Overall design:
o Participant read through and sign consent letter o System introduction by interviewer
o Interviewer present a page of several tasks to participant o Participant perform tasks on the system accordingly o Task complete/time up, participant complete questionnaire What are the possible benefits from being in this study?
Research is designed to benefit society by gaining new knowledge. You will not benefit personally from being in this research study.
What are the possible risks or discomforts involved from being in this study? There may be uncommon or previously unknown risks. You should report any problems to the researcher.
What if we learn about new findings or information during the study?
You will be given any new information gained during the course of the study that might affect your willingness to continue your participation.
How will information about you be protected?
Although every effort will be made to keep research records private, there may be
times when federal or state law requires the disclosure of such records, including personal information. This is very unlikely, but if disclosure is ever required, UNC-Chapel Hill will take steps allowable by law to protect the privacy of personal information. In some cases, your information in this research study could be reviewed by representatives of the University, research sponsors, or government agencies (for example, the FDA) for purposes such as quality control or safety.
• All information will remain strictly confidential. The descriptions and findings may be used to help improve the Progression System.
• At no time will your name or any other identification be used. Your responses to the questionnaire will be stored offline in a password protected device, associated with an ID number.
• Only the researcher will have access to that data through password protection.
• After the conclusion of the study, the data will be permanently removed from those servers.
• Your mouse movements, typing, and voice will be recorded by QuickTime recording software on the computer you will use during the study. Your face or image will not be recorded. The audio recordings will only be used to reference during the analysis phase of the study, but the team may use direct quotes or screen capture from your participation if they are relevant to the area of study and could not be used to identify you.
Check the line that best matches your choice: _____ OK to record me during the study
_____ Not OK to record me during the study
What will happen if you are injured by this research?
All research involves a chance that something bad might happen to you. This may include the risk of personal injury. In spite of all safety measures, you might develop a reaction or injury from being in this study. If such problems occur, the researchers will help you get medical care, but any costs for the medical care will be billed to you and/or your insurance company. The University of North Carolina at Chapel Hill has not set aside funds to pay you for any such reactions or injuries, or for the related medical care. You do not give up any of your legal rights by signing this form.
What if you want to stop before your part in the study is complete?
Will you receive anything for being in this study?
You will be receiving a $10 Amazon gift card for taking part in this study. Any payment provided for participation in this study may be subject to applicable tax withholding obligations.
Will it cost you anything to be in this study? It will not cost you anything to be in this study. What if you are a UNC employee?
Taking part in this research is not a part of your University duties, and refusing will not affect your job. You will not be offered or receive any special job-related consideration if you take part in this research.
What if you have questions about this study?
You have the right to ask, and have answered, any questions you may have about this research. If you have questions about the study (including payments), complaints, concerns, or if a research-related injury occurs, you should contact the researchers listed on the first page of this form.
What if you have questions about your rights as a research participant?
Participant’s Agreement:
I have read the information provided above. I have asked all the questions I have at this time. I voluntarily agree to participate in this research study.
______________________________________________________ Signature of Research Participant
____________________ Date
______________________________________________________ Printed Name of Research Participant
______________________________________________________ Signature of Research Team Member Obtaining Consent
____________________ Date
______________________________________________________ Printed Name of Research Team Member Obtaining Consent