The Optimization and Purification of Essential Reagents Involved in
the Large Scale Production of Synthetic Heparin
Holly Lien
PharmD Candidate – Class of 2016
Abstract
The Liu lab focuses on synthesizing an ultra-low molecular weight heparin using a chemoenzymatic process that involves various enzymes and substrates. Current methods developed in the lab are used to synthesize and purify these biosynthetic enzymes and cofactors from E. coli crude lysates made with recombinant DNA technology. One of the key enzymes required for synthesis is pmHS2, with corresponding key substrates of GlcUA and UDP-GlcNTFA. The purpose of this project was to optimize and purify essential reagents involved in the large-scale synthesis of heparin to improve the efficiency of production. Variables such as pH, temperature, and concentration were manipulated to determine optimal conditions for the reactions performed. Mass spectrometry and HPLC were used to analyze samples from the reactions and to determine the amount of product yielded. Nickle column chromatography was used to purify pmHS2 efficiently. With this project, variables were successfully optimized and optimal product yields were obtained. By producing a synthetic form of heparin that is reproducible and affordable for patients, many risks pertaining to the current production of heparin can be eliminated.
Introduction
Heparan sulfate is a ubiquitous molecule that contains a variety of biologic functions that include regulation of blood coagulation, cell differentiation, and inflammatory responses.1
As a polysaccharide, it naturally contains repeating disaccharide units of N-acetyl-D-glucosamine (GlcNAc) and glucuronic or iduronic acid (GlcUA/IdoUA) that are highly sulfated with N- and
O-sulfo groups. Figure 1 illustrates these two basic saccharides.
Figure 1. Disaccharides involved in the natural synthesis of heparan sulfate.4
was issued due to contaminated products that led to severe adverse effects and even death in many patients.1
Currently, there are three forms of heparin that are approved by the FDA: unfractionated heparin (UFH), low-molecular weight heparin (LMWH), and fondaparinux (Arixtra). The production of UFH and LMWH depends on animal sources. On the other hand, Arixtra is fully synthetic but does not contain the full clinical benefits of UFH and LMWH. In Dr. Liu’s lab, the primary focus is to work towards the mass synthetic production of an ultra-low molecular weight heparin drug using methods that are both efficient in cost and resources. Although synthetic production is complicated, many risks of using animal sources pertaining to safety, contamination, and consistency can be eliminated. Additionally, synthetic heparin can be potentially engineered to contain other beneficial properties that do not exist in UFH and LMWH from natural sources.
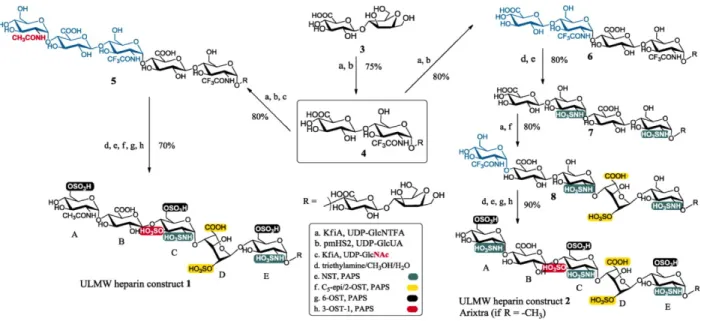
To date, the Liu lab has been successful in producing hundreds of milligrams of heparin using a large-scale process that involves recombinant biosynthetic enzymes and co-factor recycling. As shown in Figure 2, the chemoenzymatic synthesis of heparan sulfate involves numerous steps with varying enzymes and co-factors.
Figure 2. Chemoenzymatic synthesis of heparan sulfate.4
For this project, I focused on optimizing a (Kfia, UDP-GlcNTFA), b (pmHS2, UDP-GlcUA), and c (Kfia, UDP-GlcNAc) as shown in Figure 2. Kfia and pmHS2 are two bacterial glycosyltransferases expressed in E. coli that are substitutes for the biosynthetic enzymes. These bacterial enzymes are involved in elongating the heparan sulfate backbone. UDP-GlcNTFA (uridine diphosphate N-trifluoroacetylglucosamine) and UDP-GlcUA (uridine diphosphate glucuronic acid) are the corresponding key substrates to these enzymes.4,5
As seen in Figure 2, the disaccharide unit can be used to construct either ULMW heparin construct 1 (left) or ULMW heparin construct 2 (right). In comparison to the formation of construct 2, the steps to forming construct 1 are much more simplified. The a, b, and c in Figure 2 are mainly involved in the synthesis of the pentamer, which is eventually transformed to construct 1. Therefore, my role in this project involves further improving the efficiency and efficacy of some of the steps involved in the synthesis of the simpler construct 1. This included optimization of the reagents as well as working on the processes of purification and production. Specifically, my project consisted of working on four different key components of the synthetic process and finding solutions for any problems I encountered. There were three main objectives for this project, as outlined below.
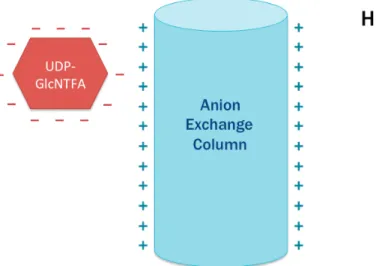
1. Objective 1: To determine the pH stability of UDP-GlcNTFA.
Figure 3. Charge attraction between UDP-GlcNTFA and an anion exchange
column at a higher pH (greater than 7.5).
Background: As described earlier, UDP-GlcNTFA is a key substrate involved in
2. Objective 2: To determine the optimal conditions to perform the conversion of UDP-glucose to UDP-GlcUA by manipulating variables such as the amount of LADH crude lysate, concentration of UDP-glucose, and temperature of the reaction.
Figure 4. Conversion of UDP-glucose to UDP-GlcUA2,3
Background: As described earlier, UDP-GlcUA is a key substrate to enzymes
involved in the chemoenzymatic synthesis of heparan sulfate. The synthesis of UDP-GlcUA involves multiple steps, with the final step being the conversion of UDP-glucose to UDP-GlcUA using the enzymes UDP-glucose dehydrogenase (UDGH) and lactate dehydrogenase (LADH). Ideally, a conversion of about 90-100% of UDP-glucose to UDP-GlcUA is desired. Before I started this project, Dr. Pagadala was applying ethanol and heat precipitation to this reaction, which yielded 90% conversion. The problem with using ethanol and heat is that the majority of the reactant (UDP-glucose) is lost in the process. Therefore, the overall amount of product (UDP-GlcUA) yielded is less even though the conversion rate is good. With this in mind, Dr. Pagadala started performing conversion reactions without the use of ethanol and heat. In doing so, these reactions resulted in a suboptimal yield of UDP-GlcUA with <70% conversion. My role for this project was to manipulate different variables to determine if any of them would optimize the amount of UDP-GlcUA yielded from the reaction under the conditions of no ethanol or heat.
3. Objective 3: To efficiently purify pmHS2 from crude bacterial lysate
Background: As described earlier, pmHS2 is one of the essential enzymes
amount of pmHS2 that is as pure as possible to use for reactions involved in heparin synthesis.
The Liu lab has continued to work towards becoming more efficient by using the least amount possible of reactants, substrates, enzymes, and materials to yield more products.My role with this project was to optimize existing processes and purify various reagents involved in the production of synthetic heparin. By working towards efficient use of resources and processes with the end result of greater yields, the goal is the decrease the overall costs of manufacturing synthetic heparin for large-scale commercial use.
Methods
Objective 1. UDP-GlcNTFA pH Stability Test
Tris buffer 50 mM (pH 7.5, 8.5, or 9.5) 5 uL
UDP-GlcNTFA 90 uL
Water 5 uL
Total 100 uL
In previous experiments performed in the lab, UDP-GlcNTFA was kept in a Tris buffer with a pH of 7.5, which is a neutral pH. Tris buffers with a pH of 8.5 or 9.5 were arbitrarily chosen to test the stability of UDP-GlcNTFA at higher pHs. Three batches of 100 uL were made with the only variable being the pH of the Tris buffer (7.5, 8.5, or 9.5). All batches were then incubated at room temperature (21 °C) and run through mass spectrometry to determine the extent of any degradation of UDP-GlcNTFA.
Objective 2. Optimizing the conversion of UDP-glucose to UDP-GlcUA
I. Amount of LADH crude lysate
Set 1 Set 2 Set 3
UDP-glucose [10 mM]; final [5 mM] with Tris [1 M] and MgSO4 [1 M]
5 mL 5 mL 5 mL
Pyruvate [1 M] 0.75 mL 0.75 mL 0.75 mL
NADH [0.1 M] 100 uL 100 uL 100 uL
Pure UDGH [3 mg/mL] 400 uL 400 uL 400 uL
Water 4 mL 4 mL 4 mL
LADH 0.1 mL 0.2 mL (x) 0.4 mL
Total 10.35 mL 10.45 mL 10.65 mL
they were incubated overnight in a 30°C water bath. After incubation, 450 uL samples were drawn to analyze the UDP-GlcUA product using HPLC.
II. Temperature of the reaction from glucose to UDP-glucose
UDP-glucose [5 mM] UDP-glucose [10 mM]
0.5 M ATP 1.1 mL 2.2 mL
0.5 M UTP 1 mL 2 mL
1 M glucose 500 uL 1000 uL
1 M MnCl2 400 uL 800 uL
Enzymes Set 1 (UGP1/Glk/PPA) + Enzymes Set 2 (UGP1/Glk/PGM2)
4 mL 8 mL
100 mM glucose-1-phosphate 100 uL 200 uL
Tris pH 7.5 [1 M] 2.5 mL 5 mL
Water 90 mL 80 mL
Total 100 mL 100 mL
Two separate mixtures were made to convert glucose to UDP-glucose with final concentrations of either 5 mM or 10 mM. After each 100 mL mixture was made, 50 mL was incubated overnight in a 30°C water bath and the other 50 mL incubated in a 37°C water bath. After incubation, 10 uL of each mixture was drawn and mixed with 500 uL of water in an Eppendorf tube. After Eppendorf tubes were centrifuged for 2 minutes, 450 uL samples were drawn to analyze the UDP-glucose product using high performance liquid chromatography (HPLC) to separate the individual components of the sample.
III. Concentration of UDP-glucose and temperature of the reaction from UDP-glucose to UDP-GlcUA
UDP-glucose [5 mM] UDP-glucose [10 mM]
UDP-glucose [10 mM] 250 mL 500 mL
Tris pH 7.5 [1 M] 12.5 mL 12.5 mL
MgSO4 [5 mM] 1.25 mL 1.25 mL
Pyruvate [1 M] 25 mL 25 mL
NADH [0.15 M] 2 mL 2 mL
LADH crude lysate 10 mL 10 mL
UDGH pure 5 mL 5 mL
Water 200 mL 0 mL
Total 505.75 mL 555.75 mL
*Note: Total volume of the conversion reaction was gradually scaled up from 60 mL to 120 mL to about 500 mL as shown in the table.
concentration or temperature were variables in the overall conversion to UDP-GlcUA. After incubation, 450 uL samples were drawn to analyze the UDP-GlcUA product using HPLC. In this case, the area under the curve (AUC) of the UDP-glucose peak compared to the AUC of the UDP-GlcUA peak indicated how much UDP-glucose was converted to UDP-GlcUA.
Figure 5. Schematic of testing the variables of UDP-glucose concentration and reaction
temperature
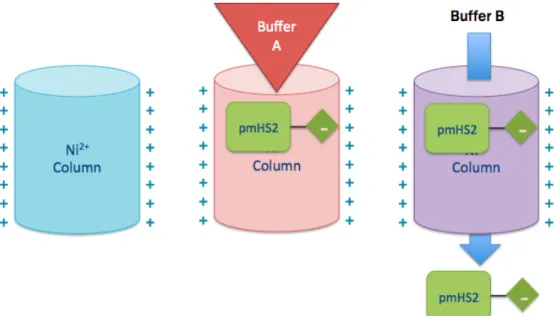
Objective 3. Purification of pmHS2
1. Make buffers needed for nickel column chromatography. 15 mL Sepharose Fast Flow nickel columns are used.
a. Buffer A is used to promote pmHS2 protein binding to the nickel column. Each 200 mL contains:
i. 198 mL of Tris pH 7.5 [50 mM] and NaCl [500 mM] ii. 2 mL of imidazole [3 M]
b. Buffer B contains imidazole, which assists in the collection of purified pmHS2. Each 100 mL of Buffer B contains:
i. 90 mL of Tris pH 7.5 [50 mM] and NaCl [500 mM] ii. 10 mL of imidazole [3 M]
2. Wash three connected nickel columns (column volume of 45 mL) with water. 3. Equilibrate columns with 50 mL of buffer A.
4. Centrifuge 6 L of E. coli culture and add 240 mL of buffer A to the cell pellet. Shake well. (Note: 1 L of culture was used initially and then eventually scaled up to 6 L)
5. Keep the tubes on ice and sonicate to lyse the cells. Sonicate each tube for 30 seconds. 6. After sonication, centrifuge (40,000 g) the tubes to spin down the debris and then
separate the soluble protein supernatant from the top.
7. The crude lysate contains the mixture of proteins (including pmHS2) from the lysed cells. Load the lysate through the nickel column. The pmHS2 protein contains a negatively charged histidine tag that will promote binding to the positively charged nickel column. 8. Wash the column with buffer A (approximately 50 mL) to wash off any loosely bound,
9. Using buffer B, elute pmHS2 from the column into 5 mL fractions. Buffer B contains imidazole, which allows collection of purified pmHS2 by disrupting the association between nickel and the histidine tag.
10. The 5 mL fractions contain varying amounts of pmHS2, which are determined by UV absorbance at 280 nm. The fractions containing significant amounts of pmHS2 are pooled.
Results
Objective 1. UDP-GlcNTFA pH Stability Test
Figure 7. Mass spectrum of UDP-GlcNTFA (pH 7.5) incubated at 21 °C overnight
Figure 8. Mass spectrum of UDP-GlcNTFA (pH 8.5) incubated at 21 °C overnight
CrudeNTFA_7 #1-85 RT:0.01-1.01AV:85 NL:1.97E6
T:- c ESI ms [ 300.00-1000.00]
300 350 400 450 500 550 600 650 700 750 800 850 900 950 1000
m/z 0 5 10 15 20 25 30 35 40 45 50 55 60 65 70 75 80 85 90 95 100 R el at ive Ab un da nce 660.2 329.8 564.3 390.1 346.3
426.3 661.3 682.2
779.9
375.6 565.3586.2 684.2 802.1
995.9 939.8
740.1
390.9 732.4 840.7 899.9 961.5
313.1 347.3 448.3466.0 506.1528.2 548.5 614.5 644.2 685.1 763.6 821.5 877.6
CrudeNTFA_8 #1-85RT:0.00-0.99AV:85NL:1.43E6
T:- c ESI ms [ 300.00-1000.00]
350 400 450 500 550 600 650 700 750 800 850 900 950 1000
m/z 0 5 10 15 20 25 30 35 40 45 50 55 60 65 70 75 80 85 90 95 100 R el at ive Ab un da nce 660.2 564.3 390.1 329.8 346.3 426.3 682.2 565.3 586.2 684.2 983.2
375.6 390.9 780.0
313.0 374.0 450.5465.8493.3506.1 526.7546.0 614.3 644.1 685.1 740.2750.3 802.3 838.7861.7 881.9 910.5928.1 976.5
Figure 9. Mass spectrum of UDP-GlcNTFA (pH 9.5) incubated at 21 °C overnight
Figure 10. Mass spectrum of UDP-GlcNTFA (pH 7.5) incubated at 4 °C overnight
In the mass spectrums, the peaks at 329.8 and 660.2 represent the ionization charges on UDP-GlcNTFA. The peak at 564.3 represents the amount of degraded UDP-UDP-GlcNTFA. Comparing Figures 7, 8, and 9, there was degradation of UDP-GlcNTFA regardless of the pH. However, the degradation peak at 564.3 increased with increasing pH. Thus, UDP-GlcNTFA was determined
CrudeNTFA_8 #1-85RT:0.00-0.99AV:85NL:1.43E6 T:- c ESI ms [ 300.00-1000.00]
350 400 450 500 550 600 650 700 750 800 850 900 950 1000 m/z 0 5 10 15 20 25 30 35 40 45 50 55 60 65 70 75 80 85 90 95 100 R e la tive Ab u n d a n ce 660.2 564.3 390.1 329.8 346.3 426.3 682.2 565.3 586.2 684.2 983.2
375.6 390.9 780.0
313.0 374.0 450.5465.8 506.1 526.7 614.3 644.1 685.1 740.2750.3 802.3 838.7861.7 881.9 910.5928.1 976.5 546.0
493.3
UDPGlcNTFA_4oC_7-5pH #1-82RT:0.01-1.00AV:82NL:3.42E5
T:- c ESI Full ms [ 300.00-1000.00]
300 350 400 450 500 550 600 650 700 750 800 850 900 950 1000
m/z 0 5 10 15 20 25 30 35 40 45 50 55 60 65 70 75 80 85 90 95 100 R el at ive Ab un da nce 329.8 660.2 682.1 739.9 958.4
390.1 741.2 839.8
375.5 642.8 683.6702.7 742.1 797.7799.7801.6 849.0 896.6898.5 938.3 985.0
309.9 408.9 582.7603.3 633.4 711.8 743.0760.4 876.3 900.2 959.5 995.9
346.2 426.0 712.7
567.9 526.1 485.7 373.1 427.6 466.8
to be most stable at a pH of 7.5. From there, UDP-GlcNTFA at a pH of 7.5 was incubated at 4 °C to determine whether temperature affected the extent of degradation. As shown in Figure 10, degradation was undetectable with a lower incubation temperature.
Objective 2. Optimizing the conversion of UDP-glucose to UDP-GlcUA
I. Temperature of the reaction from glucose to UDP-glucose
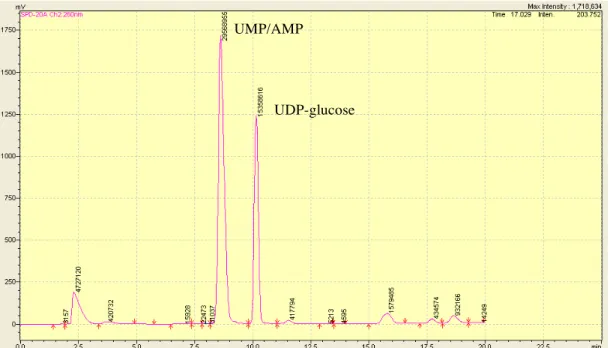
Figure 11. HPLC chromatogram depicting the conversion of glucose to UDP-glucose 5 mM or
10 mM after incubation in a 30°C water bath
Figure 12. HPLC chromatogram depicting the conversion of glucose to UDP-glucose 5 mM or
UMP/AMP
UDP-glucose
UMP/AMP
In Figures 11 and 12, the peak at ~8.5 min represents glucose and the peak at 10.0 min represents UDP-glucose. Based on the AUC of the peaks, approximately 60-80% of glucose was converted to UDP-glucose under the conditions of either a 30°C or a 37°C water bath. This conversion rate is consistent with what has been yielded previously in the lab.
II. The conversion of glucose to GlcUA with the manipulation of the UDP-glucose concentration, temperature of the reaction, and amount of LADH crude lysate
Figure 13. HPLC chromatogram depicting the conversion of glucose to
UDP-GlcUA under the optimized conditions of UDP-glucose [5 mM], incubation in a 30°C water bath, and 0.1 mL of LADH crude lysate
Many experiments were performed while manipulating the variables of UDP-glucose
concentration, temperature of the reaction, and amount of LADH crude lysate. The best results were achieved with UDP-glucose concentration of 5 mM, incubation in a 30°C water bath, and using 0.1 mL of LADH. This is represented by Figure 13, which shows approximately 90% conversion rate from UDP-glucose (peak at 10 min) to UDP-GlcUA (peak at 15 min) based on the AUC.
UDP-glucose
Objective 3. Purification of pmHS2
Figure 14. The amount of pmHS2 purified from each 6 L batch of E. coli culture is enough to
convert 1 g of heparin monomer to 2-3 g of heparin 6mer
Figure 15. The amount of pmHS2 required for each polymerization step from 1 g of heparin
monomer to 2-3 g of heparin 6mer
As depicted in Figures 14 and 15, the conversion of 1 g of monomer to 2-3 g of 6mer requires a total of 200 mg of pmHS2, which was purified from each 6 L batch of E. coli culture.
SDS-PAGE (PolyAcrylamide) gel electrophoresis is a method that is used to separate and analyze macromolecules (e.g. proteins) and their fragments based on size and charge. In Figure 16, the thickest band represents pmHS2 in the eluent. Based on the thickness of the band, the purified pmHS2 eluent is more than 90% pure.
Discussion
Objective 1. UDP-GlcNTFA pH Stability Test
From the results of the pH stability test, the mass spectrums show the stability of UDP-GlcNTFA at varying pHs and temperatures. The purpose of this experiment was to determine if UDP-GlcNTFA could maintain its stability at higher pHs where it is more negatively charged, which would allow it to bind better to the positively charged anion exchange column. However, the results demonstrate that by trying to achieve a more negatively charged compound, this is compromised by having more compound degradation. Room temperature was also a significant factor that negatively affected the stability of UDP-GlcNTFA at higher temperatures regardless of pH. In conclusion, purification of UDP-GlcNTFA should be performed at a neutral pH of 7.5 and maintained in the cold room at a temperature of 4°C.
Objective 2. Optimizing the conversion of UDP-glucose to UDP-GlcUA
incubation temperature of 30°C. When these conditions were met, more than 90% conversion yield to UDP-GlcUA was consistently achieved.
Conversion Yield (%)
Before Project
Reactions with ethanol and heat precipitation ~90%, variable Reactions without ethanol and heat
precipitation
<70%
After Project (no ethanol or heat precipitation)
Most amount of LADH crude <80%
Least amount of LADH crude ~80%
Least amount of LADH crude, UDP-glucose 10 mM, 30°C or 37°C
<80% Least amount of LADH crude, UDP-glucose
2.5 or 5 mM, 37°C
~80% Least amount of LADH crude, UDP-glucose
2.5 or 5 mM, 30°C
>90%, consistent
Figure 14. Results of conversion yield percentages of reactions under different conditions
Objective 3. Purification of pmHS2
pmHS2 is an essential enzyme that is required for each elongation step to form the heparin polymer. 40 mL (200 mg) of pmHS2 was purified from E. coli crude lysate, which is enough to elongate 1 g of heparin monomer to yield 2-3 g of heparin hexamer. The pmHS2 was more than 90% pure based on gel electrophoresis analysis.
Conclusion
Product Amount Commercial Cost Lab Cost
UDP-GlcUA 1 gram $1420 $40
UDP-glucose 1 gram $326 $20
Overall, the idea is to tweak the reagents or the conditions of the reactions involved in the chemoenzymatic synthesis of heparin without having to purify every enzyme or reagent. Instead of attempting to purify enzymes and substrates involved in every single step, the lab focuses on purifying the end product which is much more efficient. Through my project, we were able to optimize the lab’s existing processes in order to enhance the efficiency of production. To date, the Liu lab has successfully produced grams of synthetic ULMWH by continuously working towards using the least amount of reagents and materials to achieve greater product yields. The Liu lab is currently working towards FDA approval of this pure, synthetic form of heparin with the ultimate goal of reducing manufacturing costs so that it can be mass-produced in clinical settings and be financially affordable for patients.
References
1. Chen J, Avci FY, Muñoz EM, et al. Enzymatic redesigning of biologically active heparan sulfate. J Biol Chem. 2005;280(52):42817-25.
2. Conversion of UDP-GlcNAc to UDP-GalNAc[edit] 3. Conversion of UDP-GlcNAc to UDP-GalNAc[edit]
4. Dr. Jian Liu’s lecture slides, Susan Moody’s slides (prior student in Dr. Liu’s lab).
5. Kingsley DM, Kozarsky KF, Hobbie L, Krieger M (March 1986). "Reversible defects in O-linked glycosylation and LDL receptor expression in a UDP-Gal/UDP-GalNAc 4-epimerase deficient mutant". Cell 44 (5): 749–59. doi:10.1016/0092-8674(86)90841-X. PMID 3948246


![Figure 13. HPLC chromatogram depicting the conversion of UDP-glucose to UDP- UDP-GlcUA under the optimized conditions of UDP-glucose [5 mM], incubation in a 30°C](https://thumb-us.123doks.com/thumbv2/123dok_us/8330206.2209572/13.918.160.777.272.629/figure-chromatogram-depicting-conversion-glucose-optimized-conditions-incubation.webp)
