THE CANCER BURDEN AND PATTERNS OF ERYTHROPOIESIS-STIMULATING AGENT USE AMONG END-STAGE RENAL DISEASE PATIENTS ON HEMODIALYSIS
Anne Mobley Butler
A dissertation submitted to the faculty at the University of North Carolina at Chapel Hill in partial fulfillment of the requirements for the degree of Doctor of Philosophy in the Department of
Epidemiology in the Gillings School of Global Public Health.
Chapel Hill 2014
© 2014 Anne Mobley Butler ALL RIGHTS RESERVED
ABSTRACT
ANNE MOBLEY BUTLER: The cancer burden and patterns of erythropoiesis-stimulating agent use among end-stage renal disease patients on hemodialysis
(Under the direction of M. Alan Brookhart)
Patients with end-stage renal disease (ESRD) receiving dialysis have been reported to have increased risk of cancer. Yet, contemporary cancer burden estimates in this population are sparse, and estimates that account for the high competing risk of death in this population are non-existent. In addition, erythropoiesis-stimulating agents (ESAs) and blood transfusion are
commonly used to treat anemia in both ESRD and cancer, however, anemia treatment patterns have not been described among ESRD patients undergoing hemodialysis with concurrent cancer, especially in the recent era of ESA-related safety concerns.
Using data from Medicare’s ESRD program, we conducted a retrospective cohort study of hemodialysis patients to describe trends in overall and site-specific cancer incidence rates (1996-2009). We estimated the 5-year cumulative incidence of cancer since dialysis initiation, using competing risk methods. Among hemodialysis patients with incident cancer, we used multivariable generalized linear models to estimate temporal trends in ESA use, epoetin alfa (EPO) dose, transfusion use, and resulting hemoglobin levels (2000-2010).
We observed a constant rate of incident cancers for all sites combined, but identified increasing and decreasing rates for some common site-specific cancers. The 5-year cumulative incidence of any cancer was substantially lower in the analysis that did not censor deaths compared to the analysis that censored deaths (9.48% vs. 13.86%). Accounting for case-mix characteristics and the competing risk of death, the 5-year cumulative incidence of any cancer varied by demographic and clinical characteristics.
Among hemodialysis patients with incident cancer, ESA use was extremely high and constant whereas transfusion use became increasingly frequent. EPO dose and hemoglobin
values increased and then declined. Patients with hematological malignancies or patients who received chemotherapy had higher ESA use, EPO dose, and transfusion use as well as lower hemoglobin levels.
Our results suggest a high burden of cancer in the dialysis population, with varying patterns of cancer incidence across subgroups. Despite ESA-related safety concerns, ESA use remained extremely common and remarkably constant among hemodialysis patients with cancer between 2000 and 2010. Transfusions have increased in frequency. These results warrant additional research to examine the risk-benefit profile of ESA use in the dialysis population with cancer.
DEDICATION
To my family for their constant love and support. To my parents, Harry and Natalie, thank you for your lifelong encouragement and support, and for inspiring in me a love of learning. To my brother, Blake, thank you for keeping a fun perspective on life. To my husband extraordinaire,
Andy, thank you for your endless encouragement, advice, and support.
ACKNOWLEDGEMENTS
I would like to thank my doctoral dissertation committee for their guidance and support. Dr. Alan Brookhart, thank you for your mentorship throughout the dissertation process. Your enthusiasm about epidemiology research is an inspiration. Dr. Andy Olshan, thank you for your support and guidance throughout my doctoral program. I am grateful for your patient, helpful, and practical mentorship. Dr. Abhi Kshirsagar, thank you for teaching me about the clinical nephrology world and for your thoughtful advice about research topics. Dr. Stephanie Wheeler, thank you for being a wise resource on cancer claims research and for your incredible attention to detail. Dr. Matthew Nielsen, thank you for sharing your oncology expertise, and for your inspiring ideas. It has been a joy to work with my committee, without whom this research would not have been possible.
I would also like to my UNC classmates who continue to amaze and inspire me.
I am very grateful for the funding support that I have received from the Cancer
Epidemiology Training Program (5 T32 CA009330-30) within the Department of Epidemiology at the UNC Gillings School of Global Public Health and from the Renal Epidemiology Training Program (2 T32 DK007750-15) within the Division of Nephrology at the UNC Kidney Center in the UNC School of Medicine.
TABLE OF CONTENTS
LIST OF TABLES
... x
LIST OF FIGURES
... xii
LIST OF ABBREVIATIONS
... xiv
CHAPTER I. STATEMENT OF SPECIFIC AIMS
... 1
CHAPTER II. REVIEW OF LITERATURE
... 6
A. Overview of Chronic Kidney Disease (CKD) and End-stage Renal
Disease (ESRD)
... 6
1. Anatomy of the kidney
... 6
2. Physiology of the kidney
... 7
3. Measures of renal function
... 8
4. Definitions of CKD and ESRD
... 9
5. Pathogenesis of ESRD
... 11
6. Risk factors for progression to ESRD
... 12
7. Treatment modalities: hemodialysis, peritoneal dialysis, kidney
transplantation
... 12
8. Clinical and preventive care of ESRD patients
... 14
B. Epidemiology of ESRD in the United States
... 18
1. Incidence and prevalence of ESRD
... 18
2. Kidney transplantation in the ESRD population
... 20
3. Mortality in the ESRD population
... 20
4. Economic burden of ESRD
... 21
1. Cancer burden in the ESRD population
... 22
2. Epidemiologic studies of cancer risk in the ESRD population
... 23
3. Cancer as a cause of CKD/ESRD
... 26
4. Pathogenesis and progression of cancer in the ESRD population
... 27
5. Cancer screening in the ESRD population
... 27
6. Cancer treatment in the ESRD population
... 28
D. Erythropoiesis-stimulating agent (ESA) therapy for anemia
management
... 28
1. Pathogenesis of anemia in ESRD patients ... 28
2. Diagnosis of anemia in ESRD patients
... 29
3. Overview of ESA therapy
... 30
4. ESA therapy and cancer outcomes
... 32
5. Timeline of events related to anemia management with ESAs,
2003-2009
... 35
6. Clinical guidelines & recommendations for ESA therapy
... 37
7. Anemia management in the ESRD population and the cancer
population
... 39
E. Public health relevance
... 42
CHAPTER III. METHODS
... 42
A. Study design and population
... 42
B. Data source
... 45
C. Dependent variable definitions
... 47
D. Independent variable definitions
... 49
E. Statistical analysis for aim 1
... 50
F. Statistical analysis for aim 2
... 53
CHAPTER IV. RESULTS ... 54
A. Cancer incidence among U.S. Medicare end-stage renal disease
patients on hemodialysis, 1996-2009.
... 54
1. Introduction
... 54
2. Methods
... 54
3. Results
... 58
4. Discussion
... 60
B. Trends in use of erythropoiesis-stimulating agents and blood
transfusions in U.S. hemodialysis patients with cancer
... 72
1. Introduction
... 72
2. Methods
... 73
3. Results
... 76
4. Discussion
... 78
CHAPTER V. DISCUSSION
... 88
A. Summary of Findings
... 88
B. Public Health Implications
... 89
C. Strengths
... 89
D. Limitations
... 90
E. Future Directions ... 92
F. Conclusions
... 93
APPENDICES
... 94
Appendix A. Supplemental analyses for Chapter IV
... 94
Appendix B. Supplemental analyses for Chapter V
... 107
REFERENCES
... 123
LIST OF TABLES
Table 1. Stages of chronic kidney disease (age ≥20 years) ... 10
Table 2. Incident and prevalent counts and adjusted rates of ESRD by age,
gender, race and ethnicity, U.S., 2010* ... 19 Table 3. Incident and prevalent counts and adjusted rates of ESRD by most
common primary diagnoses, U.S., 2010 ... 20 Table 4. Published studies of cancer incidence in the dialysis population ... 24 Table 5. Eight randomized, controlled trials reporting decreased survival and/or
decreased locoregional control in ESA-treated patients ... 33 Table 6. Published studies of ESRD populations or cancer populations that
report patterns of ESA utilization and dose in the time period before and/or
after the March 1, 2007 FDA black-box warning ... 40 Table 7. Sensitivity and specificity of claims-based definitions for incident
cancers ... 48 Table 8. Covariates necessary for statistical analyses of specific aims ... 50 Table 9. Demographic and clinical characteristics of annual study cohorts at
risk for cancer in 1996, 2000, 2004, and 2009 ... 64 Table 10. The crude 5-year cumulative incidence of site-specific cancers
among U.S. hemodialysis patients ... 65 Table 11. Crude and standardized 5-year cumulative incidence estimates
of any cancer, accounting for the competing risk of death, by demographic
and clinical characteristics ... 66 Table 12. Demographic and clinical characteristics of the study population
in 2000, 2002, 2004, 2006, 2008, and 2010 ... 81 Table 13 (Supplemental). Age-, sex-, and race-standardized incidence rates
of cancer in the U.S. general population, using the U.S. hemodialysis
population as the standard, 1996-2009 ... 101 Table 14 (Supplemental). Demographic and clinical characteristics of
482,510 USRDS patients who initiated dialysis between April 1, 1995
and April 5, 2010... 102 Table 15 (Supplemental). The crude 5-year cumulative incidence of less
frequent site-specific cancers among U.S. hemodialysis patients ... 103 Table 16 (Supplemental). ICD-9-CM diagnosis codes used to identify
site-specific cancer cases from Medicare claims ... 104 Table 17 (Supplemental). Descriptive characteristics of inverse probability
of exposure weights by patient characteristic ... 106
Table 18 (Supplemental). ICD-9-CM diagnosis codes used to identify
site-specific cancer cases from Medicare claims ... 107 Table 19 (Supplemental). Administrative codes used to identify anemia
treatment ... 109 Table 20 (Supplemental). Administrative codes used to identify receipt of
any chemotherapy from Medicare claims ... 110 Table 21 (Supplemental). Distribution of site-specific cancer cases among
study population by year, 2000-2010 ... 111
LIST OF FIGURES
Figure 1. Diagram of the cut surface of a bisected kidney, depicting important
anatomic structures ... 6 Figure 2. Physiologic model of the feedback system that regulates hemoglobin
levels ... 29 Figure 3. A timeline of the major regulatory actions, reimbursement changes,
peer-reviewed publications and revisions to clinical practice guideline
recommendations that occurred between 2005 and 2009 ... 37 Figure 4. Hemoglobin target range for adult hemodialysis patients receiving
ESA therapy, by year and international guideline group ... 38 Figure 5. Study design for aims 1a and 1b ... 44 Figure 6. Study design for aim 1c, 1996 annual cohort ... 45 Figure 7. Adjusted annual incidence rates of cancer diagnoses among U.S.
hemodialysis patients by cancer site, 1996-2009 ... 67 Figure 8. Adjusted cancer incidence rates for cancers of the prostate, breast
(female), lung/bronchus, and colon/rectum among U.S. hemodialysis
patients, by demographic and clinical characteristics, 1996-2009 ... 68 Figure 9. The crude cumulative incidence of any cancer by time since
dialysis initiation among U.S. hemodialysis patients ... 69 Figure 10. The standardized cumulative incidence of any cancer by time
since dialysis initiation, accounting for the competing risk of death, by
demographic and clinical characteristics ... 70 Figure 11. Distribution of cancer diagnoses among U.S. hemodialysis
patients with cancer, by first cancer site and year, 2000-2010 ... 82 Figure 12. Mean quarterly ESA use by cancer site among U.S. hemodialysis
patients with cancer, 2000-2010 ... 83 Figure 13. Mean EPO dose (units/month) by cancer site among U.S. hemodialysis
patients with cancer, 2000-2010 ... 84 Figure 14. Use of blood transfusions by cancer site among U.S. hemodialysis
patients with cancer, 2000-2010 ... 85 Figure 15. Mean quarterly hemoglobin levels by cancer site among U.S.
hemodialysis patients with cancer, 2000-2010 ... 86 Figure 16. Quarterly trends in anemia management by chemotherapy use
among U.S. hemodialysis patients with cancer, 2000-2010 ... 87 Figure 17 (Supplemental). Crude annual incidence rates of cancer diagnoses
among U.S. hemodialysis patients by cancer site, 1996-2009 ... 94
Figure 18 (Supplemental). Flow diagram of eligibility criteria among U.S.
hemodialysis patients ... 95 Figure 19 (Supplemental). The crude cumulative incidence of any cancer by
time since dialysis initiation, accounting for the competing risk of death, by
demographic and clinical characteristics ... 96 Figure 20 (Supplemental). The crude cumulative incidence of any cancer by
time since dialysis initiation, censoring deaths, by demographic and clinical
characteristics ... 98 Figure 21 (Supplemental). Adjusted annual incidence rates of cancer diagnoses
by cancer definition among U.S. hemodialysis patients, 1996-2009 ... 100 Figure 22 (Supplemental). Mean quarterly ESA use by drug type among U.S.
hemodialysis patients with cancer, 2000-2010 ... 112 Figure 23 (Supplemental). Mean ESA use by cancer site among U.S.
hemodialysis patients with cancer, 2000-2010 ... 113 Figure 24 (Supplemental). Mean EPO dose (units/month) by cancer site
among U.S. hemodialysis patients with cancer, 2000-2010 ... 114 Figure 25 (Supplemental). Mean use of blood transfusions by cancer site
among U.S. hemodialysis patients with cancer, 2000-2010 ... 115 Figure 26 (Supplemental). Mean quarterly hemoglobin levels by cancer site
among U.S. hemodialysis patients with cancer, 2000-2010 ... 116 Figure 27 (Supplemental). Quarterly trends in anemia management by age
among U.S. hemodialysis patients with cancer, 2000-2010 ... 117 Figure 28 (Supplemental). Quarterly trends in anemia management by sex
among U.S. hemodialysis patients with cancer, 2000-2010 ... 118 Figure 29 (Supplemental). Quarterly trends in anemia management by race
among U.S. hemodialysis patients with cancer, 2000-2010 ... 119 Figure 30 (Supplemental). Quarterly trends in anemia management by ethnicity
among U.S. hemodialysis patients with cancer, 2000-2010 ... 120 Figure 31 (Supplemental). Quarterly trends in anemia management by primary
cause of ESRD among U.S. hemodialysis patients with cancer, 2000-2010 ... 121 Figure 32 (Supplemental). Quarterly trends in anemia management by dialysis
vintage among U.S. hemodialysis patients with cancer, 2000-2010 ... 122
LIST OF ABBREVIATIONS AIDS Acquired immunodeficiency syndrome
APC Annual percentage change
APPRISE Assisting Providers and Cancer Patients with Risk Information for the Safe Use of ESAs
ASCO American Society for Clinical Oncology ASH American Society for Hematology AVF Arteriovenous fistula
BEST Breast Cancer Erythropoietin Survival Trial
CHOIR Correction of Hemoglobin Outcomes in Renal Insufficiency CI Confidence interval
CKD Chronic kidney disease
CKD-EPI Chronic Kidney Disease Epidemiology Collaboration CMS Centers for Medicare and Medicaid Services
CREATE Cardiovascular Risk Reduction by Early Anemia Treatment with Epoetin Beta DAHANCA Danish Head and Neck Cancer Group Study
EDB Medicare Enrollment Database eGFR Estimates of glomerular filtration rate
ENHANCE Erythropoietin in Head and Neck Cancer Study ESA Erythropoiesis-stimulating agent
ESRD End-stage renal disease EPO Epoetin alfa
FDA United States Food and Drug Administration GFR Glomerular filtration rate
HCPCS Healthcare Common Procedure Coding System
HD Hemodialysis
Hgb Hemoglobin
HIFs Hypoxia-inducible transcription factors
HIV Human immunodeficiency virus HLA Human leukocyte antigen HMO Health maintenance organization HPV Human papillomavirus
ICD-9-CM International Classification of Diseases, 9th revision, Clinical Modification IP Inverse probability
IQR Interquartile range
KDIGO Kidney Disease | Improving Global Outcomes KDOQI Kidney Disease Outcomes Quality Initiative MCV Mean corpuscular volume
MDRD Modification of Diet in Renal Disease NCCN National Comprehensive Cancer Network NCI National Cancer Institute
NHANES National Health and Nutrition Examination Survey NHL Non-Hodgkin lymphoma
OPTN Organ Procurement and Transplantation Network PD Peritoneal dialysis
pmp Per million population QoL Quality of life
RBC Red blood cell
REBUS Renal Beneficiary and Utilization System RRT Renal replacement therapy
SEER Surveillance, Epidemiology, and End Results SIMS Standard Information Management System SIRs Standardized incidence ratios
SMR Standardized mortality ratio
Th Helper T-cell
TSAT Transferrin saturation
URR Urea reduction ratio
USRDS United States Renal Data System
VA United States Department of Veterans Affairs Healthcare System
CHAPTER I. STATEMENT OF SPECIFIC AIMS
Patients with end-stage renal disease (ESRD) suffer almost universally from anemia because they produce insufficient amounts of endogenous erythropoietin to maintain hematocrit levels. Anemia is also a common complication in cancer patients undergoing chemotherapy. In the last two decades, erythropoiesis-stimulating agents (ESA) therapy has been widely used for anemia management in ESRD patients and cancer patients to reduce the need for red blood cell (RBC) transfusions and to alleviate anemia-related symptoms. In the last two decades, ESAs have had the highest sales worldwide of any biologic medication (1). Of $2.8 billion spent in 2010 on injectables for U.S. dialysis patients, ESAs accounted for 67%, or $1.9 billion (2). Beginning in 2003, eight randomized clinical trials in cancer patients reported increased risk of tumor progression and/or death among cancer patients treated with ESA therapy (3-11). Simultaneously, reports were published of increased risk of death and serious cardiovascular events in patients with chronic kidney disease (CKD). Over the next five years, subsequent United States Food and Drug Administration (FDA) black-box warnings, reimbursement changes, and revised anemia management guidelines were issued. Yet, it still remains unclear whether ESAs affect tumor progression or survival in cancer patients. The most recent meta-analysis of 60 experimental studies of more than 15,000 cancer patients failed to demonstrate any significant effect of ESAs on survival or disease progression (12). Current management of anemia in dialysis patients with cancer has become challenging due to the absence of formal guidelines for providers regarding
appropriate usage of ESA therapy in this population. The United States recommendation for CKD patients on dialysis receiving ESAs is to initiate treatment when the Hgb level is less than 10 g/dL and to
individualize dosing and use the lowest dose of ESA sufficient to reduce the need for RBC transfusions (13), whereas the ESA indication for cancer patients is for treatment of anemia due to concomitant myelosuppressive chemotherapy (14). While the FDA limits ESA treatment among cancer patients to those receiving chemotherapy for palliative intent, the short expected lifespan of the average patient on dialysis (2) is likely associated with major variability in utilization practices in this population.
Knowledge is limited about the cancer incidence in the dialysis population as well as patterns of ESA utilization in dialysis patients with cancer. Despite reports of increased risk of many cancers in the
dialysis population (15-17), the cancer burden has not been sufficiently characterized in ESRD patients on dialysis. Existing estimates of cancer incidence in the ESRD population are outdated, primarily focused on overall cancer or limited cancer types, determined from small, selective groups of dialysis patients, based on data (e.g., cancer diagnoses and cause of death) ascertained from sources of
questionable reliability, and failed to account for competing risks of death (15, 16, 18-39). Competing risk methods are necessary to avoid the potentially large bias due to a large proportion of patients who experience the competing risk of death prior to receiving a cancer diagnosis (i.e., the event of interest) (40-43). In addition, the impact of recent safety reports, FDA black-box warnings, reimbursement
changes, and revised anemia management guidelines on ESA utilization patterns in dialysis patients with cancer is unknown. ESA therapy use declined among CKD patients (44) and cancer patients (45, 46) after these events. However, information is limited about patterns of ESA therapy utilization in dialysis patients with cancer.
The objectives of this dissertation are to describe the cancer burden among ESRD patients on hemodialysis and to examine patterns of ESA utilization among ESRD patients on hemodialysis with cancer. The analyses utilized data from the USRDS, a national registry including all patients in Medicare’s ESRD program with detailed demographic and clinical information at dialysis therapy initiation, as well as medication usage, diagnoses, and procedures from hospitalizations and outpatient visits after
hemodialysis therapy initiation. The study population included almost half a million adults with ESRD who received dialysis between 1995 and 2010.
Aim 1. To characterize the overall and site-specific cancer burden among ESRD patients without cancer at hemodialysis initiation, across subgroups (e.g., by age, gender, race, ethnicity, primary cause of renal disease, kidney transplant evaluation, and era of dialysis initiation).
Aim 1a. To estimate the cumulative incidence of cancer, treating death as a censoring event.
Aim 1b. To estimate the cumulative incidence of cancer, treating death as a competing event.
Aim 1c. To describe trends in cancer incidence using annual incidence rates adjusted for case-mix characteristics.
Hypothesis – Specific Aim 1. The cumulative incidence of cancer will be lower after accounting for the competing risk of death. The cumulative incidence and incidence rates will vary across subgroups, with higher cancer incidence among patients with older age, white race, kidney transplant evaluation, and longer time since dialysis initiation.
Rationale – Specific Aim 1. Prior studies have demonstrated the increased risk of cancer in the dialysis population compared to the general population, under the hypothetical assumption of no competing risk of death. However, death is a common event in the dialysis population, and it precludes a cancer diagnosis. Competing risk methods are necessary to avoid the potentially large bias due to a large proportion of patients who experience the competing risk of death prior to receiving a cancer diagnosis (i.e., the event of interest). Estimation of the cumulative incidence of cancer, accounting for the competing risk of death, will quantify the real-world probability of a dialysis patient to develop cancer. The descriptive analysis of cancer incidence rates will vary by patient characteristics.
Aim 2. To examine temporal trends in anemia therapy (2000-2010) in ESRD patients diagnosed with cancer after hemodialysis initiation, for a time period before, during, and after negative safety reports, product labeling changes, black box advisories, revised anemia management guidelines, and
reimbursement changes.
Aim 2a. To describe temporal trends in ESA therapy use among dialysis patients with cancer, by cancer site, receipt of chemotherapy, and other demographic and clinical characteristics relevant to the dialysis population.
Aim 2b. To describe temporal trends in mean epoetin alfa (EPO) therapy dose among dialysis patients with cancer, by cancer site, receipt of chemotherapy, and other demographic and clinical characteristics relevant to the dialysis population.
Aim 2c. To describe temporal trends in RBC transfusions among dialysis patients with cancer, by cancer site, receipt of ESA therapy, receipt of chemotherapy, and other demographic and clinical characteristics relevant to the dialysis population.
Aim 2d. To describe temporal trends in mean Hgb levels among dialysis patients with cancer, by cancer site, receipt of ESA therapy, receipt of chemotherapy, and other demographic and clinical characteristics relevant to the dialysis population.
Hypothesis – Specific Aim 2. The emergence of safety concerns and the subsequent changes in product labeling, reimbursement and clinical practice guidelines that occurred between 2003 and 2008 will influence health care provider practices for dialysis patients with cancer. Specifically, post-FDA-mandated labeling changes in dialysis patients with cancer will be characterized by a lower proportion of ESA therapy utilization, lower mean EPO dose, higher proportion of RBC transfusion, and lower mean Hgb values. Results will vary by cancer type and treatment, where patients with hematological
malignancies and patients who undergo chemotherapy will be more likely to use ESA therapy, receive a higher EPO dose, receive RBC transfusions, and have lower Hgb values.
Rationale – Specific Aim 2. Anemia management patterns have been reported to have changed
markedly in the years before and after the 2007 FDA black-box warning in the dialysis population and the cancer population. Anemia management patterns have not been described in the dialysis population with cancer. Recent reports about the dialysis population and the cancer population suggest declines in ESA therapy use, ESA dose, RBC transfusions, and hemoglobin levels. Changes in product labeling,
reimbursement and clinical practice guidelines will likely have a similar but lesser impact on anemia management practices and Hgb levels in the ESRD population with cancer because of higher severity of illness.
CHAPTER II. REVIEW OF LITERATURE
A. Overview of Chronic Kidney Disease (CKD) and End-stage Renal Disease (ESRD)
1. Anatomy of the kidney
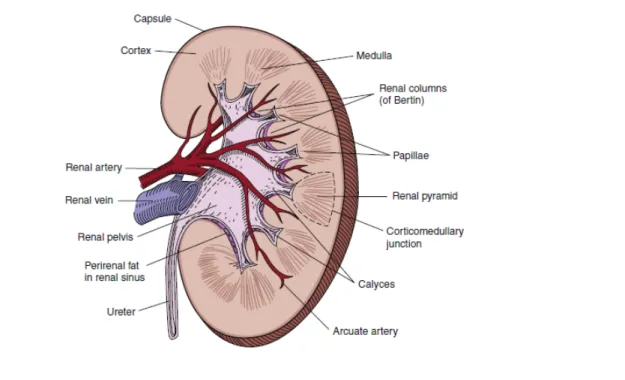
The kidneys are a pair of small, bean-shaped organs located on each side of the vertebral column. Each kidney is approximately 11 to 12 cm long and weighs 115 to 170 g (47). The primary functions of the kidneys include filtering wastes from the blood, balancing the body's fluid content, and regulating blood pressure and RBC production. Healthy kidneys filter approximately 180 liters of largely protein-free plasma daily (48). A rich blood supply is delivered by the paired renal arteries, travels through the microvasculature, and drains into the paired renal veins. As the kidney filters blood it subsequently produces urine, a fluid containing toxic substances and waste products. Urine collects in the renal pelvis, exits the kidney through ureters, and flows to the urinary bladder (Figure 1).
Figure 1. Diagram of the cut surface of a bisected kidney, depicting important anatomic structures
Adapted from Nielsen et al. (2012) (47)
Nephrons are the basic functional unit of the kidney. Each human kidney contains approximately one million nephrons which are established during prenatal development. After birth, new nephrons cannot be developed and lost nephrons cannot be replaced. The essential components of the nephron include a) the renal corpuscle, comprised of the glomerulus and Bowman’s capsule, and b) the renal tubule, comprised of the proximal tubule (i.e., convoluted part and straight part), the intermediate tubule (i.e., descending and ascending thin limbs of Henle’s loop) and the distal tubule (i.e., thick ascending limb of Henle’s loop and convoluted part). The glomeruli, proximal tubules and distal tubules are situated in the cortex, whereas the loops of Henle and the collecting ducts extend down through the medulla. Nephrons have either short or long loops of Henle, where the length of the loop of Henle is generally related to the position of the parent renal corpuscle in the cortex. Cortical nephrons have short loops that turn back in the outer medulla or even in the cortex. Juxtamedullary nephrons have long loops that turn back at successive levels of the inner medulla. Cortical nephrons and juxtamedullary nephrons represent approximately 85% and 15%, respectively, of the nephrons in the kidney.
2. Physiology of the kidney
The kidneys filter blood through three main processes: a) glomerular filtration filters blood to produce an ultrafiltrate of plasma; b) tubular secretion removes substances from the blood and secretes them into the filtrate; and c) tubular reabsorption returns substances to the blood.
Glomerular filtration. The first fundamental step in urine formation is glomerular filtration which is the separation of blood into two components: filtered blood and an ultrafiltrate of plasma. As blood flows from the afferent arteriole into the glomerulus under high pressure, the glomerular capillary walls function as a filter that allows the passage of small molecules into the encircling glomerular capsule (i.e., Bowman’s capsule) while molecules the size of albumin or larger remain in the blood. The filtered fluid is called ultrafiltrate and includes water, small proteins, salts (Na+, Cl-, K+, H+), glucose, nitrogenous waste products such as urea and other metabolic waste products and drug metabolites. Filtration is determined principally by the molecular size and shape of the solute and, to a much lesser extent, by its charge (48). The remaining
blood exits the glomerulus through the efferent arteriole and the ultrafiltrate exits the glomerular capsule into the proximal convoluted tubule.
Tubular secretion. The second fundamental step in urine formation is tubular secretion which is the process that removes substances from the blood and secretes them into the filtrate. Secreted substances include H+, K+, NH4+ (i.e., ammonium ion), creatinine, urea, and various other substances. Secretion occurs in portions of the proximal convoluted tubule, the distal convoluted tubule and the collecting duct.
Tubular reabsorption. The third fundamental step in urine formation is tubular reabsorption which increases the concentration of the glomerular filtrate by reabsorbing the glomerular filtrate back into the blood. As the glomerular filtrate flows through the proximal tubule, nearly all of the filtered water and solutes (Na+, Cl-, K+, Ca2+, Mg2+, HCO3+, glucose, amino acids, retinol-binding protein, α- and β-microglobulins, calcium, phosphate, urea) are reabsorbed and transferred back into the peritubular capillaries that surround the tubule. The proximal tubule is conducive to reabsorption because of the large absorptive area of epithelial cells with microvilli on their apical surface; the basolateral membrane with folds that similarly enhance surface area; and the relatively leaky tight junctions between adjacent cells. The amounts of water and ions that are reabsorbed into the blood are regulated so that blood volume, pressure and ion concentration are maintained within required levels for homeostasis. Solute transport across cell membranes occurs via passive or active mechanisms. Passive transport is simple diffusion that occurs down an electrochemical gradient and does not require a direct energy source. Active
transport occurs when an ion is moved directly against an electrochemical gradient and requires a source of energy.
3. Measures of renal function
The glomerular filtration rate (GFR) is the best overall index of renal function in health and disease, and provides an excellent measure of the filtering capacity of the kidneys. The total kidney GFR is equal to the sum of the filtration rates in each of the functioning nephrons. Thus, the total GFR can be used as an index of functioning renal mass (49). The definition and staging of CKD depends, in part, on
the assessment of GFR. A low or decreasing GFR is a hallmark of CKD. As GFR declines, patient complications are manifested first by high blood pressure and abnormalities in laboratory tests and then by symptoms and abnormalities in physical examination. In general, the severity of complications worsens as levels of GFR declines. The most significant complications are high blood pressure, anemia,
malnutrition, bone disease, neuropathy, and decreased overall functioning and well-being. At very low levels of GFR, these complications are common and collectively known as “uremia” or the “uremic syndrome (50).”
Direct measure of GFR is an impracticality for clinical practice, therefore kidney function is routinely assessed using estimates of GFR (eGFR). Prediction equations such as the Modification of Diet in Renal Disease (MDRD) estimating equation (51), the Chronic Kidney Disease Epidemiology Collaboration (CKD-EPI) equation (52) and the Cockcroft-Gault equation (53) commonly used to estimate GFR in adults factor in the serum creatinine concentration as well as age, gender and race. The most common method used to estimate renal function is the simplified four-variable Modification of Diet in Renal Disease (MDRD) equation, where GFR (mL/min/1.73 m2) = 186 * [serum creatinine level]-1.154 * [age]-0.203 * [0.742 if patient is female] * [1.212 if patient is black]. This equation was derived using data from 1,628 patients enrolled in the baseline period of the MDRD study, in whom GFR was measured directly with the use of urinary clearance of injected iodine-125-iothalamate (51). The more recently developed CKD-EPI equation performs better than the MDRD equation, especially at higher GFR, with less bias, improved precision, and greater accuracy. This equation was developed using an equation development data set of 8,254 participants from 10 studies, a validation data set of 3,896 participants from 16 studies and prevalence estimates based on 16,032 National Health and Nutrition Examination Survey (NHANES) participants. The CKD-EPI equation is expressed as GFR (mL/min/1.73 m2) = 141 * min[serum creatinine level/Ƙ, 1]α * max[serum creatinine level/Ƙ, 1]-1.209 * [0.993]age * [1.018 if patient is female] * [1.159 if patient is black], where Ƙ is 0.7 for females and 0.9 for males, α is -0.329 for females and -0.411 for males (52).
4. Definitions of CKD and ESRD
CKD is defined as the presence for three or more months of impaired renal function across a continuum of renal injury from isolated anatomic, radiographic, biomarker, and urinary abnormalities to
decreased GFR, irrespective of the primary cause of the renal injury (50). The National Kidney Foundation classification defines five stages of CKD by increasing degree of impaired kidney function, as measured by GFR (Table 1) (50). CKD is a nonspecific diagnosis that describes the presence and degree of structural and functional abnormalities of the kidney, thus the complete clinical diagnosis should include both the stage and primary cause of kidney disease (54). The abnormalities used to define CKD are 1) proteinuria (i.e., increased urinary excretion of albumin, other specific proteins, or total protein); 2) an abnormal urinary sediment as evidenced by the presence of RBCs, RBC casts, white blood cells, white blood cell casts, tubular cells, cellular casts, granular casts, oval fat bodies, fatty casts, or free fat; and 3) abnormal findings on imaging tests, including ultrasound, intravenous pyelogram, computer tomography, magnetic resonance imaging, and nuclear scans (54). The specific types of protein, such as albumin or low molecular weight globulins, that are excreted through urine depend on the type of kidney disease. For example, albuminuria (i.e., increased excretion of albumin) is a sensitive marker for CKD due to diabetes, glomerular disease, and hypertension. Increased excretion of low molecular weight globulins is a sensitive marker for some types of tubulointerstitial disease (50).
Table 1. Stages of chronic kidney disease (age ≥20 years)
Stage Description
GFR mL/min/1.73 m2 1 Kidney damage with normal or increased GFR* ≥ 90
2 Kidney damage with mild decreased GFR* 60-89
3 Moderate decreased GFR 30-59
4 Severe decreased GFR 15-29
5 Kidney failure/ESRD < 15
Adapted from KDOQI clinical practice guidelines for chronic kidney disease (2002) (50). An estimated GFR above 60 mL/min/1.73 m2, in the absence of other anatomic, radiographic, or urinary abnormalities is not classified as CKD.
End-stage renal disease (ESRD) is the final stage of CKD that occurs when renal function is insufficient to sustain life and renal replacement therapy (RRT), such as hemodialysis, peritoneal dialysis, or renal transplantation, is necessary for survival. ESRD is a syndrome characterized by hypertension, anemia, renal/metabolic bone disease, nutritional impairment, neuropathy, impaired quality of life, and reduced life expectancy (55).
5. Pathogenesis of ESRD
The progressive nature of renal disease has been characterized as a final common pathway of mechanisms, independent of the primary cause of nephropathy (56). Thus, CKD is a generic term for all of the clinical conditions with differing pathogenesis and widely varying pathologic characteristics that lead to the same pattern of chemical and functional derangements in the kidney which can eventually lead to renal failure (57).
The central tenets of the common pathway theory state that CKD progression occurs through focal nephron loss and that the adaptive responses of surviving nephrons, although initially serving to increase single-nephron GFR and offset the overall loss in clearance, ultimately prove detrimental to the kidney. As the number of functional nephrons decreases, each residual nephron must perform a greater fraction of total renal function. In order to maintain balance of any specific solute and avoid retention of body fluid, the quantity excreted by each nephron must increase as the total population of functioning nephrons decreases. As kidney damage progresses, the remaining nephrons compensate for the reduction in nephron mass by increasing the single nephron filtration rate, and this hyperfiltration promotes further kidney injury. Raised glomerular hydraulic pressure (glomerular hypertension) appears to be the major effector of glomerular injury following renal mass reduction. Over time, glomerulosclerosis and tubular atrophy further reduce nephron number, fueling a self-perpetuating cycle of nephron
destruction culminating in uremia (56, 57).
After GFR falls to a critical threshold (i.e., approximately less than 50% of normal renal function), a progressive further loss of function ensues which leads to proteinuria, systemic hypertension,
glomerulosclerosis, and eventual renal failure. This phenomenon has been observed in rats after partial ablation of renal mass as well as humans with diverse renal diseases, including individuals born with greatly reduced nephron number (i.e., congenital oligomeganephronia). In rats, a maximal increase of approximately 50% of GFR of a single kidney was reported at 8 days after uninephrectomy and a 300% increase in GFR of the remnant kidney was observed at 16 days after 5/6 nephrectomy (58). In humans, the effects of nephron loss on the physiology of the remnant kidney have been studied mainly in healthy individuals undergoing donor nephrectomy for kidney transplantation. A meta-analysis of data from 48
studies that included 2,988 living human kidney donors estimated that single-kidney GFR (and therefore also the average single-nephron GFR) increased by 30% to 40% after uninephrectomy (59, 60).
6. Risk factors for progression to ESRD
Risk factors for CKD can be separated into susceptibility, initiation, and progression factors. Susceptibility factors predispose to CKD, initiation factors trigger kidney damage, and progression factors contribute to progression of kidney damage after CKD has developed. This section focuses on
progression to ESRD. Briefly, kidney function progressively declines in most patients with CKD after sufficient damage has occurred to lower the GFR, regardless of the cause of the initial renal injury. While the rate of GFR decline is often relatively constant over time in an individual patient, the rate of GFR decline is highly variable among patients, ranging from slowly progressive over decades to rapidly progressive over months. The high variability in the rate of progression of CKD between individuals suggests that risk factors exist that may influence the course of the renal disease. The major risk factors for progression to ESRD include age, race/ethnicity, diabetes, hypertension, glomerulonephritis, elevated serum creatinine, obesity, smoking, and use of nonsteroidal anti-inflammatory drugs (61-63).
7. Treatment modalities: hemodialysis, peritoneal dialysis, kidney transplantation
RRT options for ESRD patients include hemodialysis, peritoneal dialysis and renal
transplantation. Renal transplantation is the preferred method for treatment because it is associated with longer survival, less hospitalizations, better quality of life, and lower costs compared with dialysis (2, 64). Preemptive transplantation, which is transplantation performed before dialysis is ever initiated, is
associated with better outcomes than transplantation following dialysis (65). Change in modality is much more common for peritoneal dialysis to hemodialysis than from hemodialysis to peritoneal dialysis, and that change in treatment from peritoneal dialysis to hemodialysis is associated with an increased risk of hospitalization and mortality (66). The optimal time for initiation of RRT varies by modality, clinical characteristics and sociodemographic characteristics. Patients who receive a preemptive transplant or initiate peritoneal dialysis begin RRT therapy at higher mean levels of GFR than patients who initiate
hemodialysis. Dialysis is initiated at higher mean levels of GFR among patients who are older, or who have diabetes, cardiovascular disease, or other comorbid conditions (2, 50). A detailed description of all RRT modalities is presented below.
Hemodialysis. The purpose of hemodialysis is to deliver blood reliably from the patient to the dialyzer, to enable an efficient removal of uremic toxins and fluid, and to deliver the cleared blood back to the patient. Vascular access is a necessary step prior to dialysis. The main components of the dialysis system are the extracorporeal blood circuit, the dialyzer, the dialysis machine, and the water purification system. The dialysis machine delivers dialysis fluid with the intended flow rate, temperature, and chemical composition. The dialysis machine has monitoring and safety systems for air, blood, conductivity, and pressure; blood and dialysate pumps; a heating system; a dialysate mixing and degassing unit; and an ultrafiltrate balancing system. The role of the water purification system is to produce water for dialysis that complies with set chemical and microbiologic standards (67). Thus, hemodialysis replaces the work of the damaged kidneys by using an artificial kidney machine to filter blood. Hemodialysis is conventionally delivered in three treatment sessions per week, except for occasional patients with substantial residual renal function that opt for two treatment sessions per week. Typical treatment lengths are 3 to 4 hours per session (67). Hemodialysis is almost always performed in dialysis facilities and rarely performed at home. Sixty percent of dialysis patients are treated in units owned by Fresenius or DaVita, and the remainder are treated in units owned by Dialysis Clinic, Inc., other small dialysis organizations, or hospital-based facilities (2).
Peritoneal dialysis. The purpose of peritoneal dialysis is to provide a continuous mode of removal of small solutes and excess body water, thus maintaining relatively stable blood chemistry and body hydration status. The peritoneal cavity, which is the largest serosal space in the body, is used as a container for 2 to 2.5 liters of sterile, usually glucose-containing dialysis fluid. The peritoneal membrane acts as an endogenous dialyzing membrane through which waste products diffuse to the dialysate and excess body fluid is removed by osmosis. Ultrafiltration is induced in the dialysis fluid using glucose or another osmotic agent. The dialysis fluid is provided in plastic bags and is exchanged four or five times daily through a permanent peritoneal indwelling catheter. A catheter is necessary to provide obstruction-free access to the peritoneum and can be inserted surgically at the patient’s bedside by an experienced nephrologist or
a surgeon or through a laparoscopic insertion (68). Peritoneal dialysis is a home-based therapy, and most patients are trained to do the bag exchanges themselves. Peritoneal dialysis is usually provided 24 hours a day and 7 days a week in the form of continuous ambulatory peritoneal dialysis (69).
Renal transplant. Transplantation is performed to replace the damaged kidneys with a functional kidney. Only one donated kidney is necessary to resume renal function. In preparation for transplantation, patients undergo a comprehensive evaluation of medical, surgical, and psychosocial histories (70-72). The availability of more potent immunosuppression and improvements in human leukocyte antigen (HLA) typing and crossmatching have made it feasible for immunologically high-risk patients to be considered candidates for transplantation (73). Three sources of kidneys for transplantation in order of most to least frequent are: donation before cardiac death donors, donation after cardiac death cadaveric donors, and live donors. Preservation of deceased donor organs is crucial to allow time for matching, sharing of organs, and preparation of the recipient. Organs are preserved by cold storage (kept in crushed ice after flushing with preservation solution) or by machine-driven pulsatile perfusion (74). The renal
transplantation procedure involves general anesthesia before surgery. The kidney is placed into the iliac fossa. The external iliac artery and vein are mobilized. Surrounding lymphatic vessels are ligated and divided. End-to-side anastomoses are performed between the renal vein and the external iliac vein, followed by the renal artery and the external iliac artery. The ureter is implanted into the bladder (74, 75). Blood is then able to flow through the transplanted kidney, and the kidney should begin to filter and remove wastes and to produce urine. Kidney transplant surgery takes about three hours. After transplant, immunosuppressive medications are administered to prevent organ rejection (73). Major postoperative complications are rare. Surveillance of laboratory testing in the kidney transplant recipient is a routine and critical part of post-transplant management because early detection and treatment of graft dysfunction is crucial for preservation of allograft function.
8. Clinical and preventive care of ESRD patients
Given the risks and associated complications of infections in ESRD patients on dialysis, strategies to effectively improve overall care and prevent complications are of paramount importance.
Although the majority of national guidelines emphasize the importance of timely preparation for dialysis and clinical management of dialysis recipients, several measures fall far short of recommended
guidelines. A number of clinical indicators and preventive care measures are discussed below, including early referral to a nephrologist, vascular access, dialysis adequacy, diabetic management, and
vaccinations. Anemia management is summarized later in the chapter.
Early referral to a nephrologist. Adequate preparation for initiation of dialysis is important for patients with progressive CKD approaching renal failure. The Kidney Disease Outcomes Quality Initiative (KDOQI) Clinical Practice Guidelines for CKD recommend that CKD patients with GFR less than 30 mL/min/1.73 m2 should be referred to a nephrologist (50) as patients referred earlier to nephrology services have reduced mortality, hospitalization and vascular access infections (2, 76, 77). Improved prognosis among patients with early referral appears to be independent of differences in traditional cardiovascular risk factors and instead related to careful management during the transition to ESRD. Specific explanations include informed selection of RRT, placement and maturation of vascular access, workup for kidney transplantation, counseling for coping with the psychosocial effects of starting RRT, and arrangement of family and work commitments (77, 78). Effective preparation for RRT requires input from multiple staff disciplines (e.g., medical, nursing, pharmacy, dietetics, psychology and social work) and is best delivered in a multidisciplinary clinic (78). In 2010, 25.4% of ESRD patients in the United States had seen a
nephrologist for at least 12 months prior to RRT initiation (2).
Vascular access. Functional vascular access is necessary for hemodialysis. Certain types of vascular access are associated with substantially higher risks of infectious morbidity and mortality. Several types of vascular access used in hemodialysis, listed in order of increasing risk of infection, are as follows:
arteriovenous fistulas (AVFs) created from the patient’s own blood vessels; arteriovenous grafts
constructed from synthetic materials; tunneled central venous catheters; and nontunneled central venous catheters (79, 80). Compared with AVFs, dialysis catheters are associated with a nearly two-fold
increased risk for bacteremia or sepsis (81) and a more than two-fold increased risk for infection-related mortality (82). Guidelines from the KDOQI Clinical Practice Guidelines for Vascular Access (83) and the
Fistula First initiative (84) recommend that catheter use be reduced and that more patients use an AVF. Despite this consensus, AVF utilization has historically been very low. In 2010, only 36% of incident hemodialysis patients in the United States had an AVF access either in use or maturing at the first outpatient dialysis treatment (2).
Dialysis adequacy. Patients with renal failure require dialysis to remove uremic toxins from the blood because their damaged kidneys can no longer metabolize and secrete these toxins into the urine. Urea is only mildly toxic, but a high urea level indicates simultaneous retention of many other waste products that are more harmful and not as easily measured. Dialysis adequacy refers to the delivery of a dialysis dose that is sufficient to remove waste products such as urea from the blood and to ultimately promote an optimal long-term outcome (85). Poor dialysis adequacy has been associated with morbidity in hemodialysis patients at dialysis doses well below the current standard (86), however, the current standard seems appropriate (79, 87). The KDOQI Clinical Practice Guidelines for Vascular Access recommend that dialysis adequacy be assessed by monthly measurement of the delivered dose of dialysis (79). The delivered dose of dialysis is assessed by the removal of urea and expressed either by the urea reduction ratio (URR) or by the treatment index Kt/V. URR refers to the treatment-related reduction of serum urea concentration and is computed as follows: URR (%) = (1 - Ct/C0) x 100% where Ct is post-dialysis and C0 is predialysis serum urea concentration. URR correlates well with dialysis outcome and is an accepted method for assessment of dialysis adequacy (85). A minimum URR of 65% to 70% is recommended for adequate hemodialysis (79). Alternatively, the treatment index Kt/V is the most widely used parameter to assess dialysis dose. Kt/V is a dimensionless number representing urea volume cleared (K x t, in liters) divided by urea volume of distribution (V, in liters), where K is the dialyzer blood water urea clearance (liters per hour), t is dialysis session length (hours), and V is the distribution volume of urea (liters), which equates closely to total body water (85). A minimum Kt/V of 1.2 and 1.7 is recommended for adequate hemodialysis and peritoneal dialysis, respectively (79). A patient's URR or Kt/V can be increased either by increasing time on dialysis or increasing blood flow through the dialyzer. In 2010, 94.0% of hemodialysis patients achieved URR greater than or equal to 65% and 87.1% of peritoneal dialysis patients achieved a minimum Kt/V of 1.7 (2).
Diabetic management. Diabetes is the most common cause of ESRD in the United States (2, 88). Among ESRD patients, diabetes is a strong risk factor for infections, cardiovascular disease, hospitalizations and mortality (2, 82). Glycemic control can be achieved with insulin or oral hypoglycemic agents, however, ESRD patients face therapeutic challenges such as prolongation of insulin half-life and accumulation of oral hypoglycemic agents that make self-monitoring of blood glucose concentration imperative (89). Additional therapeutic challenges in this population include hypertension, hypervolemia, malnutrition and bacterial infections (90). Microvascular (e.g., retinopathy and polyneuropathy), macrovascular (e.g., coronary heart disease, left ventricular hypertrophy, congestive heart failure, stroke and periperal artery occlusive disease) and mixed (e.g., diabetic foot) complications are common, thus patients should be monitored at regular intervals for timely detection (90). Comprehensive diabetic monitoring includes at least four glycosylated Hgb (A1c) tests, two fasting lipid profile tests, and one eye examination yearly. Although the rate of comprehensive monitoring among ESRD patients with diabetes has been increasing over time, between 2009-2010 only 17.2% of prevalent diabetic ESRD patients in the United States received all three types of recommended preventive care (2).
Vaccinations. Viral infections are a common cause of morbidity and mortality in ESRD patients, therefore the Centers for Disease Control and Prevention recommends that dialysis patients receive regular influenza, pneumococcal and hepatitis vaccinations. Although dialysis patients have lower response rates to vaccination compared with the general population, immunogenicity studies report development of protective antibody levels for the majority of influenza, pneumococcal and hepatitis B strains (91-94). Vaccine administration to dialysis patients has been reported to be a cost-effective approach for prevention of infections (95-97), however, recent reports of limited vaccine effectiveness raise concerns about vaccination policies in the ESRD population (98, 99). To date vaccination remains an underutilized prevention strategy in the ESRD population, with rates of vaccination far below the Healthy People 2020 target of 90%. In 2009, rates of vaccinations in prevalent ESRD patients receiving hemodialysis were as follows: influenza (69%), pneumococcal pneumonia (30%), hepatitis B (28%). Rates should be interpreted with caution, as patients may be vaccinated through non-Medicare programs (2).
B. Epidemiology of ESRD in the United States
1. Incidence and prevalence of ESRD
More than 114,000 new ESRD cases initiated RRT in 2010, for an adjusted ESRD incidence rate of 348 per million population. The rate of incident ESRD cases per million population has been relatively stable since 2000, and rose just 1.1% in 2009, to 355 cases per million population (adjusted for age, gender and race). The prevalence of ESRD has been steadily increasing. Nearly ten times more patients in the United States were treated for ESRD in 2009 compared to 1980. Since 2000, the adjusted rate of prevalent ESRD has increased nearly 23%. The annual rate of increase has remained between 1.9% and 2.4% since 2003. Of more than 593,000 prevalent ESRD cases receiving RRT at the end of 2010, the distribution of treatment modalities were as follows: hemodialysis, 64.7%; renal transplantation, 30.2%; and peritoneal dialysis 5.0%. A total of 87,932 were on the renal transplant waiting list, which has a median wait time of 2.6 years (2).
The incidence of ESRD varies considerably across patient subgroups (Table 2). ESRD incidence increases with age and is more common among men than women. In 2010, the incidence rate of ESRD was 3.4 times higher in blacks and 1.7 times higher in Native Americans compared to whites. Compared to the non-Hispanic population, the Hispanic population had an incidence rate 1.5 times higher. Similarly, the ESRD prevalence in 2010 was higher among minority groups: blacks, 5234 per million population (pmp); Hispanics, 2602 pmp; Native Americans, 2563 pmp; Asians, 2098 pmp; and whites, 1309 pmp. Rates of ESRD vary substantially by geography. The highest adjusted rates occur in the Ohio Valley, portions of Texas and California, and the southwestern states.
Table 2. Incident and prevalent counts and adjusted rates of ESRD by age, gender, race and ethnicity, U.S., 2010*
Incidence Prevalence
Number of patients Rate per million** Number of patients Rate per million** Age
20-44 13,404 127 98,008 937
45-64 43,663 579 261,445 3,395
65-74 27,029 1,365 119,751 6,062
75+ 28,640 1,771 93,202 5,862
Gender
Male 64,905 440 328,529 2,166
Female 49,127 275 251,226 1,423
Race
White 75,514 275 353,849 1,309
Black 31,686 923 186,482 5,234
Native
American 1,389 465 7,958 2,563
Asian 5,443 387 31,466 2,098
Ethnicity
Hispanic 15,273 501 85,062 2,602
Non-Hispanic 98,759 337 494,693 1,714
*These data exclude patients with missing demographic information. **Adjusted for age, gender, race and ethnicity, as appropriate.
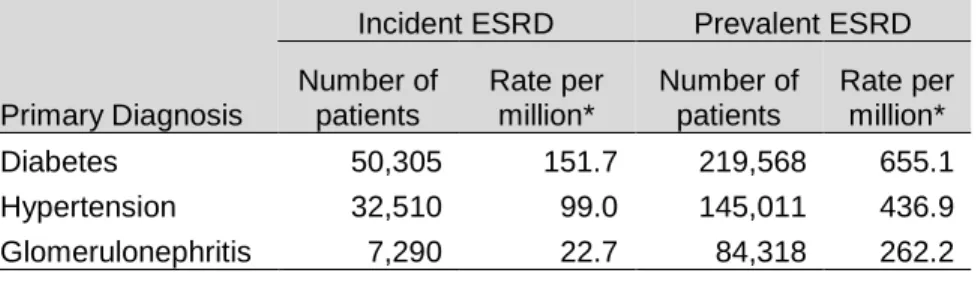
In the United States, the three most common primary diagnoses for ESRD are diabetes,
hypertension and glomerulonephritis (Table 3). Since 2000, the rate of incident ESRD caused by diabetes has remained quite stable (with the exception of an increase in 2006), the rate of incident ESRD due to hypertension has increased 9%, and the rate of incident ESRD due to glomerulonephritis has decreased 23%. In 2010, the primary diagnoses of diabetes and hypertension were associated with 44% and 29% of incident ESRD patients, respectively (2).
Table 3. Incident and prevalent counts and adjusted rates of ESRD by most common primary diagnoses, U.S., 2010
Incident ESRD Prevalent ESRD
Primary Diagnosis Number of patients Rate per million* Number of patients Rate per million*
Diabetes 50,305 151.7 219,568 655.1
Hypertension 32,510 99.0 145,011 436.9
Glomerulonephritis 7,290 22.7 84,318 262.2
*Adjusted for age, gender, race and ethnicity.
2. Kidney transplantation in the ESRD population
In 2010, 16,843 kidney transplants were performed in patients ≥20 years in the United States. Among incident ESRD patients in 2009, 22% were added to the waiting list or received a transplant within one year of ESRD certification, a proportion remaining fairly stable over the past two decades. The median wait time for patients transplanted in 2010 was 2.6 years. The number of adult candidates on the kidney transplantation waiting list with certified kidney failure continues to increase, with a 6% increase in 2010 to reach 75,807 patients on December 31 (2). Of patients listed on the transplant wait list in 2006, substantially more whites (21%) than blacks (9%) received a living donor transplant within three years. After three years, 47% of blacks and 31% of whites were still waiting for a transplant (100).
3. Mortality in the ESRD population
Mortality is exceptionally high in the ESRD population. The most common causes of death in United States prevalent dialysis patients between 2008 and 2010 were cardiovascular events (41.5%), infections (10.9%), withdrawal of dialysis (10.5%) and malignancy (3.7%). Survival probabilities for the 2004 USRDS cohort of incident ESRD patients was 75% at one year, 50% at three years, and 34% at five years following dialysis initiation (100). Mortality is highest during the first year of dialysis. Specifically, mortality rates are lowest within the first month, peak in the second and third month, and slowly decline in months four through twelve to return to a similar rate as the first month (2, 101). For incident hemodialysis patients in 2009, all-cause mortality reached 435 deaths per 1,000 patient-years at risk in month two, then fell to 206 by month 12. Cardiovascular mortality peaked at 169 in month two, and decreased to 78.
Infection-related mortality peaked in months two and three, at 40-43 deaths per 1,000 patient-years at risk. Hemodialysis and peritoneal dialysis patients have similar survival probabilities during the first year of treatment, although the risk of death appears to be higher for peritoneal dialysis in the second year (102). Prevalent death rates have been falling for a number of years, and mortality in the first year of dialysis has, since 2004, continued to decline, reaching rates which are the lowest in 30 years (2).
It is well-established that black ESRD patients on dialysis experience better survival compared to whites, despite the higher mortality rates in blacks versus whites in the general population and in earlier stages of CKD. Among 20 cohort studies from North America and Canada that examined black-white differences in all-cause mortality among ESRD patients on dialysis therapy, adjusted hazard ratio estimates comparing blacks to whites or non-blacks ranged between 0.4 and 1.0 (103-122). The wide variability in estimates of the black-white disparity in all-cause mortality is likely attributable to differences in the following study characteristics: time origin for analysis (range, 0 days to 1 year after dialysis initiation among incident ESRD patients), variable follow-up period (range, 90 days to 14.8 years), inclusion of prevalent dialysis users (n=4 studies), inclusion of peritoneal dialysis users (n=16 studies), small sample of black patients (minimum = 45 blacks), population-specific prevalence of comorbidities including diabetes mellitus and hypertension, methods to account for competing events (e.g.,
transplantation, change in dialysis modality, dialysis withdrawal), and availability of data on vascular access status, laboratory assessments, and provider characteristics. No meta-analyses have been conducted to date. However, the adjusted hazard ratio of 0.84 (95% CI, 0.83-0.84) reported by Kucirka et al. (106) likely represents the best estimate due to the large USRDS population (N=1,330,007), the large sample size of blacks (n=407,140), the time origin of ESRD onset, the long follow-up period (14.8 years), and exploration of subgroups (e.g., age is an effect modifier).
4. Economic burden of ESRD
The direct financial cost of care for the ESRD population is substantial. In 2009, national expenditure reached $42.5 billion, including $29 billion for Medicare spending and $13.5 billion for non-Medicare spending. Although ESRD patients only account for 1.3% of non-Medicare patients, ESRD patients account for 8.1% of Medicare spending. Annual Medicare costs per patient were $82,285 for
hemodialysis recipients, $61,588 for peritoneal dialysis recipients and $29,983 for transplant patients (100). These costs only partially capture the full economic burden of ESRD, which includes the costs of chronic disability, premature mortality, and diminished quality of life (55).
C. Cancer in the ESRD population
1. Cancer burden in the ESRD population
Prevalence. In the USRDS data, information on history of cancer before dialysis initiation is ascertained on the Medical Evidence Report by a question about “malignant neoplasm/cancer in the last 10 years.” Studies commonly report cancer prevalence estimates from this data as baseline characteristics of the study population. For example, a recent study of incident hemodialysis patients reported a steady increase over the study period in cancer prevalence from 3.9% in 2002 to 4.7% in 2008 (123). In another study of ESRD patients who initiated hemodialysis between 1995 and 2009, estimates of cancer
prevalence varied substantially by age and race: white patients 18-30 years (1.0%); white patients 31-50 years (2.6%); white patients >50 years (8.4%); black patients 18-30 years (0.5%); black patients 31-50 years (1.5%); and black patients >50 years (5.8%) (106).
Incidence. The incidence of cancer is not well characterized in the dialysis population (17). Annual estimates of cancer incidence rates do not exist. Two studies that report standardized incidence ratios (SIRs) for overall and site-specific cancers in ESRD patients compared to the general population (Table 4) do not directly report site-specific cancer incidence estimates, however, the data necessary for calculation of cancer incidence over the study periods (i.e., 1980-1994 (15) and 1982-2003 (16)) are presented in the publication tables.
Mortality. According to the 2012 USRDS Annual Data Report, mortality was attributable to malignancy in 5.0% of incident dialysis patients (i.e., first 180 days of dialysis) and 3.7% of prevalent dialysis patients in the period between 2008-2010 (2). Otherwise, mortality studies in dialysis patients primarily report on
cause or cardiovascular mortality, with very little focus on cancer mortality. One recent exception is the 2010 study of U.S. hemodialysis patients that reported stable cancer-specific mortality rates between 1995 and 2005. Crude first-year cancer-specific mortality rates for 1995 and 2005 were 13.8 and 15.2 deaths per 1,000 patient-years, respectively (18). These rate estimates are limited by lack of covariate adjustment and highly inaccurate cause of death data from the Death Notification form (CMS-2726) (124, 125).
2. Epidemiologic studies of cancer risk in the ESRD population
ESRD patients on dialysis have a modestly increased risk for many cancers compared to the general population (Table 4) (15-17, 23). A large, international, collaborative study (n=831,804) from three registry populations from the United States, Europe, and Australia/New Zealand with data from 1980-1994 reported that ESRD patients on dialysis had an elevated risk of many cancer sites, including kidney (SIR=3.60 (95% CI, 3.45-3.76)), bladder (SIR=1.50 (95% CI, 1.42-1.57)), and thyroid and endocrine organs (SIR=2.28 (95% CI, 2.03-2.54)) compared to the background population (accounting for age, sex, race, country, and calendar time). Other sites with excess cancer risk included Kaposi’s sarcoma and tumors of the oral cavity, stomach, liver, lung and cervix (15). A more recent analysis of the Australia/New Zealand registry (n=24,926) included extended follow-up (1982-2003) and reported similar cancer site-specific risk estimates as reported by Maisonneuve et al (16). A 2012 population-based case-control study among U.S. elderly adults (1,029,695 cancer cases and 99,610 controls) reported similar elevated risks for cancers of the stomach, small intestine, colon, liver, biliary tract, lung, cervix, and kidney, as well as multiple myeloma and chronic myeloid leukemia. No increase in risk was identified for cancers
previously reported to have increased risk such as thyroid cancer, non-Hodgkin lymphoma (modest inverse association), Hodgkin lymphoma, and Kaposi sarcoma (23). These studies reported excess cancers in several organs for which viruses have been suspected as causative agents (e.g., hepatitis B and C/liver cancer; Epstein-Barr/lymphoma; HPV/ tongue, cervix, vagina, vulva, penis cancers) (15, 16, 23).
24
Table 4. Published studies of cancer incidence in the dialysis population Data source &
study population
Years N Cancer (N or %) Overall cancer
relative risk (95% CI)
Site-specific cancer (N)
Site-specific cancer relative risk (95% CI)
Maisonneuve et al (1999)
Three national dialysis registries with cancer information Australia & NZ Europe U.S.
1980-1994 831,804 dialysis patients Pooled 25,044 By region 500 6,849 17,695 Pooled 1.18 (1.17-1.20) By region 1.8 (1.7-2.0) 1.1 (1.0-1.1) 1.2 (1.2-1.2) Kidney (2,053) Bladder (1,646) Thyroid & other
endocrine organs (314)
3.60 (3.45-3.76) 1.50 (1.42-1.57) 2.28 (2.03-2.54)
Vajdic et al. (2006)
Population-based cohort of ANZDATA & Australian National Cancer Statistics Clearing House
1982-2003 28,855 dialysis patients
1,136
870, excluding cancers known to frequently cause ESRD (i.e., kidney, renal pelvis, myeloma, bladder, ureter, and other urinary organs)
1.98 (1.88-2.09) 1.35 (1.27-1.45)
25
Shebl et al. (2012)
Population-based case-control study among US elderly using SEER-Medicare data
1992-2005 1,029,695 cancer cases & 99,610 controls
ESRD in:
- 0.35% cancer cases - 0.36% controls
1.02 (0.91-1.14) Stomach (118) S. intestine (24) Colon (390) Liver (63) Biliary tract (27) Lung (661) Cervix (28) Multiple myeloma (92) Chronic myeloid leukemia (18) 1.45 (1.16-1.81) 1.92 (1.27-2.92) 1.17 (1.00-1.36) 1.53 (1.16-2.01) 1.78 (1.20-2.65) 1.17 (1.02-1.34) 2.12 (1.39-3.23) 1.77 (1.40-2.24) 1.74 (1.08-2.80)