NONFLAMMABLE PERFLUOROPOLYETHER ELECTROLYTES FOR SAFER LITHIUM-BASED BATTERIES
Kevin Raymond Olson
A dissertation submitted to the faculty at the University of North Carolina at Chapel Hill in partial fulfillment of the requirements for the degree of Doctor of Philosophy in the Department
of Chemistry.
Chapel Hill 2017
Approved by:
© 2017
ABSTRACT
Kevin Raymond Olson: Nonflammable Perfluoropolyether Electrolytes for Safer Lithium-Based Batteries
(Under the direction of Joseph M. DeSimone)
The importance of batteries to sustainable energy is widely recognized. Lithium-ion batteries (LIBs) not only power handheld electronics but also are increasingly being implemented in electric vehicles and “smart-grid” applications to store energy from intermittent solar and wind sources, making sustainable energy a reality. Unfortunately, LIBs contain a highly flammable solvent and can exhibit catastrophic failure, as was brought to the public’s attention by the Boeing 787, Samsung Galaxy Note 7, hoverboard, and Tesla battery fires. Thus, realizing the full potential of LIBs in large-scale systems requires the development of nonflammable electrolytes.
ACKNOWLEDGMENTS
I would like to acknowledge Dr. Mahati Chintapalli, Ksenia Timachova, Deep Shah, and Jiefu Yin, who did tremendous work to characterize ion transport and battery performance of these systems. It has truly been a pleasure for me to work with a group of such talented and personable researchers. I would also like to thank the principal investigators and research associates leading this collaboration—Dr. Nitash Balsara, Dr. Amy Marschilok, Dr. Esther Takeuchi, and Dr. Kenneth Takeuchi—for their insightful contributions to the work herein. I thank Dr. Sue Mecham, Dr. Bob Pinschmidt, and Dr. Ali Nebipasagil for their insightful and stimulating conversation and for continuing to nurture my growth as a scientist. I appreciate the time and insights of my other committee members as well—Dr. Frank Leibfarth, Dr. Sergei Sheiko, and Dr. Mark Wightman.
I’d like to express my sincere gratitude to my principal investigator, Professor Joseph DeSimone. I am humbled by the opportunity Professor DeSimone gave me to become a part of his research group, and I consider it an honor to have been guided both scientifically and professionally by him. I also appreciate all of my previous research advisors and mentors who instilled an enjoyment of the sciences in me and gave me the confidence to pursue a career in the sciences. I particularly thank Dr. Moses Lee and Dr. Tom Guarr for their wisdom that continues to influence me both personally and in my scientific career.
TABLE OF CONTENTS
LIST OF TABLES ... xii
LIST OF FIGURES ... xiii
LIST OF CHEMICAL REACTION SCHEMES ... xx
LIST OF ABBREVIATIONS AND SYMBOLS ... xxi
Chapter 1: Introduction to Lithium-Ion Battery Electrolytes ... 1
1.1 Importance of Batteries in the Global Energy Landscape ... 1
1.2 Development of Lithium-Ion Batteries ... 2
1.3 Principles of Lithium-Ion Battery Operation ... 3
1.4 Electrolyte Hazards ... 5
1.4.1 Failure Rates ... 5
1.4.2 Failure Mechanism ... 6
1.5 Criteria for Evaluating Novel Battery Electrolytes ... 7
1.5.1 Flammability and Temperature Range ... 7
1.5.2 Electrochemical Stability ... 9
1.5.3 Cyclability ... 10
1.5.5 Transference Number ... 12
1.5.5.1 Potentiostatic Polarization Method for Measurement of t+ ... 13
1.5.5.2 Pulsed-Field Gradient NMR (pfg-NMR) Method for Measuring t+ ... 14
1.6 Current Research in LIB Electrolytes ... 17
1.6.1 Electrolyte Additives ... 18
1.6.2 Room-Temperature Ionic Liquids (RTILs) ... 19
1.6.3 Polymer Electrolytes ... 20
1.6.3.1 Ion Solvation ... 22
1.6.3.2 Ion Transport ... 23
1.6.4 Perfluoropolyether (PFPE) Materials ... 24
1.6.4.1 Commercially Available Perfluoropolyethers ... 24
1.6.4.2 Perfluoropolyether Synthesis ... 25
1.6.4.3 Perfluoropolyether Electrolyte Properties ... 28
REFERENCES ... 33
Chapter 2: Perfluoropolyether Electrolytes with Oligoether End Groups ... 42
2.1 Introduction ... 42
2.2 Materials and Sample Preparation ... 44
2.3 Experimental ... 45
2.3.1 Synthesis of DMC-terminated PFPE ... 45
2.3.3 Electrolyte Physical Properties Characterization. ... 46
2.3.4 Characterization of Ion Transport ... 46
2.4 Results and Discussion ... 47
2.5 Conclusion ... 59
REFERENCES ... 60
Chapter 3: Effects of PFPE End Group Polarity on Ion Solvation and Transport ... 65
3.1 Background on Ion Solvation and Dissociation ... 65
3.2 Part 1: Dependence of Ion Solvation and Transport on PFPE End Group ... 67
3.2.1 Ionic Conductivity ... 68
3.2.2 Transference Number ... 70
3.3 Part 2: Systematic Exploration of End Group Polarity in PFPE-EO Electrolytes ... 73
3.3.1 Materials ... 74
3.3.2 Experimental ... 74
3.3.2.1 General Synthesis of PFPEE10-Carbonates... 74
3.3.2.2 Physical Characterization of PFPE-EO Electrolytes ... 76
3.3.3 Results ... 77
3.4 Part 3: Systematic Exploration of End Group Polarity in PFPED10H Electrolytes ... 82
3.4.1 Experimental ... 83
3.4.1.2 Synthesis of PFPED10H –Trifluoromethyl Ester (PFPE-TFME) ... 84
3.4.1.3 General Synthesis of PFPED10H- Carbonates ... 85
3.4.1.4 Synthesis of PFPED10H-Diethylene Carbonate (PFPE-DEC) ... 86
3.4.1.5 Physical Characterization of PFPE Electrolytes ... 89
3.4.2 Results and Discussion ... 90
3.4.3 Conclusions ... 97
REFERENCES ... 99
Chapter 4: Effects of End Group Concentration and Molecular Weight on PFPE Electrolyte Performance ... 105
4.1 Introduction ... 105
4.2 Experimental ... 108
4.2.1 Materials ... 108
4.2.2 General Synthesis of Perfluorinated Glycols with Methyl Carbonate End Groups ... 108
4.2.3 Synthesis of PFPED10H-Diallyl Ether Intermediate (PFPE-DAE) ... 110
4.2.4 Synthesis of Tetra-hydroxy terminated PFPED10H (PFPE-Tetra-ol) ... 110
4.2.5 Synthesis of PFPED10H-Thioether-Diol (PFPE-TE-Diol) ... 111
4.2.6 Synthesis of Ethylene bis(carbonate)-linked PFPED10 [(PFPED10 -EBC)n] ... 112
4.2.7 Physical Characterization of PFPE Electrolytes ... 113
4.2.8 Measurement of Ion Transport Properties ... 114
4.3.1 Introduction ... 117
4.3.2 Results and Discussion ... 119
4.3.2.1 Synthesis and Physical Properties ... 119
4.3.2.2 Lithium Salt Solubility ... 120
4.3.2.3 Thermal Stability ... 122
4.3.2.4 Polymer-Ion Interactions... 124
4.3.2.5 Ionic Conductivity ... 126
4.3.2.6 Transference Number ... 127
4.3.3 Summary ... 129
4.4 Part 2: End Group Concentration Effects on Electrolyte Performance ... 130
4.4.1 Introduction ... 130
4.4.2 Results and Discussion ... 131
4.4.2.1 Development of Thiol-Ene Reaction in PFPE Systems ... 131
4.4.2.2 Synthesis of PFPE with Branched End Groups ... 134
4.4.2.3 Lithium Salt Solubility ... 136
4.4.2.4 Ionic Conductivity and Transference ... 138
4.5 Part 3: Effect of Changing Molecular Weight at Constant Carbonate Concentration ... 139
4.5.1 Introduction ... 139
4.5.2 Results and Discussion ... 140
4.5.2.2 Lithium Salt Solubility ... 141
4.6 Conclusions... 142
REFERENCES ... 144
Chapter 5: Recommendations for Future Work... 148
5.1 Introduction ... 148
5.2 Probing the Interaction between Fluorinated Anions and PFPE ... 148
5.2.1 Introduction ... 148
5.2.2 Recommendations for Spectroscopic Analysis of Perfluoroether-Anion Interaction ... 150
5.3 Inducing Microphase Separation in PFPE Electrolytes for Unique Ion Transport ... 153
5.3.1 Introduction ... 153
5.3.2 Recommendations for Future Work: PEO-PFPE-PEO Triblock Copolymers ... 154
5.3.3 Recommendations for Characterization of PEG-PFPE-PEG Triblock Copolymers ... 156
LIST OF TABLES
Table 1.1 Molecular structures of commercially available PFPEs. ... 24 Table 1.2 Selection of commercially available Fluorolink® end groups. ... 25 Table 2.1 Abundance and structural differences between coupled products of
Figure 2.4. ... 51 Table 2.2 Physical properties of PFPE polymers... 52 Table 2.3 VFT fit parameters for PFPE electrolytes at 9.1 wt.% LiTFSI. ... 57 Table 3.1 Rate of increase in Tg and η as a function of salt concentration in
PFPEE10 electrolytes. ... 81
Table 3.2 Rate of increase in Tg as a function of salt concentration in PFPED10H
electrolytes. ... 95 Table 4.1 Commercially available perfluorinated glycols from Exfluor Research
Corporation. ... 118 Table 4.2 Thermal transitions of PFPE materials. ... 120 Table 4.3 5% mass loss temperature and flash point of electrolyte materials. ... 123 Table 4.4 Rate of increase in Tg as a function of salt concentration in PFPE-DMC
electrolytes. ... 124 Table 4.5 Reaction efficiencies between PFPE-enes and thiols of varying
molecular weight. ... 133 Table 4.6 Reaction efficiency of PFPE-enes with thioglycerol under various
LIST OF FIGURES
Figure 1.1 U.S. energy consumption by source in 2016. Reprinted from ref. [3]. ... 1 Figure 1.2 Curent and projected federal government energy consumption.
Reprinted from ref. [4]. ... 2 Figure 1.3 Schematic of a lithium-ion battery cell. Reprinted with permission
from ref. [10]. Copyright (2013) American Chemical Society. ... 3 Figure 1.4 TGA curve showing determination of 95% degradation temperature... 8 Figure 1.5 Small-scale closed-cup apparatus for flash point and sustained burning
measurements. ... 9 Figure 1.6 Cyclic voltammogram of electrolyte showing electrochemical stability
window. Reprinted from ref. [27] with permission from Elsevier. ... 10 Figure 1.7 Battery capacity retention over extended cycling. Reprinted from ref.
[28]. ... 11 Figure 1.8 Nyquist plot and equivalent circuit used to model data. Reprinted from
ref. [30]. ... 12 Figure 1.9 Chronoamperogram of LiPF6 electrolyte in ethylene carbonate/diethyl
carbonate with an applied voltage of 10 mV. Reprinted from ref. [35]
with permission from Elsevier. ... 14 Figure 1.10 Schematic representation of pfg-NMR pulse sequence. ... 15 Figure 1.11 Schematic representation of pfg-NMR dephasing and signal recovery
a) in the absence of nuclear diffusion and b) with nuclear diffusion.
Reprinted from ref. [37]. ... 16 Figure 1.12 13C pfg-NMR spectra of 13CCl
4. Peak intensity decreases as gradient
field strength increases. Reprinted from ref. [36] with permission
from John Wiley and Sons. ... 16 Figure 1.13 Structure of a) cations and b) anions for a set of representative ionic
liquids. Reprinted with permission from ref. [50]. Copyright (2011)
Figure 1.14 Comparison between polymer electrolyte and polyelectrolyte in which the anion is covalently attached to the polymer. Reprinted
from ref. [60] with permission from Elsevier. ... 21 Figure 1.15 Crystal structure of (PEO)3LiCF3SO3 with CF3SO3- shaded. Dashed
lines show coordination to a lithium ion. From ref. [67]. Reprinted
with permission from AAAS. ... 22 Figure 1.16 Lithium ion hopping facilitated by segmental motions of PEO chains.
Adapted with permission from ref. [73]. Copyright (1988) American
Chemical Society. ... 23 Figure 1.17 Important propagation and termination reactions in the
photooxidation of HFP with oxygen. Reprinted with permission from
ref. [84]. Copyright (1999) American Chemical Society. ... 27 Figure 1.18 Temperature dependence of ionic conductivity and transference
number of PFPE electrolyte with 9.1 wt.% LiTFSI. Reprinted with
permission from ref. [89]. ... 29 Figure 1.19 Solubility limit of LiN(SO2CF3)2 in Fluorolink Diol and
D10-DMC as a function of PFPE molecular weight, expressed as a) rmax
and b) Rmax. Reprinted with permission from ref. [89]. ... 30
Figure 1.20 Photographs of fully cured PFPE/PEG films. Labels are readable for optically transparent or hazy samples only (vertical label: mass ratio PFPE/PEG). Reprinted with permission from ref. [94]. Copyright
(2008) American Chemical Society. ... 31 Figure 1.21 Ionic conductivity of PFPE (black), PFPE/PEG (red), and PEG (blue)
electrolytes at LiN(SO2CF3)2 concentration r=0.026. Reprinted with
permission from ref. [95]. Copyright (2015) American Chemical
Society. ... 32 Figure 2.1 Structure of PFPED10-Diol compared to its ethoxylated PFPEE10-Diol
analog. The slash between perfluoroether repeat units denotes that it
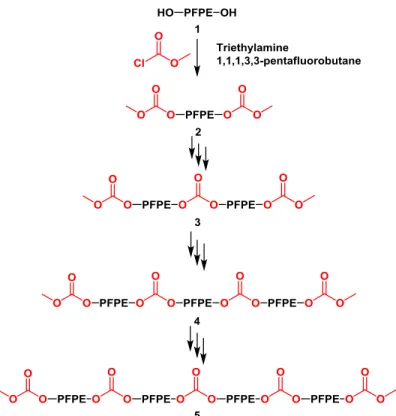
is a random copolymer. ... 47 Figure 2.2. Synthesis of DMC-terminated PFPEE10. ... 48
coupling in the E10 derivatives only. The numbers above each peak
correspond to the numbered structures shown in Figure 2.4. ... 49 Figure 2.4 Proposed structures of coupled products with carbonate linkages.
Elution peaks for each numbered compound are shown in Figure 2.3. ... 50 Figure 2.5 Quantitative 13C NMR of PFPEE10-DMC with corresponding
integrations. Inset: carbonyl (δ=155 ppm) and terminal methoxy
(δ=54 ppm) regions. ... 51 Figure 2.6 Thermogravimetric analysis of dimethyl carbonate and PFPE
polymers. ... 53 Figure 2.7 Effect of LiTFSI salt-loading on A) viscosity at 28°C, B) glass
transition temperature, and C) conductivity at 28°C. ... 55 Figure 2.8 Conductivity of PFPE electrolytes at 9.1 wt% LiTFSI. ... 56 Figure 3.1 Maximum lithium salt solubility normalized to end group
concentration (Rmax = Li+ / end group); blue: hydroxyl, green: methyl
carbonate, red: ethylene oxide. Diol and DMC data were obtained
from ref. [5]. ... 67 Figure 3.2 Dependence of β on salt concentration in a) PEO, carbonate
electrolytes and b) PFPE electrolytes. Reproduced from ref. [8] with
permission from the Royal Society of Chemistry. ... 69 Figure 3.3 Transference number of PFPE and PEO (Mv≈5000 kg mol-1)
electrolytes, measured by potentiostatic polarization (open circles) and pfg-NMR (filled circles). Reprinted with permission from ref.
[15]. Copyright (2016) American Chemical Society. ... 71 Figure 3.4 Structure of the optimized Li(EC)4+ cluster. Reprinted with permission
from ref. [30]. Copyright (2015) American Chemical Society. ... 73 Figure 3.5 Representative 1H NMR of PFPEE10 carbonates (PFPEE10DMC shown
in spectrum above). Ether protons appear across a broad range of the spectrum, caused by the polydispersity of oligoether units along with the chain coupling discussed in Chapter 2. 13C NMR, as shown and discussed in Chapter 2, provides cleaner spectra that prove more
Figure 3.6 SEC chromatogram of PFPEE10 oligomers. Chain coupling is evident
in all carbonate products. ... 77 Figure 3.7 Maximum LiTFSI solubility in PFPEs with varying end group
polarity. ... 78 Figure 3.8 IR spectra of PFPE-carbonates in region of carbonyl stretch. Red:
DMC, Orange: DAC, Green: DPC). Solid lines: neat PFPE materials;
Dashed lines: LiTFSI-saturated PFPE materials. ... 79 Figure 3.9 Dependence of a) glass transition temperature and b) viscosity on
LiTFSI salt content in PFPEE10 electrolytes. Dashed lines show linear
fits of the data. ... 80 Figure 3.10 PFPED10H end groups investigated in this work. Abbreviations are as
follows: trifluoromethyl ester (TFME), di-propargyl carbonate (DPC), allyl carbonate (DAC), methyl carbonate (DMC),
di-ethylene carbonate (DEC). ... 83 Figure 3.11 13C NMR spectrum of PFPE-TFME in deuterated acetone. IR
spectroscopy also confirms successful product formation (C=O
stretch is ~40 cm-1 higher than other carbonates).44 ... 85
Figure 3.12 Representative 1H spectrum of PFPE-carbonates (PFPE-DAC shown with peak assignments). The perfluoroether backbone (which lacks
hydrogens) is abbreviated “PFPE”. ... 86 Figure 3.13 1H NMR spectrum of PFPE-DEC, showing 85% conversion to
desired ethylene carbonate end groups (left) and 15% conversion to
branched methyl carbonate groups (right). ... 89 Figure 3.14 Maximum LiTFSI solubility in PFPED10H materials compared to
PFPE-EO (PFPEE10-Diol). ... 92
Figure 3.15 IR spectra of PFPE-carbonates in region of carbonyl stretch (orange: DPC, yellow: DAC, green: DMC, blue: DEC). Solid lines: neat PFPE
materials; Dashed lines: LiTFSI-saturated PFPE materials. ... 93 Figure 3.16 Dependence of glass transition temperature on LiTFSI salt content in
Figure 3.17 DSC thermograms of PFPE-DEC (solid: neat; dashed: + LiTFSI, R = 0.34). Dark blue lines mark the midpoint Tg of the DEC phase, and
light blue lines mark the midpoint Tg of the PFPE phase. ... 95
Figure 3.18 Schematic representation of conductivity-transference number
trade-off as a function of PFPE end group polarity. ... 98 Figure 4.1 Exploration of the effect of end group concentration on ion solvation
and transport. ... 106 Figure 4.2 Representative 1H NMR spectrum of PFEG#DMCs (PFEG3DMC
shown here) in (CD3)2CO. ... 109
Figure 4.3 1H NMR spectrum of PFPE-Tetra-ol product in (CD
3)2CO. ... 111
Figure 4.4 1H NMR spectrum of PFPE-TE-Diol product in (CD3)2CO. ... 112
Figure 4.5 Differences in molecular weight and end group concentration across
the full range of perfluoroether molecular weights investigated. ... 118 Figure 4.6 Maximum lithium salt solubility in PFPEs of varying molecular
weight expressed as a) weight % LiTFSI and b) Rmax ([Li+]/[end
group]). Data for 1000-4000 g/mol systems obtained from ref. [7]. ... 121 Figure 4.7 Structure of perfluorinated octane-DMC compared to perfluorinated
triethylene glycol. ... 122 Figure 4.8 TGA of perfluorinated glycols compared to dimethyl carbonate
solvent and higher molecular weight PFPED10-Diol... 123
Figure 4.9 Glass transition temperature of DMC-terminated PFPEs as a function
of LiTFSI concentration (R=[Li+]/[end group]). ... 125 Figure 4.10 IR spectra of PFPE-DMC materials (red: PFEG3DMC, blue:
PFEG4DMC, black: D10-DMC; solid = neat, dashed = saturated with
LiTFSI). ... 126 Figure 4.11 Ionic conductivity of PFPE-DMC electrolytes at 30°C as a function
of salt concentration. ... 127 Figure 4.12 Transference number of PFEG4DMC as a function of LiTFSI
Figure 4.13 Requirements for click reactions involving one or more polymeric reagents (blue: originally defined by Sharpless; green and blue– green: adapted requirement related to synthetic polymer chemistry).
Reprinted from ref. [27] with permission from John Wiley and Sons. ... 131 Figure 4.14 Maximum LiTFSI solubility in hydroxyl-terminated PFPED10H
materials. ... 137 Figure 4.15 Ionic conductivity of PFPED10H with various thioether-containing end
groups at ~9.2 wt.% LiTFSI. ... 138 Figure 4.16 Quantitative 13C NMR spectrum of (PFPE-EBC)n. Inset: carbonyl
region of spectrum. ... 140 Figure 4.17 Maximum LiTFSI salt solubility in PFPE solvents of varying
molecular weight, expressed as a) Rmax, the number of lithium ions
per end group and b) weight percent. Data for 1000-4000 g/mol
systems obtained from ref. [7]. ... 141 Figure 5.1 FTIR of C=O stretch region. Spectra shown for (a) 1,2 butylene
carbonate and (b) dimethyl carbonate at various concentrations of Li+. Arrows indicate changes in the spectra with increasing salt
concentration. Reprinted with permission from ref. [20]. Copyright
(2016) American Chemical Society. ... 151 Figure 5.2 Structure of lithium salts with various fluorinated anions... 153 Figure 5.3 Ionic conductivity of SEO electrolytes as a function of polymer
morphology. Reprinted with permission from ref. [37]. Copyright
(2012) American Chemical Society. ... 155 Figure 5.4 Phase diagram of PEO-LiTFSI derived from calorimetric analysis of
DSC data. Reprinted with permission from ref. [40]. Copyright
(1994) American Chemical Society. ... 156 Figure 5.5 TEM images of a polystyrene-poly(poly(ethyleneglycol)methyl ether
methacrylate)-polystyrene triblock copolymer at a) 70% b) 50-70% and c) 30-50% PEO content. Reprinted from ref. [41] with
permission from Elsevier. ... 157 Figure 5.6 WAXS profiles of PFPE and PEO polymers at 30°C. Reproduced
Figure 5.7 SAXS intensity of a polystyrene-block poly(ethylene oxide) lamellar polymer as a function of the magnitude of the scattering vector, q, during heating and cooling. Reprinted with permission from ref. [42].
Copyright (2014) American Chemical Society. ... 158 Figure 5.8 Temperature dependence of the ionic conductivity (blue circles) and
normalized SAXS intensity at q = 0.228 nm–1 (red circles) for PEO– PSLiTFSI(5.0–3.2), r = 0.088. Intensity at each temperature was normalized by the measured value at 25 °C. Reprinted with permission from ref. [43]. Copyright (2014) American Chemical
LIST OF CHEMICAL REACTION SCHEMES
Scheme 1.1 Synthesis of Krytox® via anionic ROP of HFPO. ... 26 Scheme 1.2 Synthesis of Demnum® via anionic ROP of tetrafluorooxetane
followed by fluorination (not shown). ... 26 Scheme 1.3 Direct fluorination of a polyether to its perfluorinated PFPE analog. ... 28 Scheme 3.1 Schematic representation of two-step salt dissolution process, where
S = solvent, A = anion, and C = cation. Adapted with permission
from ref. [3]. Copyright (1978) American Chemical Society. ... 65 Scheme 3.2 Functionalization of PFPE-EO with end groups of varying polarity. ... 74 Scheme 3.3 Synthesis of PFPED10H-Trifluoromethyl ester using trifluoroacetic
anhydride. ... 84 Scheme 3.4 Synthesis of PFPE-DEC from PFPE-Diol. The “PFPE” abbreviation
refers to the PFPED10H core, i.e. –
CH2CF2O(CF2CF2O)9/(CF2O)4CF2CH2-. ... 91
Scheme 4.1 Conversion of PFEG#Diol to PFEG#DMC (n = 1 for PFEG3, n = 2
for PFEG4). ... 119
Scheme 4.2 Reaction between PFPE-enes and thiols. ... 132 Scheme 4.3 Synthesis of PFPE-Tetra-ol (f=4) and PFPE-TE-Diol (f=2) by
photoinitiated thiol-ene reaction. ... 135 Scheme 4.4 Attempted synthesis of PFPE-Tetra-carbonate, resulting in end group
cyclization. ... 136 Scheme 4.5 Polymerization of PFPED10 macromonomer to yield a PFPE
LIST OF ABBREVIATIONS AND SYMBOLS
(CD3)2CO deuterated acetone
1D one-dimensional
2,2-DMPA 2,2-dimethoxy-2-phenylacetophenone
Å angstroms
A constant proportional to the number of charge carriers
a cross-sectional area of electrolyte
AC alternating current
amu atomic mass unit
ASTM American Society for Testing and Materials
ATR attenuated total reflectance
B activation energy for ion transport
c molar salt concentration
C8-X perfluorinated octane; X represents terminal functional group
cm-1 wavenumbers
cP centipoise
D- anion diffusion coefficient
D diffusion coefficient
D+ cation diffusion coefficient
d1 NMR relaxation time
DAC di(allyl carbonate)
DAE di(allyl ether)
DEC diethyl carbonate or as end group, di(ethylene carbonate)
DFT density functional theory
DMAP 4-dimethylaminopyridine
DMC dimethyl carbonate or as end group, di(methyl carbonate)
DMF N,N-dimethylformamide
DMSO dimethyl sulfoxide
DN donor number
DP degree of polymerization
DPC di(propargyl carbonate)
DSC differential scanning calorimetry
EBC ethylene biscarbonate
EC ethylene carbonate
ei ionic charge
EO ethylene oxide
exp exponent
f degree of functionality
F Faraday’s constant
FTIR Fourier transform infrared spectroscopy
g gradient strength
g/mol grams per mole
GPC gel permeation chromatography
Hf enthalpy of fusion
HFP hexafluoropropylene
HFPO hexafluoropropylene oxide
HMIS hazardous material identification system
HOMO highest occupied molecular orbital
I current (for electrochemical measurements)
I observed intensity (for spectroscopy)
IL ionic liquid
IR infrared spectroscopy
J Joules
j square root of -1
K Kelvin
kDa kiloDalton
l length
Li lithium
Li+/Li-ion lithium-ion
LIB lithium-ion battery
LiBETI lithium bis(pentafluoroethanesulfonyl)amide
LiFSI lithium bis(fluorosulfonyl)amide
LiPFESI lithium perfluoroetherbis(sulfonylamide)
LiTFSI lithium bis(trifluoromethane)sulfonamide
Mc critical molar mass for entanglements
MHz megahertz
min minutes
mm millimeter
Mn number-average molecular weight
MTPEG4 tetraethylene glycol mono-thiol
Mv viscosity-average molecular weight
MW molecular weight
N degree of polymerization
N2 nitrogen gas
ni charge carrier concentration
nm nanometer
Pa s Pascal seconds
PEG poly(ethylene glycol)
PEO poly(ethylene oxide)
PFEG#X perfluoroethylene glycol; # represents number of perfluoroethylene oxide repeat
units; X represents terminal functional group
PFPE perfluoropolyether (if used generically, refers to Fluorolink D-based materials)
PFPED10H-X materials synthesized from Fluorolink D10H (1400 g/mol); X represents terminal
functional group
PFPED10-X materials synthesized from Fluorolink D10 (1000 g/mol); X represents terminal
functional group
PFPEE10H-X materials synthesized from Fluorolink E10H (1960 g/mol, EO end groups); X
represents terminal functional group off of EO
PFPEE10-X materials synthesized from Fluorolink E10 (1200 g/mol, EO end groups); X
represents terminal functional group off of EO
PTFE polytetrafluoroethylene
R ideal gas constant
R resistance (for electrochemical calculations)
rf radio frequency
Rmax maximum number of lithium ions per end group
rmax maximum number of lithium ions per polymer repeat unit
ROP ring-opening polymerization
RTIL room-temperature ionic liquid
S/cm Siemens per centimeter
SAXS small-angle x-ray scattering
SEI solid electrolyte interphase
SEO polystyrene-block-poly(ethylene oxide)
SHE standard hydrogen electrode
SPE solid polymer electrolyte
T temperature
t time
t+ transference number
Tc crystallization temperature
Td(5%) 5% degradation temperature
TEA triethylamine
TFE tetrafluoroethylene
TFME trifluoromethyl ester
Tg glass transition temperature
TGA thermogravimetric analysis
THF tetrahydrofuran
Tm melting temperature
UV ultraviolet
V Volt
VFT Vogel-Fulcher-Tammann (equation)
WAXS wide-angle x-ray scattering
wt.% weight percent
Z impedance
β iconicity
γ gyromagnetic ratio
δ chemical shift (in NMR spectra)
δ duration of gradient pulse
Δ interval between gradient pulses
ε dielectric constant
ζ friction coefficient
η viscosity
ηD refractive index
μi ionic mobility
τ separation between gradient pulses
φ phase shift
Chapter 1: Introduction to Lithium-Ion Battery Electrolytes
1.1 Importance of Batteries in the Global Energy Landscape
As the worldwide population grows, nonrenewable energy resources such as fossil fuels are being depleted. Furthermore, combustion of petroleum, fossil fuels, and coal releases carbon dioxide and other greenhouse gases that contribute to global warming.1,2 These three fuel sources account for over 80% of energy consumption in the United States, as shown in Figure 1.1.3
Figure 1.1 U.S. energy consumption by source in 2016. Reprinted from ref. [3].
Figure 1.2 Curent and projected federal government energy consumption. Reprinted from ref. [4].
A major issue with renewable energy sources is their intermittent nature. Solar energy is only available when the sun is shining, and wind energy is only available when the wind is blowing. While fossil fuels can be stored for on-demand electricity production, sunshine and wind cannot be captured. Instead, the electricity generated by these energy sources must be stored for later use. Battery storage is one solution to this problem: excess electricity produced during peak hours can be stored for use at a time when the energy source is less abundant.5
Clearly, the emerging role of rechargeable batteries in our society goes beyond powering portable electronic devices like smartphones and laptops. Aside from grid energy storage, automobiles and aircraft are increasingly shifting toward electrification, reducing our dependence on fossil fuels and cutting greenhouse gas emissions. However, these developments can only be realized with a rechargeable battery that is safe, has high energy densities, and delivers energy quickly on-demand.
1.2 Development of Lithium-Ion Batteries
developed a secondary (rechargeable) battery containing a lithium negative electrode and titanium disulfide positive electrode.7 TiS2 was already known to reversibly intercalate lithium,
theoretically allowing a battery to charge and discharge repeatedly. However, these batteries were not viable due to uneven plating of metallic lithium, resulting in dendrite formation and catastrophic battery failure. A short time later, John Goodenough made his seminal contribution to the battery, proposing lithium metal oxides with the formula LiMxO2 as positive electrode
materials.8 Scientists then demonstrated that carbonaceous secondary insertion materials could be substituted for lithium as the negative electrode material, solving the issue of metallic dendrite formation.9 The first lithium-ion battery (LIB) was commercialized by Sony in 1992. It contained
a graphite anode and LiCoO2 cathode, the materials still found in the vast majority of LIBs today.6
As a culmination of these technological developments, LIBs exhibit long life cycles and high power densities. Therefore, lithium-ion batteries are ubiquitous in today’s society, powering laptops, smartphones, and other handheld portable electronics.10 The lithium-ion battery market is currently valued at about $30 billion and is projected to grow to about $75 billion by 2025.11
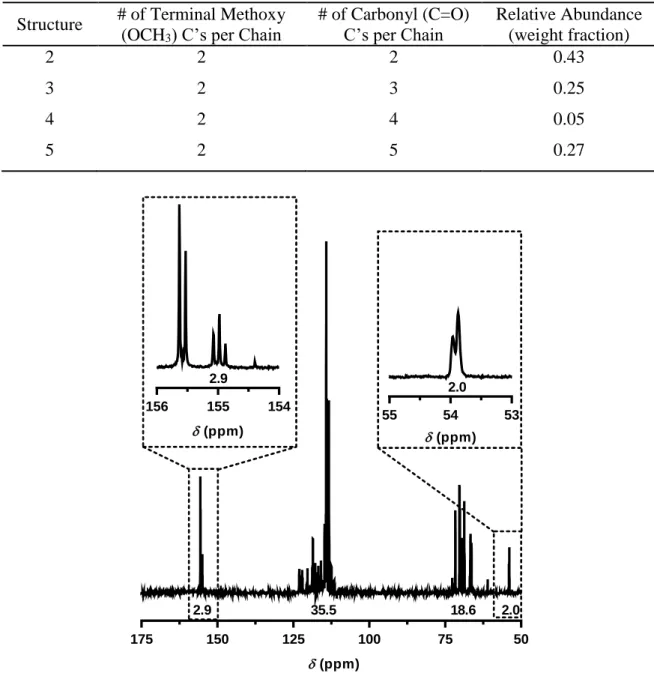
1.3 Principles of Lithium-Ion Battery Operation
Figure 1.3 Schematic of a lithium-ion battery cell. Reprinted with permission from ref. [10]. Copyright
As shown in Figure 1.3, a lithium-ion battery cell consists of an anode and a cathode connected by an external circuit and separated internally by a separator that is swollen with electrolyte. The electrolyte conducts the ionic component of these reactions (Li+), yet it is necessarily electronically insulating in order to avoid self-discharge and internal short circuits: the current is forced through the external circuit where work is performed.
LIB cathodes are typically composed of transition metal oxides like LiCoO2 and LiMn2O4,
while anodes primarily consist of carbon-based compounds such as graphite.12 These layered, secondary insertion materials allow lithium ions to reversibly intercalate into the host electrode structures upon charge and discharge. The half reactions that occur at the graphite anode and the LiCoO2 cathode are provided in Eqn. (1.1) and (1.2).
C6+ 𝑥 e−+ 𝑥 Li+ ↔ Li
𝑥C6 (1. 1)
LiCoO2↔ 𝑥 Li++ 𝑥 e−+ Li
1−𝑥CoO2 (1. 2)
Commercial LIB electrolytes typically consist of a lithium salt like LiPF6 dissolved in a
mixture of small molecule alkyl carbonates such as ethylene carbonate (EC), dimethyl carbonate (DMC), and diethyl carbonate (DEC).13 The separator consists of a thin, porous polyolefin, generally a trilayer polypropylene-polyethylene-polypropylene film for reasons that will be discussed in further detail in Section 1.4.2 .
1.4 Electrolyte Hazards
Unfortunately, the lithium-ion battery is plagued by safety hazards. Carbonate solvents, the main components of LIB electrolytes, are highly flammable and have low flash points.15 Dimethyl carbonate (DMC) has an HMIS flammability rating of 3 on a scale from 0 to 4, designating it as a material capable of ignition under almost all normal temperature conditions. This electrolyte flammability issue has resulted in several well-publicized, catastrophic battery failures causing systems like the Samsung Galaxy Note 7, Tesla, hoverboards, e-cigarettes, and the Boeing Dreamliner to burst into flames.
1.4.1 Failure Rates
It is convenient here to distinguish between a “battery cell” and a “battery” (sometimes referred to as a “battery pack”). A battery cell is the basic electrochemical unit that derives electrical energy from chemical energy, as schematically shown in Figure 1.3. A battery consists of a stack of several cells, the wiring that interconnects them electrically, and the battery housing. A rechargeable battery may also contain a temperature sensor to prevent overcharging of the device.
Because the safety hazards of the LIB itself have not been eliminated to this point, car manufacturers currently use expensive engineering controls to circumvent the issue. For example, both GM and Tesla Motors integrate sophisticated thermal management systems into their batteries, relying on glycol coolant to prevent thermal runaway of the battery.17,18 Ballistic
aluminum and titanium shielding on the underbody of the car is also employed to avoid battery puncture, adding significant mass to the car.19 Addressing battery hazards at the source, rather than engineering around them, would simultaneously reduce the mass and cost of batteries while increasing consumer confidence in electric vehicles and grid storage.20
1.4.2 Failure Mechanism
In batteries, thermal runaway occurs when the heat of the system cannot be dissipated by heat radiation and convection processes. The rise in temperature accelerates exothermic chemical reactions over the desired galvanic ones, eventually leading to uncontrolled heat generation. Although the chemical reactions contributing to thermal runaway may occur in any order, it roughly proceeds as follows, with each reaction releasing heat that fuels the following process:21
1. Moderate initial overheating occurs from excessive currents, overcharging, or elevated external temperatures.
2. The SEI layer decomposes due to either physical penetration or elevated temperatures (above 68°C), forming lithium carbonate and gaseous products.
4. The polymer separator melts, allowing the electrodes to contact each other and short-circuit the battery.
5. The metal oxide cathode breaks down and releases oxygen, enabling flammable alkyl carbonates and hydrocarbons to combust.
6. Cell pressurization leads to venting, causing a stream of flammable gas to emit from the battery.
To improve battery safety, two mechanisms have been built into LIBs. First, the polymer separator consists of a trilayered polypropylene-polyethylene-polypropylene film. The polyethylene film melts at 130°C, and polypropylene melts at 155°C. In the case of rapid heating, the polyethylene film melts first, clogging the pores of the unmelted polypropylene film and shutting down the battery, in theory. Second, a safety vent is implemented to prevent uncontrolled cell rupture under cases of extreme pressurization. Despite these protections, thermal runaway still causes catastrophic failure in LIBs. Even well-constructed battery cells fail, and small errors in manufacturing, testing, and inspection increase the rate of these failures.22,23
1.5 Criteria for Evaluating Novel Battery Electrolytes
Significant research efforts have aimed to identify nonflammable electrolytes in order to enhance the viability of LIBs for large-scale applications.24,25 To assess novel electrolyte performance, several parameters must be evaluated.
1.5.1 Flammability and Temperature Range
polymer or oligomer, would dramatically improve battery safety. Additional consideration should be given to the fact that the electrolyte should be able to operate in a broad temperature range: a battery electrolyte solvent that is crystalline or gaseous provides insufficient ion transport.13
Several techniques may be used to evaluate the operating temperature range of an electrolyte. To determine the lower temperature limit, crystallization and glass transition temperatures can be identified by differential scanning calorimetry (DSC). Rheological measurements can also be made to establish the temperature range over which an electrolyte’s viscosity is sufficiently low to transport ions efficiently.
Thermogravimetric analysis (TGA) is often used to establish an upper temperature limit by means of the material’s volatility or degradation profile, characterized by the Td (5%)—the
temperature at which 5% mass loss is observed. Mass loss may occur as a result of either direct evaporation of the sample (low molecular weight systems) or by degradation of the backbone followed by evaporation of the degraded components (nonvolatile or polymeric systems).
Figure 1.4 TGA curve showing determination of 95% degradation temperature.
A material’s flammability characteristics can be evaluated using a combination of flash point and sustained burning measurements. Closed-cup flash point measurements involve heating
0 1 0 0 2 0 0 3 0 0 4 0 0 5 0 0
0 2 0 4 0 6 0 8 0 1 0 0
T (° C )
w
t
%
a sealed cup of material to periodically increasing temperatures before applying a flame to the sample to test for a flash, as described in ASTM D3278. Sustained burning measurements test whether a material continues to produce sufficient flammable vapor at a given temperature to burn when the ignition source is removed, as described in ASTM D4206. Two materials may exhibit the same flash point but different sustained burning characteristics.
Figure 1.5 Small-scale closed-cup apparatus for flash point and sustained burning measurements.
1.5.2 Electrochemical Stability
Nonflammability is not necessarily indicative of a safe solvent under conditions of abuse in an electrochemical environment.24 Electrolytes must exhibit stability across an electrochemical potential window that is larger than the operating potential window of the anode and the cathode (≈4V)12 to prevent the exothermic reactions described in Section 1.4.2 . If the highest occupied
Cyclic voltammetry can be used to evaluate the anodic and cathodic stability of a given electrolyte. Reduction and oxidation potentials are measured as the potential at which the current density reaches a pre-selected cutoff value—0.2 mA/cm2 for the example shown below.27 The electrochemical window is defined as the difference between these two potentials.
Figure 1.6 Cyclic voltammogram of electrolyte showing electrochemical stability window. Reprinted
from ref. [27] with permission from Elsevier.
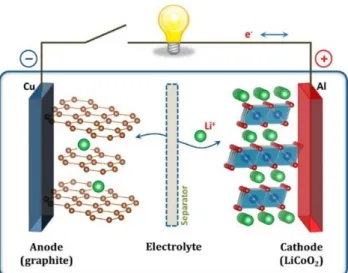
1.5.3 Cyclability
Figure 1.7 Battery capacity retention over extended cycling. Reprinted from ref. [28].
1.5.4 Ionic Conductivity
The ionic conductivity of an electrolyte determines how quickly the energy stored in the LIB can be delivered. The equation for ionic conductivity (σ) is given below:
𝜎 = ∑ 𝑛𝑖𝑒𝑖𝜇𝑖 𝑖
(1. 3)
where ni is the concentration of charge carriers, eiis the ionic charge, and µi is the ionic mobility.
It is generally accepted that ionic conductivities on the order of 10-3 S cm-1 are necessary for most
high-power applications.10 Alkyl carbonate electrolytes exhibit σ ≈ 10-2 S cm-1.
Ionic conductivity is determined experimentally using AC impedance spectroscopy, which involves applying a small, sinusoidal potential to an electrochemical cell and measuring the current response. The resulting AC current is shifted in phase from the excitation potential. Impedance— the ratio of voltage to current—can then be expressed as a complex function that contains real (in-phase) and imaginary (out-of-(in-phase) components:
𝑍(𝜔) =𝐸
𝐼 = 𝑍0exp(𝑗φ) = 𝑍0(cos𝜑 + 𝑗sinφ) (1. 4)
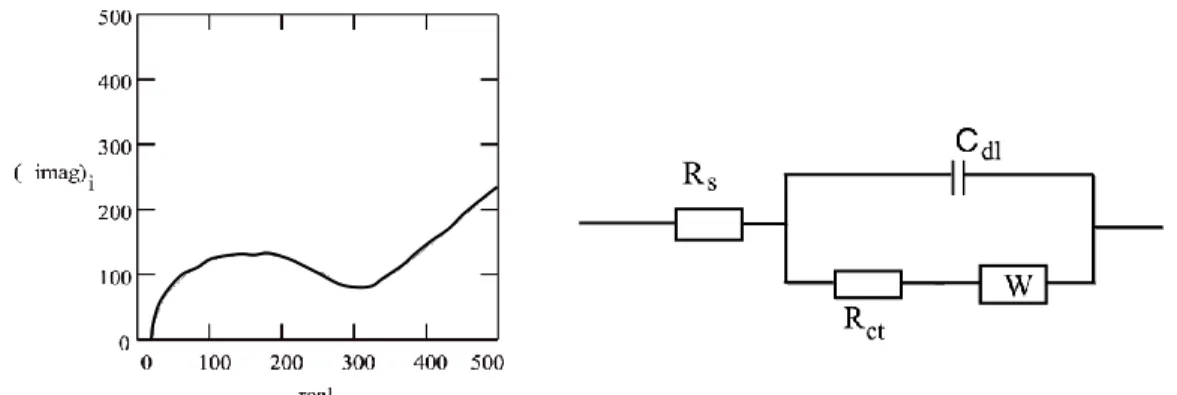
The real component of equation (1.4) corresponds to resistance, while the imaginary component corresponds to reactance (which includes capacitance and inductance). Plotting the imaginary vs. real components of the impedance produces a Nyquist plot, as shown in Figure 1.8.30 The impedance can be modeled by an equivalent circuit to extract the relevant sources of resistance, capacitance, and inductance in the system. The (extrapolated) x-intercept of the Nyquist plot corresponds to the bulk electrolyte resistance from which ionic conductivity may be calculated.
Figure 1.8 Nyquist plot and equivalent circuit used to model data. Reprinted from ref. [30].
1.5.5 Transference Number
For LIBs, only Li+ intercalates into the electrode materials and participates in redox reactions that ultimately result in work being performed. To gain an accurate representation of the “effective” ionic conductivity flowing through an electrolyte, the charge transport of the redox-active Li+ ion must be quantified. For an ideal solution, the cation transference number (t+) is the fraction of the total current carried by the cation:
𝑡+=𝐼+ 𝐼0 =
𝜇+ 𝜇0 =
𝜆+ 𝜆0 =
𝐷+
𝐷++ 𝐷− (1. 5)
where I, μ, λ, and D denote the current, mobility, ionic conductivity, and diffusion coefficients, and the subscripts +, -, and 0 represent the values for the cation, anion, and total electrolyte,
Mobility of higher-order ion aggregates (e.g. triplets) must be considered, and negative transference numbers are possible.32
Electrolytes with t+ << 1, in which the anion is more mobile than Li+, experience strong polarization due to anion (salt) enrichment and depletion near the electrode surfaces, impairing long-term battery performance significantly. In fact, Doyle and coworkers showed that electrolytes with a unity transference number outperform systems with 10x higher ionic conductivity but t+ = 0.2 because cells with t+ near unity have higher energy densities and peak-power densities.33 In most nonaqueous electrolytes—including commercialized alkyl carbonate solvents—t+ is between 0.20 and 0.40.13
Several methods for the measurement of cation transference numbers in LIB electrolytes exist. An insightful review of these methods is provided by Zugmann and Gores in reference 31. The two methods used in this work for characterization of the transference number—potentiostatic polarization and pulsed-field gradient nuclear magnetic resonance (pfg-NMR)—are described here briefly.
1.5.5.1 Potentiostatic Polarization Method for Measurement of t+
reversibly reacts at the electrode surfaces. Conceptually, the transference number is given by the ratio between the steady-state (cation) current and the initial (total) current.
Figure 1.9 Chronoamperogram of LiPF6 electrolyte in ethylene carbonate/diethyl carbonate with an
applied voltage of 10 mV. Reprinted from ref. [35] with permission from Elsevier.
An additional correction must be applied because lithium is reactive with nearly all electrolyte materials, creating a passivation layer that changes the cell resistance over the course of the measurement. Accounting for changes in the electrode surface resistances over time, the transference number is given by:
𝑡+= 𝐼𝑆𝑆(∆𝑉 − 𝐼0𝑅0)
𝐼0(∆𝑉 − 𝐼𝑆𝑆𝑅𝑆𝑆) (1. 6)
where I, ΔV, and R are the current, applied potential, and resistance and the subscripts 0 and SS
denote the initial and steady state conditions, respectively.34 The correction for changing resistance is important, as evidenced by Figure 1.9 above: the simple ratio of steady-state to initial current from the chronoamperogram is nearly 0.7, whereas t+ is known to be < 0.4 for the given electrolyte.35
1.5.5.2 Pulsed-Field Gradient NMR (pfg-NMR) Method for Measuring t+
is given in Figure 1.10. Similar to a standard 1D NMR experiment, the pfg-spin echo experiment begins with a 90° rf pulse (pulse 1), shifting the bulk magnetization vector from the z-axis to the x-y plane, perpendicular to the static field. Pulse 2 is an rf gradient pulse with an intensity that is a linear function of position in the z-direction. The rotation of the magnetization vector is different at each spatial position in the z-direction, canceling the net magnetization. Nuclear diffusion is allowed to occur for a short period, and then a 180° rf pulse (pulse 3) is applied to the sample to invert the magnetization. The gradient pulse (pulse 4) is applied once again to refocus the magnetization.36
Figure 1.11 Schematic representation of pfg-NMR dephasing and signal recovery a) in the absence of
nuclear diffusion and b) with nuclear diffusion. Reprinted from ref. [37].
In the absence of nuclear diffusion, the effects of pulses 2 and 4 exactly cancel each other out and the full signal intensity is recovered, as shown schematically in Figure 1.11a.37 In contrast, translational motion of a nucleus causes it to experience a different magnetic field strength during pulses 2 and 4 due to the spatial dependence of gradient intensity. In the presence of nuclear diffusion, the effects of pulses 2 and 4 on a nucleus do not exactly cancel each other out and the magnetization is not fully refocused. This “blurring” of phases results in a loss of signal intensity (Figure 1.11b and Figure 1.12).
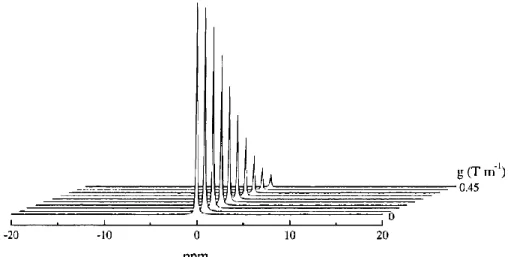
Figure 1.12 13C pfg-NMR spectra of 13CCl
4. Peak intensity decreases as gradient field strength increases.
Reprinted from ref. [36] with permission from John Wiley and Sons.
The amplitude of the attenuated signal E as a function of gradient strength can be fit to obtain the diffusion coefficient of a given species using equation (1.7):
𝐸 = 𝑒−𝛾2𝑔2𝛿2𝐷𝑖𝑁𝑀𝑅(∆− 𝛿3 −𝜏2) (1. 7)
where γ is the gyromagnetic ratio, g is the gradient strength, δ is the duration of the gradient pulse,
DiNMR is the diffusion coefficient, Δ is the interval between gradient pulses, and τ is the separation
between pulses.38 Ultimately, determination of the cation (D+NMR) and anion (D-NMR) diffusion
coefficients enables calculation of the transference number. 𝑡+= 𝐷+𝑁𝑀𝑅
𝐷+𝑁𝑀𝑅+ 𝐷−𝑁𝑀𝑅 (1. 8)
For electrolytes containing fluorinated lithium salts, as is common in LIBs, 7Li NMR is
used to probe the cation diffusivity while 19F NMR can be used to probe the anion diffusivity. Considering pfg-NMR measures the diffusion of nuclei rather than free ions, this method is only valid for ideal, dilute solutions in which no ion association occurs.
1.6 Current Research in LIB Electrolytes
No single electrolyte to date excels in all of the above criteria—safe (nonflammable), electrochemically stable, cyclable, highly conductive, and high transference number. Each electrolyte comes with its own compromises and therefore should be considered appropriate only for certain applications. For example, the principal shortcomings of small-molecule carbonate-based electrolytes are low transference number and poor safety. Yet because of their low cost, high ionic conductivity, and broad electrochemical stability window, these electrolytes have been deemed suitable for most small-scale applications requiring high energy density.
(≈4.5 V).39 Although the small potential window yields low energy densities, several other LIB
electrolyte requirements (nonflammable, σ ≈ 10 mS cm-1, cycle life ≈ 1,000, economical) are met.
Water-in-salt electrolytes could be useful for large-scale, stationary applications in which safety is paramount but energy density requirements are less stringent.
Electrolyte safety remains at the forefront of battery research. Approaches range from incorporating fluorinated40 and phosphate41 flame-retardant additives into alkyl carbonate electrolytes to replacing the electrolyte entirely with nonvolatile polymer electrolytes or room-temperature ionic liquids (RTILs).25,42–44 A brief review regarding additives and replacement electrolytes is included below.
1.6.1 Electrolyte Additives
Zhang et.al. provided a thorough review of electrolyte additives to improve LIB performance via interphase formation, salt stabilization, and flammability reduction.45 Briefly,
researchers have explored flame-retardant additives for alkyl carbonate electrolytes in order to preserve the basic battery chemistries while improving safety. These additives may function in three ways:
i. Char formation, creating an insulating layer between condensed and gas phases to prevent heat transfer and further combustion of the electrolyte.
ii. Radical scavenging, terminating chain reactions contributing to gas-phase combustion.
iii. Inert dilution of flammable components until flash point is eliminated.
systems.46,47 Fluorine-containing additives have also been studied extensively. These compounds function as type iii additives, and flash-point elimination is only observed when the fluorinated compound is the major component.48 Again, the fluorinated additive tends to reduce ionic conductivity of the electrolyte, resulting in a trade-off between flammability and cell performance.49
1.6.2 Room-Temperature Ionic Liquids (RTILs)
Ionic liquids are a liquid mixture of anions and cations (Figure 1.13) in the absence of a molecular solvent—simply, they are molten salts. RTILs, which typically contain quaternary ammonium cations, are a specific class of ionic liquids that have melting temperatures below room temperature.50 Li+-containing ionic liquids often have significantly high melting temperatures because of the small ionic radius of Li+. For this reason, a majority of electrolytes consist of non-lithium-containing RTILs mixed with lithium salts rather than lithium-based ILs.
RTILs are considered nonflammable due to their negligible vapor pressures.43 They exhibit ionic conductivities as high as ≈10-2 S cm-1 at room temperature and transference numbers as high
as ≈0.4.51 However, there are several drawbacks to using RTILs as LIB electrolytes. Due to their
moisture sensitivity and high viscosities (up to 5000 cP),52 the cost of stringent purification and manufacturing is high. Furthermore, the lack of solvent molecules to act as sacrificial building blocks for electrode-electrolyte interphase formation diminishes the kinetic metastability of RTILs.24 In fact, RTILs generate more heat in the presence of active electrode materials than small
Figure 1.13 Structure of a) cations and b) anions for a set of representative ionic liquids. Reprinted with
permission from ref. [50]. Copyright (2011) American Chemical Society.
1.6.3 Polymer Electrolytes
Polymer electrolytes present the intriguing possibility of implementing a thin, flexible membrane to serve as both the conductive medium and the electronic separator between electrode materials in a battery. These materials consist of lithium salts dissolved either in a neat polymer (“solid polymer electrolytes”) or in crosslinked polymer networks swollen with plasticizing solvents (“gel polymer electrolytes”). Fenton and coworkers first reported the ability of PEO to dissolve alkali metal salts in 1973, providing the basis for research in polymer electrolytes.54 Since that time, the field of polymer electrolytes has been largely dominated by studies of PEO and its polyether analogs.
a)
Although PEO exhibits σ > 10-4 S cm-1 above its melting temperature (≈60°C), crystallinity at room temperature hinders segmental motions of polymer chains and impedes ionic conduction.55 Numerous efforts have been made to mitigate the issue of PEO’s crystallinity, including synthesis of copolymers,56 polymer blends,57 comblike structures,58 and polymer brushes.59 Despite these
elegant architectures, ionic conductivities greater than 10-3 S cm-1 at room temperature are rare in PEO-based electrolytes, and electrode-electrolyte compatibility is often sacrificed.
Single-ion conductors (also referred to as “polyelectrolytes” or “ionomers” in the high- or low-ion content case, respectively) consist of lithium salts in which the anions are covalently attached to a polymer backbone, as shown in Figure 1.14.60 This effectively immobilizes the
anions, enabling transference numbers of unity to be achieved. However, these materials suffer from low lithium salt dissociation61 and dramatic increases in Tg with increasing ion content along
the polymer backbone.62 For these reasons, ionic conductivities above 10-4 S cm-1 have not been realized in single-ion conductors.
Figure 1.14 Comparison between polymer electrolyte and polyelectrolyte in which the anion is
covalently attached to the polymer. Reprinted from ref. [60] with permission from Elsevier.
electrolytes is largely determined by the plasticizer molecules. Thus, although ionic conductivities on the order of 10-3 S cm-1 are achievable, gel polymer electrolytes may still be flammable and have similar electrochemical stability windows to that of neat liquid electrolytes.64
1.6.3.1 Ion Solvation
Research in polymer electrolytes has overwhelmingly targeted the lithium ion for solvation. Cation solvation is straightforward and can be accomplished by lone pairs of electrons on heteroatoms. For example, Li+ is solvated via coordination to 3-7 ether oxygens in the PEO backbone, as shown in Figure 1.15.65–67 Preferential coordination of heteroatoms to Li+ hinders its mobility, leading to low t+ values.68
Figure 1.15 Crystal structure of (PEO)3LiCF3SO3 with CF3SO3- shaded. Dashed lines show coordination
to a lithium ion. From ref. [67]. Reprinted with permission from AAAS.
backbone, leading to elevated transference numbers (t+≈0.75) but moderate ionic conductivities (σ≈10-6 S cm-1).70 To our knowledge, boron-containing polymers and additives are the only Lewis-acidic electrolytes that aim to “trap”, or solvate, anions.
1.6.3.2 Ion Transport
Ionic conduction in amorphous materials occurs via two mechanisms: vehicular transport and ion hopping.71 Vehicular transport refers to the co-diffusion of Li+ within its “vehicle”—the molecules in its solvation shell. Considering that gel polymer electrolytes contain plasticizing solvents, vehicular transport dominates ionic conduction in these materials.25 In contrast, the vehicular transport phenomenon is negligible in solid polymer electrolytes of high molecular weight because chain entanglements constrain polymer diffusion.72 Instead, ion hopping dominates Li+ transport, as shown in Figure 1.16.73 Above Tg, segmental motions of polymer
chains cause the coordination environment of Li+ to fluctuate away from its most stable conformation, leading the ion to diffuse down the backbone toward lower free energy sites.74 This repetitive perturbation and diffusion of Li+ is the driving force for long-range ion transport.
Figure 1.16 Lithium ion hopping facilitated by segmental motions of PEO chains. Adapted with
1.6.4 Perfluoropolyether (PFPE) Materials
All perfluoropolyethers (PFPEs) contain C-F, C-C, and C-O bonds that provide this class of materials its unique thermal stability, low volatility, chain flexibility, and extreme chemical resistance.75,76 PFPEs’ chemical stability and large use temperature range make them appealing
long-life lubricants in harsh applications such as aerospace, automotive, and industrial manufacturing industries.77 Crosslinked PFPE networks have also been developed and implemented as surface coatings for marine biofouling applications,78 microfluidics,75 and particle replication molds.79 Coincidentally, PFPE’s unique thermal stability, extreme chemical resistance, amorphous nature, and non-polarizability make it an intriguing solvent for LIB electrolytes as well. 1.6.4.1 Commercially Available Perfluoropolyethers
PFPEs may be categorized into four families based on repeat unit structure, as summarized in Table 1.1 below. The PFPEs studied herein belong to the second two product lines, manufactured by Solvay and Exfluor Research Corporation.
Table 1.1 Molecular structures of commercially available PFPEs.
Product Line Manufacturer Repeat Unit Structure
Krytox® Chemours
(DuPont) Hexafluoropropylene Oxide
Demnum® Daikin Hexafluorooxetane
Fomblin/Fluorolink® Solvay
Tetrafluoroethylene Oxide and Difluoromethylene
Oxide
C#G1 Exfluor Tetrafluoroethylene Oxide
Commercial PFPEs are available in a range of molecular weights with various non-functional and non-functional end groups useful for surface modification. Solvay generally classifies its PFPEs as “Fomblin®” for molecular weights between 2000 and 4000 g/mol and “Fluorolink®” for molecular weights below 2000 g/mol. A representative selection of commercially available PFPE end groups is given in Table 1.2. Although the designations in the table apply to the Fluorolink® product line, the end groups shown are representative of those available in the other product lines. In this work, PFPEs will often be referred to by their trade names, in which the trade name consists of “product line” + “designation” (e.g. Fluorolink® E10 for PFPE with ethoxylated diol end groups).
Table 1.2 Selection of commercially available Fluorolink® end groups.
Designation End Group R
D10 Diol
E10 Ethoxylated Diol
F10 Phosphate
MD700 Methacrylate
1.6.4.2 Perfluoropolyether Synthesis
Perfluoropolyethers were first synthesized in the way that many great scientific discoveries are made—by mistake. In 1953, Haszeldine reported an oily product when attempting to photopolymerize hexafluoropropylene.80 He had unknowingly synthesized PFPE following the photooxidation mechanism depicted in Figure 1.17.
base-catalyzed homopolymerization of hexafluoropropylene oxide (HFPO) using a fluoride source such as cesium fluoride. The terminal acyl fluoride group is reacted by traditional chemistries to yield functional end groups, or alternatively removed by fluorination to yield inert polyether products ranging anywhere from n = 2 to n = 50.81 Control over the polymerization is exerted by
solvent and temperature conditions.
Scheme 1.1 Synthesis of Krytox® via anionic ROP of HFPO.
Demnum® is synthesized via an analogous ring-opening polymerization of tetrafluorooxetane.82 Because the tetrafluorooxetane monomer is only partially fluorinated, the final poly(perfluorotrimethylene oxide) material is obtained only after a subsequent fluorination step and final end group conversion.83 The subsequent fluorination is carried out by reacting fluorine gas directly with the polymer at 200°C or in the presence of UV irradiation.
Scheme 1.2 Synthesis of Demnum® via anionic ROP of tetrafluorooxetane followed by fluorination (not
shown).
Solvay manufactures its Fomblin/Fluorlink® PFPEs by the photooxidation of fluorinated olefins like tetrafluoroethylene (TFE) or hexafluoropropylene (HFP). Oxygen is added into the liquid monomers at -40°C and irradiated with UV light (λ<300 nm).83 The mechanism for this
polymerization is well-established and was summarized clearly by Bunyard et al.84 Several of the
undergoes analagous reactions. The Fluorolink® materials discussed in this dissertation are synthesized by the photooxidation of TFE.
Figure 1.17 Important propagation and termination reactions in the photooxidation of HFP with oxygen.
Reprinted with permission from ref. [84]. Copyright (1999) American Chemical Society.
Finally, direct fluorination may be employed to convert hydrogenated ethers to their perfluorinated derivatives. Three commercially viable methods exist to date: electrochemical fluorination, oxidative fluorination with cobalt trifluoride, and liquid phase fluorination.85 Each method relies on the same basic mechanism, in which proton abstraction from a carbon yields an alkyl radical, which then reacts with a fluoride source to produce the perfluorinated molecule. However, several direct fluorination methods require the starting material to be soluble in the same medium as the perfluorinated product, which is rare unless the starting material is already partially fluorinated.86
Exfluor solved this issue with a method to generate a large excess of fluorine radicals relative to the nonfluorinated substrate under vigorous stirring. The Exfluor-Lagow method involves slow addition of the nonfluorinated substrate and excess fluorine to a halogenated solvent (the DeSimone group has also performed fluorinations in liquid and supercritical CO2).87 Benzene
is added in small quantities, reacting spontaneously with fluorine to generate high concentrations of fluorine radicals. Though it makes use of toxic, explosive fluorine gas, the Exfluor-Lagow method produces perfluorinated ethers in higher yields and better purities than electrochemical or cobalt trifluoride-based direct fluorinations.88 The low molecular weight perfluorinated glycols discussed in this work are synthesized by Exfluor’s direct fluorination method.
Scheme 1.3 Direct fluorination of a polyether to its perfluorinated PFPE analog.
1.6.4.3 Perfluoropolyether Electrolyte Properties
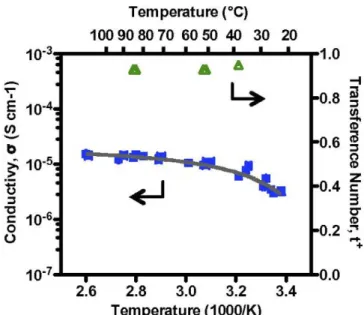
electrolytes exhibit ionic conductivity σ ≈ 10-6 S cm-1 at room temperature with near-unity transference numbers (t+ ≥ 0.91), the highest known t+ values reported for a polymer electrolyte in which lithium salt is dissolved in a polymer solvent (Figure 1.18). It was proposed that the perfluorinated polymer backbone solvates the highly fluorinated TFSI- anion, freeing Li+ for higher mobility.
If correct, this feature would be unique from the vast majority of polymer electrolytes that coordinate to Li+. Anion solvation may occur via the “fluorous effect,” the tendency of perfluoroalkyl chains to segregate in order to minimize energetically unfavorable interactions of the highly nonpolarizable fluorine atoms with other elements.90 This fluorous effect has been used as an alternative to covalent immobilization in applications such as microarrays,91 mass spectrometry,92 and fluorous solid-phase extraction.93
Figure 1.18 Temperature dependence of ionic conductivity and transference number of PFPE electrolyte
with 9.1 wt.% LiTFSI. Reprinted with permission from ref. [89].
Wong and coworkers studied LiN(SO2CF3)2 solubility in PFPEs of varying molecular
𝑟𝑚𝑎𝑥= [𝐿𝑖+]
[𝐶𝐹2𝐶𝐹2𝑂] + [𝐶𝐹2𝑂] (1. 9)
PEO electrolyte salt concentrations are often expressed as rmax (defined as [Li+]/[ether]) because
the ether oxygen atom is known to be responsible for solvating lithium. Therefore, rmax is constant
for PEO of varying molecular weight. In contrast, rmax decreases exponentially with increasing
PFPE molecular weight (Figure 1.19a).
Because PFPE-DMC dissolves significantly more salt than PFPE-Diol, it was proposed that end groups play an important role in dissolving lithium salts. The LiTFSI solubility was normalized as the ratio of lithium ions per end group (Rmax), where the end group is either hydroxyl
or methyl carbonate (Figure 1.19b). Rmax was consistent over a range of molecular weights,
indicating that end groups do contribute to lithium salt solvation in PFPE electrolytes.
𝑅𝑚𝑎𝑥= [𝐿𝑖 +] [−𝑂𝐻] or
[𝐿𝑖+]
[−𝑂𝐶𝑂2𝑀𝑒] (1. 10)
Figure 1.19 Solubility limit of LiN(SO2CF3)2 in Fluorolink D10-Diol and D10-DMC as a function of
PFPE molecular weight, expressed as a) rmax and b) Rmax. Reprinted with permission from ref. [89].
0 1 0 0 0 2 0 0 0 3 0 0 0 4 0 0 0 5 0 0 0
0 . 0 0 0 . 0 2 0 . 0 4 0 . 0 6 0 . 0 8 0 . 1 0
M W (g /m o l) rm
a
x
P F P E -D io l
P F P E - D M C
0 1 0 0 0 2 0 0 0 3 0 0 0 4 0 0 0 5 0 0 0
0 . 0 0 . 2 0 . 4 0 . 6
M W (g /m o l)
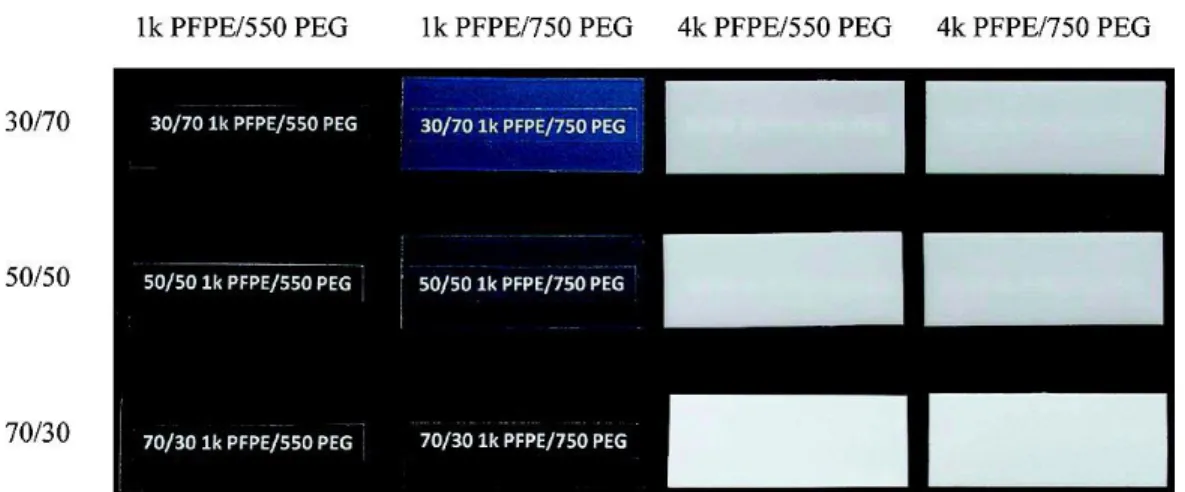
PFPE was found to form miscible blends with low molecular weight PEO up to a composition of about 30 wt.% PEO, as shown in Figure 1.20.94 Wong et al. prepared electrolytes based on physical blends of PFPE and PEO mixed with LiTFSI salt, and the complex ternary phase interactions altered the miscibility between PFPE and PEO.95 As shown in Figure 1.21, the ionic
conductivity exhibited by PFPE/PEO blends reached ≈ 10-4 S cm-1 at room temperature, although
the transference number was significantly reduced to ≈ 0.3.95 PEO dramatically affected the
conductive behavior of the electrolyte: oligoether coordination to Li+ resulted in higher lithium salt solubility and conductivity but lower t+.
Figure 1.20 Photographs of fully cured PFPE/PEG films. Labels are readable for optically transparent or
hazy samples only (vertical label: mass ratio PFPE/PEG). Reprinted with permission from ref. [94].
Figure 1.21 Ionic conductivity of PFPE (black), PFPE/PEG (red), and PEG (blue) electrolytes at
LiN(SO2CF3)2 concentration r=0.026. Reprinted with permission from ref. [95]. Copyright (2015)
![Figure 1.7 Battery capacity retention over extended cycling. Reprinted from ref. [28]](https://thumb-us.123doks.com/thumbv2/123dok_us/8314106.2202443/40.918.250.664.118.341/figure-battery-capacity-retention-extended-cycling-reprinted-ref.webp)