Structure of the crust and African slab beneath the central
Anatolian plateau from receiver functions: New insights on
isostatic compensation and slab dynamics
Bizhan Abgarmi
1, Jonathan R. Delph
2,3, A. Arda Ozacar
1, Susan L. Beck
3, George Zandt
3, Eric Sandvol
4, Niyazi Turkelli
5, and C. Berk Biryol
61Department of Geological Engineering, Middle East Technical University, Dumlupınar Boulevard No. 1, 06800 Çankaya, Ankara, Turkey 2Department of Earth Science, Rice University, MS-126, 6100 Main Street, Houston, Texas 77005, USA
3Department of Geosciences, University of Arizona, 1040 4th Street, Tucson, Arizona 85721, USA
4Department of Geological Sciences, University of Missouri, 101 Geological Sciences Building, Columbia, Missouri 65211, USA
5Department of Geophysics, Boğaziçi University Kandilli Observatory and Earthquake Research Institute, 34684, Çengelköy, Istanbul, Turkey 6Department of Geological Sciences, University of North Carolina at Chapel Hill, 104 South Road, Mitchell Hall, Chapel Hill, North Carolina 27599, USA
ABSTRACT
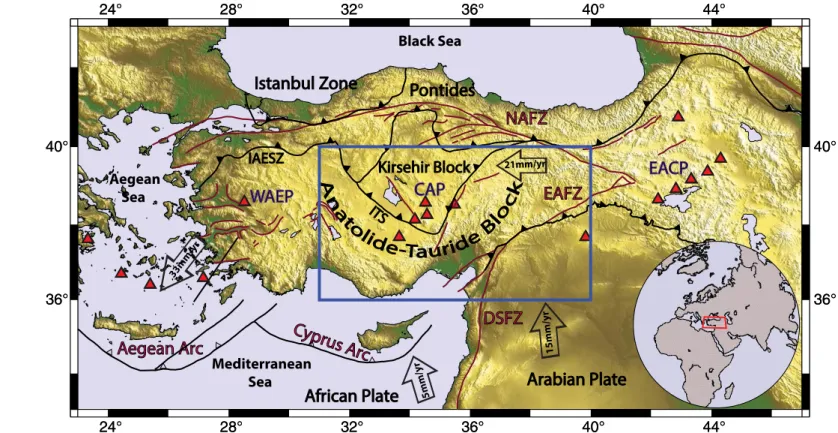
The central Anatolian plateau in Turkey is a region with a long history of subduction, continental collision, accretion of continental fragments, and slab tearing and/or breakoff and tectonic escape. Central Anatolia is currently characterized as a nascent plateau with widespread Neogene volcanism and predominantly transtensional deformation. To elucidate the present-day crustal and upper mantle structure of this region, teleseismic receiver functions were calculated from 500 seismic events recorded on 92 temporary and permanent broadband seismic stations. Overall, we see a good correlation between crustal thickness and elevation throughout cen-tral Anatolia, indicating that the crust may be well compensated through-out the region. We observe the thickest crust beneath the Taurus Mountains (>40 km); it thins rapidly to the south in the Adana Basin and Arabian plate and to the northwest across the Inner Tauride suture beneath the Tuz Gölü
Basin and Kırşehir block. Within the Central Anatolian Volcanic Province, we
observe several low seismic velocity layers ranging from 15 to 25 km depth that spatially correlate with the Neogene volcanism in the region, and may represent crustal magma reservoirs. Beneath the central Taurus Mountains, we observe a positive amplitude, subhorizontal receiver function arrival be-low the Anatolian continental Moho at ~50–80 km that we interpret as the gently dipping Moho of the subducting African lithosphere abruptly ending near the northernmost extent of the central Taurus Mountains. We suggest that the uplift of the central Taurus Mountains (~2 km since 8 Ma), which are capped by flat-lying carbonates of late Miocene marine units, can be explained by an isostatic uplift during the late Miocene–Pliocene followed by slab breakoff and subsequent rebound coeval with the onset of faster uplift rates during the late Pliocene–early Pleistocene. The Moho signature of the subducting African lithosphere terminates near the southernmost extent of the Central Anatolian Volcanic Province, where geochemical signatures in the Quaternary volcanics indicate that asthenospheric material is rising to shallow mantle depths.
INTRODUCTION
Central Anatolia displays a typical plateau-like morphology that appears similar to other collision-related plateaus but on a smaller scale. Elevation in-creases in the interior of the central Anatolian plateau to the north and the Taurus Mountains to the south (Fig. 1). The crustal architecture of the cen-tral Anatolian plateau comprises the amalgamation of continental fragments that coalesced during the closure of the Neo-Tethyan Ocean system between Africa- Arabia and Eurasia and records both subduction and collisional-related processes (Şengör and Yılmaz, 1981). To the east of the central Anatolian pla-teau, compression related to the Arabia-Eurasia continental collision domi-nates the formation and development of tectonic structures, while regional extension due to the rollback of the African slab has dominated the west since the Miocene (Bozkurt, 2001; Ring et al., 2010). These processes have led to the development of the Anatolian plate, which has been extruding westward since the Miocene as a result of African slab rollback and Arabia-Eurasia collision (Şengör et al., 1985; Reilinger et al., 2006).
Thanks to the expansion of seismic station coverage in Turkey, a number of regional-scale studies of the eastern Mediterranean have provided researchers with a broad understanding of the seismic structure of the Anatolian system (e.g., Biryol et al., 2011; Mutlu and Karabulut, 2011; Salaün et al., 2012; Ficht-ner et al., 2013; Vanacore et al., 2013; Delph et al., 2015; Govers and FichtFicht-ner, 2016). Smaller scale regional studies have also been performed using tempo-rary seismic deployments to investigate the seismic structure of this system in higher detail, such as the North Anatolian Fault Experiment (Beck and Zandt, 2005) and the Eastern Turkey Seismic Experiment (Sandvol et al., 2003). This has resulted in dense seismic station coverage throughout most of Turkey, when combined with the extensive backbone network of the Kandilli Obser-vatory and Earthquake Research Institute (KOERI). However, until recently seismic station coverage and associated studies investigating central Anatolia have been largely neglected due to its relative stability and assumed low po-tential of large-magnitude earthquakes.
GEOSPHERE
GEOSPHERE; v. 13, no. 6
doi:10.1130/GES01509.1
8 figures; 1 supplemental file
CORRESPONDENCE: bizhan .abgarmi@metu .edu.tr
CITATION: Abgarmi, B., Delph, J.R., Ozacar, A.A., Beck, S.L., Zandt, G., Sandvol, E., Turkelli, N., and Biryol, C.B., 2017, Structure of the crust and African slab beneath the central Anatolian plateau from re-ceiver functions: New insights on isostatic compen-sation and slab dynamics: Geosphere, v. 13, no. 6, p. 1774–1787, doi:10.1130/GES01509.1.
Received 4 February 2017 Revision received 16 August 2017 Accepted 27 September 2017 Published online 27 October 2017
This study represents the first analysis of a large data set collected as part of the Continental Dynamics–Central Anatolian Tectonics (CD-CAT) project that combines interdisciplinary expertise to investigate the structure and evolution of central Anatolia. As part of this project, 65 Streckeisen STS2 and Guralp CMG-3T broadband seismic stations were deployed in 72 locations through-out central Anatolia and operated for 2 yr between May 2013 and May 2015. The goals of the CD-CAT seismic deployment are multifaceted, but generally focus on better understanding the interplay between the complex Cenozoic evolution of the central Anatolian plateau and how it is reflected in the modern seismic structure of the region. In this study, we use P-wave receiver function images to investigate the crustal and uppermost mantle discontinuity structure beneath central Anatolia, and find links between crustal and upper mantle vari-ations and Miocene–recent uplift and volcanism.
AMALGAMATION OF ANATOLIA
Anatolia has a long tectonic history of subduction and accretion of con-tinental fragments that ends with the present-day westward extrusion and escape of the Anatolian plate. We briefly summarize the tectonics of central Anatolia by first describing the subduction and collision history followed by a brief description of the present-day structures that dominate deformation in Anatolia during its more recent history.
The crustal architecture of Anatolia is the result of the collision and ac-cretion of continental fragments as crustal-scale nappes during the closure of the Neo-Tethys Ocean in the Cretaceous. These accreted crustal fragments are separated by sutures zones marked by ophiolite complexes and mélanges (Fig. 1). In the north, the Izmir-Ankara-Erzincan suture zone (IAESZ) demarcates
24°
24°
28°
28°
32°
32°
36°
36°
40°
40°
44°
44°
36°
36°
40°
40°
24°
24°
28°
28°
32°
32°
36°
36°
40°
40°
44°
44°
36°
36°
40°
40°
15
m
m/
yr
21mm/yr
5mm/y
r
33mm/yr
Black Sea
Mediterranean
Sea
Aegean
Sea
Pontides
Istanbul Zone
IAESZ
ITS
Cyprus A
rc
DSFZ
EAFZ
NAFZ
Aegean Arc
Kirsehir Block
WAEP
EACP
CAP
Arabian Plate
African Plate
the closure of the northern branch of the Neo-Tethys Ocean that separated the Pontides in the north from the Anatolide-Tauride and Kırşehir blocks to the south (Şengör and Yılmaz, 1981), while the Inner Tauride suture (ITS) separates the Kırşehir block from the Anatolide-Tauride block in central Anatolia. In gen-eral, the Anatolide-Tauride block represents a Gondwanan-derived continental fragment comprising deformed and variably metamorphosed subduction-re-lated rocks with higher degrees of metamorphism in the north and west along the IAESZ and ITS. Away from the suture zones, deformation is characterized by fold and thrust belt formation and a lower degree of metamorphism, which occurred during the collision and accretion of this block during the Cretaceous to Eocene (Okay and Tüysüz, 1999). The Kırşehir block, composed of mainly Cretaceous high-temperature metamorphic rocks and igneous intrusions (Göncüoğlu et al., 1991), is separated from the Anatolide-Tauride block along the more controversial ITS (Fig. 1). This suture zone is thought to represent the closure of a smaller ocean basin formed from rifting of the Gondwanan continental margin (Okay and Tüysüz, 1999; Whitney and Davis, 2006; Gürer et al., 2016); however, more recent work pointed out the lack of geologic evi-dence for Late Cretaceous subduction initiation along the ITS (van Hinsbergen et al., 2016; Gürer et al., 2016). The triangular-shaped Kırşehir block (Fig. 1), which is also known as the Central Anatolian Crystalline Complex, is com-posed of mainly Cretaceous high-temperature metamorphic rocks and igne-ous intrusions (Whitney et al., 2003; Whitney and Hamilton, 2004). The Ana-tolide-Tauride block is composed of nonmetamorphosed platform carbonates forming Tauride Mountains in the south and metamorphosed passive margin sequences in the north (Okay, 1984). In the Tauride Mountains at the south-ern margin of Anatolia, the older deformed rocks of the Anatolide-Tauride block are overlain by late Miocene platform carbonates. Farther to the east, the Bitlis-Zagros suture zone represents the closure of the southern branch of the Neo-Tethyan Ocean (Şengör and Yilmaz, 1981) that separated the Eur-asian margin from the incoming Arabian plate in the Oligocene. The structures imposed by the collision and accretion of these continental fragments play a significant role in controlling the more recent deformation of Anatolia by act-ing as zones of weakness that have in part been reactivated in response to a major change in the deformational character of the Anatolian region initiating in the Miocene.
TECTONIC STRUCTURES OF THE ANATOLIAN PLATE
The processes occurring along the southern margin of the Anatolian plate mainly control the stress state of the plate. Despite the similar tectonic evo-lution of the Anatolian region prior to the Miocene, large lateral variations in crustal thickness, gravity, volcanism, and geophysical properties in the Ana-tolian plate are observed (Vanacore et al., 2013; Ates et al., 1999; Mutlu and Karabulut, 2011; Govers and Fichtner, 2016). In the east, the collision of Ara-bia and Eurasia initiating in the Oligocene led to largely compression-related defor ma tional structures and seismicity (Şengör et al., 2008), while in the west,
the southward migration of the Aegean trench presumably caused by slab roll-back has led to regional-scale large-magnitude extension and the exhumation of metamorphic core complexes since the early Miocene (Ring et al., 2010). Thus, the Miocene to recent evolution of Anatolia, and the structures along which deformation is localized, may exert an important control on the present- day seismic structure of the region.
The Anatolian plate is currently defined by two conjugate strike-slip fault zones: the roughly west-east–striking North Anatolian fault zone (NAFZ) that separates the Anatolian and Eurasian plates, which formed in the mid-Mio-cene in eastern Anatolia (Şengör et al., 2005), and the late Miocene–Pliocene northeast-southwest–striking East Anatolian fault zone (EAFZ) that separates the Anatolian and Arabian or Eurasian plates (e.g., Şengör et al., 1985) (Fig. 1). These major neotectonic structures appear to exploit the lithospheric weak-nesses created during the amalgamation of Anatolia, with the NAFZ roughly following the trace of the IAESZ (Şengör et al., 2005) and the EAFZ following the western portion of the Bitlis-Zagros suture. Farther to the south, the Dead Sea fault zone accommodates the differential motions of the Arabian plate (~15 mm/yr northward motion) and African plate (~5 mm/yr northward motion) with respect to Eurasia (Reilinger et al., 2006).
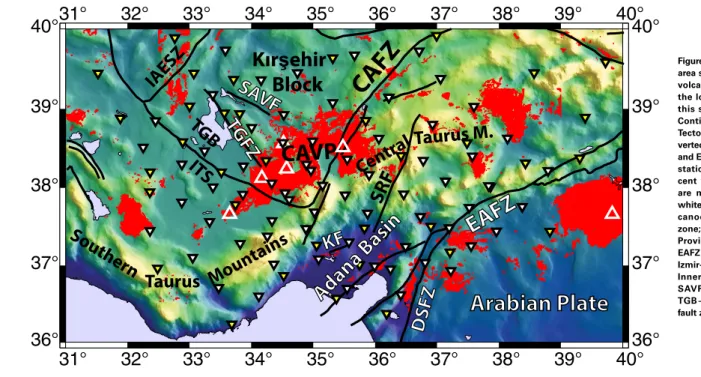
Central Anatolia represents the transition between the compressional defor mation in the east and the highly extensional deformation of the Aegean in the west. Central Anatolia includes the Taurus Mountains, a high (>1.5 km) elevation mountain range that comprises most of the southern part of the Ana-tolide-Tauride block in this region, and the Kırşehir block (Fig. 2) (Şengör et al., 1985). Taken together this region has more recently been termed the central Anatolian plateau.
The Central Anatolian fault zone (CAFZ), which in part appears to exploit the lithospheric-scale weakness of the Inner Tauride suture, separates the carbonate nappes of the Anatolide-Tauride block from the highly deformed and metamorphosed rocks in the Kırşehir block (Fig. 2). The CAFZ is mainly a transtensional fault structure with low-magnitude left-lateral offsets during the Miocene (Koçyığıt and Beyhan, 1998); however, robust changes in Pn veloci-ties and Bouguer gravity across the CAFZ between the Kırşehir and Anatolide- Tauride blocks show distinctly different crust and upper mantle structures on either side of the CAFZ (Ates et al., 1999; Gans et al., 2009; Mutlu and Karabulut, 2011). While as much as 75 km total lateral displacement can be observed on some portions of the CAFZ, a recent geomorphological study shows a transi-tion to west-east extension along the CAFZ near Mount Erciyes since late Plio-cene time (Higgins et al., 2015) leading to the development of a pull-apart basin that has been exploited by Miocene–recent volcanism of the Central Anatolian Volcanic Province (CAVP) (Toprak and Göncüoğlu, 1993; Toprak, 1998).
southwestern part of the CAVP suggesting a transition from calc-alkaline to Na- alkaline composition at the latest phase of volcanism in agreement with recent contribution of asthenospheric mantle, as further verified by geochemi-cal signatures in young (younger than 2 Ma) primitive basalts intruded into the Anatolide-Tauride block (Reid et al., 2017).
The Tuz Gölü fault zone (TGFZ), which is one of the major active transten-sional structures in the region, is a right-lateral strike-slip fault zone with large normal component (Özsayın et al., 2013). This northwest-southeast–trending fault zone juxtaposes the crystalline rocks of the Kırşehir block and the thick sedimentary deposits of the Tuz Gölü Basin (Çemen et al., 1999), which ob-scures the surface trace of the ITS in the southwest (Fig. 2). The Savcılı fault, which is oriented in a west-northwest–east-southeast direction, developed during the Paleogene as a left-lateral transpressional structure accommodat-ing vertical axis rotations; this has led to ~20 km lateral offset between the Mesozoic intrusive bodies of the Kırşehir block (Lefebvre et al., 2013).
The EAFZ can be characterized as a broad (~20 km) left-lateral fault zone with a slip rate of ~6–10 mm/yr that bounds the westward-escaping Anatolian plate in the southeast (Bulut et al., 2012; Reilinger et al., 2006; Bozkurt, 2001) (Fig. 1). The EAFZ initiated in the late Miocene–Pliocene and links to the North Anatolian fault at the Karlıova Triple Junction (Bozkurt, 2001). To the south, the EAFZ roughly follows the Bitlis-Zagros suture between the Eurasian and Arabian plates and connects with the Dead Sea fault, forming a triple
junc-tion between the Anatolian, Arabian, and African plates (Fig. 2). Farther south, the EAFZ branches into different faults toward the Adana Basin (Muehlberger and Gordon, 1987). The Sarız fault, which is located between the CAFZ and EAFZ, is characterized by ongoing left-lateral strike-slip motion accommo-dating internal deformation across the central Taurus Mountains (Kaymakçı et al., 2010).
The Adana Basin is a large extensional Neogene basin along the southern margin of the Taurus Mountains (Fig. 1). The transtensional Kozan fault, which bounds the basin on the north, is characterized by ~5 mm/yr left-lateral slip esti mated from delta lobes (Aksu et al., 2014) and is considered the northern-most branch of the EAFZ that may have contributed some of the differential uplift between the central Taurus Mountains and the Adana Basin (Aksu et al., 2005, 2014; Radeff et al., 2015).
Although much of the Anatolide-Tauride block underwent folding and fault-ing and associated accretion, recent results from the European Science Foun-dation Topo-Europe (http:// archives .esf .org /coordinating -research /eurocores /programmes /topo -europe .html) indicate that along the southern margin of Anatolia, the central Taurus Mountains have undergone two episodes of uplift since the late Miocene, leading to ~2 km of cumulative uplift based on bio strati-graphic data from undeformed carbonate sequences (Cosentino et al., 2012; Schildgen et al., 2014; Radeff et al., 2015). This rapid uplift without evidence for Miocene shortening in the region has been interpreted as a result of mantle
31°
31°
32°
32°
33°
33°
34°
34°
35°
35°
36°
36°
37°
37°
38°
38°
39°
39°
40°
40°
36°
36°
37°
37°
38°
38°
39°
39°
40°
40°
CAFZ
DSFZ
TGB
ITS
IAESZ
Arabian Plate
EAFZ
KF
TG
SAVF
FZ
SR
F
CAVP
Ad
an
a B
as
in
Kır
ş
ehir
Block
Sout
hern
Taurus Mountains
Cen
tral
Taurus M.
processes, including lithospheric delamination (Cosentino et al., 2012; Bartol and Govers, 2014; Radeff et al., 2015) and/or processes associated with the breakup of the downgoing African lithosphere (Schildgen et al., 2012a, 2012b, 2014). Based on teleseismic tomography, Biryol et al. (2011) suggested that the subducting Arabian oceanic lithosphere that was attached to the northern edge of the Arabian plate has completely broken off, while the African-Tethyan lithosphere to the west is in the process of tearing and breaking apart as the African plate moves northward and collides with the Anatolian margin.
DATA AND METHODS
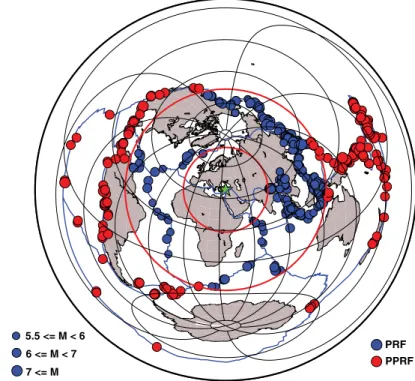
A total of 310 teleseismic events (distances between 30° and 95°) with magnitudes >5.5, recorded between May 2013 and May 2015, are used in our P-wave receiver function analysis (Fig. 3). We used data from 72 broadband seismic stations that were part of the CD-CAT experiment and 26 KOERI sta-tions in our analysis (see Supplemental Item1). The teleseismic earthquake
distribution is dominated by events with back azimuths between 30° and 95° corresponding to the Japan, Mariana, Ryukyu, Philippine, and Kuril Trenches (Fig. 3). In order to increase our back-azimuthal coverage to ensure that results are not spatially biased, we incorporate PP receiver functions (e.g., Frassetto et al., 2011) from 190 events >6 M with epicentral distances of 95°–180° from our network. Because South America is in this distance range, it allows us to densely sample the southwestern back azimuth of our study area. In order to avoid any interference from the arrival of PKS phases on the radial component, events with distances between 137° and 152° (distances where the PKS phase will arrive within 50 s of PP) are omitted.
Receiver functions are very sensitive to impedance contrasts beneath a sta-tion, allowing us to gain insight into the magnitude of velocity changes across discontinuities. Large impedance contrasts over a short depth interval will be expressed as a high-amplitude Gaussian pulse over a short time interval; con-versely, low-amplitude pulses over long time intervals correspond to velocity gradients. For both P and PP events, we perform a time-domain iterative de-convolution (Ligorria and Ammon, 1999) on vertical and radial component data filtered between 0.07 and 3 Hz to compute P-s receiver functions with a 2.5 Gaussian pulse width corresponding to 1.2 Hz center frequency (~1 km vertical resolution with considering average crustal shear velocities). For quality con-trol, we first inspect each event-station pair, and those without a clear P or PP arrival are discarded. Then, calculated receiver functions with a low variance reduction (<0.7) are discarded along with anomalous receiver functions. For the final quality control step, we use the Funclab software (Eagar and Fouch, 2012) to visually inspect the calculated receiver functions.
Calculation for Crustal Thickness and
Vp
/
Vs
:
Stack Windowing Analysis
The migration of receiver function to depth requires information on the
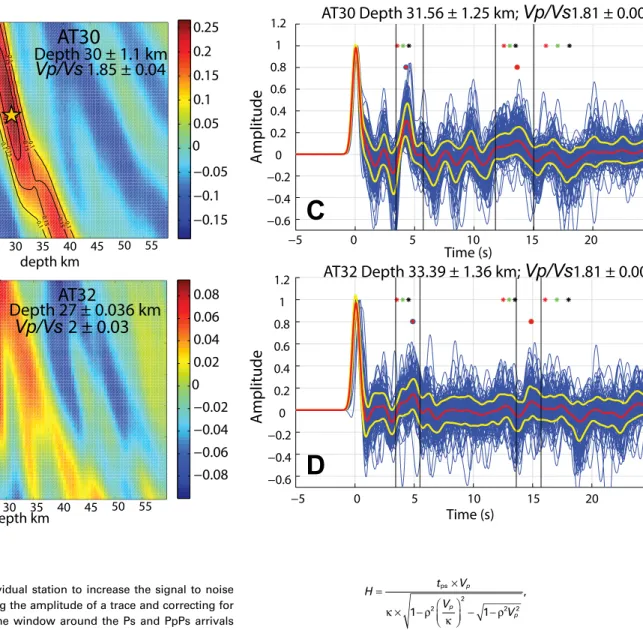
Vp/Vs (compressional wave/shear-wave velocities) ratio of the crust and upper most mantle. By identifying multiples from the Moho Ps conversion in receiver functions, the Vp/Vs ratio of the crust beneath a station can be deter-mined. H-κ stacking (Zhu and Kanamori, 2000) is a simple and automated way to measure crustal thickness (H) and Vp/Vs ratios (κ) through the summation of the primary (Ps) conversion from the Moho and its associated multiples (PpPs and PsPs + PpSs), assuming flat-lying homogeneous layers. However, the effectiveness of H-κ stacking diminishes in tectonically complex regions, when the assumption of flat homogeneous layering breaks down, leading to difficulty in identifying the correct crustal thickness and Vp/Vs (Fig. 4). Thus, we prefer a more manual method for identifying the multiples from the Moho discontinuity in tectonically complex areas, which we call stack windowing analysis (SWA).
SWA builds on previous approaches in estimating κ through the manual picking of the Ps conversion and the PpPs multiple (Zandt and Ammon, 1995). Because single earthquake traces can be contaminated with noise, we stack
5.5 <= M < 6 6 <= M < 7 7 <= M
PRF PPRF
Figure 3. Global distribution of events used in our receiver function analysis. Blue circles rep-resent events used for P-wave receiver functions (30°–95° epicentral distances) and red circles represent events used for PP receiver functions (>95° epicentral distances). Red circles show 30° and 95° distance from the center of the network shown by green star.
StaonName Long Lat H Error VpVs Error RF_Amp Confidence #RFs
AFSR 33.071 39.447 35.735 1.431 1.715 0.006 0.25 A 82
AT01 36.711 39.724 27.051 1.221 1.837 0.003 0.26 B 179
AT02 37.057 39.381 44.752 2.109 1.785 0.005 0.284 A 124
AT03 37.596 39.03 38.907 1.698 1.71 0.007 0.192 A 111
AT05 38.794 38.217 33.063 1.321 1.82 0.003 0.444 A 171
AT06 35.667 39.673 37.738 1.581 1.909 0.001 0.067 C 146
AT07 36.222 39.145 38.239 1.611 1.778 0.005 0.227 A 173
AT08 36.927 38.804 39.241 1.844 1.766 0.005 0.149 B 216
AT09 37.57 38.402 39.408 1.522 1.832 0.003 0.142 A 119
AT10 37.861 38.012 30.725 1.281 1.923 0.001 0.126 B 68
AT11 38.376 37.758 29.723 1.439 1.812 0.004 0.142 B 191
AT12 34.745 39.452 36.236 1.551 1.856 0.002 0.145 B 117
AT13 35.315 39.077 35.067 1.548 1.755 0.005 0.233 A 191
AT14 36.06 38.628 39.408 1.615 1.724 0.006 0.232 B 214
AT15 36.776 38.348 37.237 1.482 1.946 0.002 0.22 A 172
AT16 37.136 38.084 33.397 1.336 1.893 0 0.205 A 215
AT17 37.52 37.747 35.067 1.403 1.798 0.004 0.202 A 180
AT18 37.959 37.443 29.556 1.163 1.816 0.003 0.218 A 146
AT19 33.581 39.735 39.241 1.728 1.712 0.007 0.27 B 207
AT20 34.157 39.364 36.236 1.556 1.805 0.004 0.242 B 208
AT21 34.525 38.927 37.571 1.557 1.72 0.006 0.297 A 186
AT22 34.99 38.591 36.069 1.486 1.885 0 0.286 A 177
AT23 35.55 38.363 38.072 1.61 1.877 0.001 0.117 A 135
AT24 35.902 38.165 37.404 1.579 1.95 0.003 0.183 B 231
AT25 36.459 37.918 42.414 1.565 1.793 0.004 0.3 B 122
AT27 37.196 37.484 27.385 1.073 1.771 0.004 0.314 A 105
AT28 37.55 37.253 29.556 1.178 1.652 0.008 0.393 A 219
AT30 34.005 38.764 31.56 1.245 1.812 0.003 0.317 A 209
AT31 34.508 38.573 33.397 1.364 1.821 0.003 0.216 A 155
AT32 34.889 38.297 33.397 1.447 1.875 0.001 0.144 A 157
AT33 35.15 38.029 34.232 1.325 1.836 0.002 0.191 A 185
AT34 35.515 37.905 40.41 1.562 1.961 0.003 0.127 A 206
AT35 35.877 37.673 32.896 1.401 1.704 0.007 0.208 A 195
AT37 36.492 37.244 30.892 1.311 1.771 0.005 0.302 A 124
AT38 36.808 37.036 30.892 1.341 1.78 0.005 0.384 A 213
AT39 37.223 36.932 31.226 1.279 1.733 0.006 0.266 A 56
AT40 32.451 38.849 38.74 1.604 1.721 0.006 0.099 B 144 38.74 1.604 1.721 0.006
Alternave soluon
all receiver functions at an individual station to increase the signal to noise ratio of the data after normalizing the amplitude of a trace and correcting for moveout. We then choose a time window around the Ps and PpPs arrivals on the stacked trace, with the maximum amplitude in the time window being automatically chosen as the conversion of interest. From these times, we can calculate κ and H as follows (Zandt and Ammon, 1995):
κ=
(
−ρ)
− + ρ
+
1 2 2 2 1
2
2 2
V t
t t V
p Ps p
PpPs Ps
, (1)
and
H t V
V
V
ps p
p
p
= ×
× −
− −
κ ρ
κ ρ
1 2 1
2
2 2
, (2)
where Vp is an assumed value for average P-wave velocity in the crust (6.1 km/s in this study) that generally has a small effect on overall crustal thick-ness estimates (Zhu and Kanamori, 2000), ρ is an arbitrary ray parameter, but should be the same as the ray parameter used to correct for moveout in the stacking routine, and tPS and tPpPs are the time picks from the stacked receiver function at a station of interest. Errors are then estimated by comparing the chosen arrivals from the stacked trace with time of the maximum amplitudes
−5 0 5 10 15 20
−0.6 −0.4 −0.2 0 0.2 0.4 0.6 0.8 1 1.2
Time (s)
Amplitude
−5 0 5 10 15 20
−0.6 −0.4 −0.2 0 0.2 0.4 0.6 0.8 1 1.2
Time (s)
Amplitud
e
1.65
1.7
1.75
1.8
1.85
1.9
1.95
2
depth km
depth km
Vp/Vs
−0.15
−0.1
−0.05
0
0.05
0.1
0.15
0.2
0.25
0. 1
0.1
0.1 0. 1
0.1
0.1 0.15
0.15
0. 15 0.15
0.15
0.15 0.2
0. 2 0.2 0.2
15 20 25 30 35 40 45 50 55 15 20 25 30 35 40 45 50 55
1.65
1.7
1.75
1.8
1.85
1.9
1.95
2
Vp/Vs
−0.08
−0.06
−0.04
−0.02
0
0.02
0.04
0.06
0.08
AT32
Depth 27 ± 0.036 km
Vp/Vs
2 ± 0.03
AT30
Depth 30 ± 1.1 km
Vp/Vs
1.85 ± 0.04
AT30 Depth 31.56 ± 1.25 km;
Vp/Vs
1.81 ± 0.003
AT32 Depth 33.39 ± 1.36 km;
Vp/Vs
1.81 ± 0.001
A
C
D
B
Figure 4. Comparison between H-κ (crustal
thickness H, and Vp/Vs ratio, κ) stacking
analysis and stack windowing analysis
(SWA) for two stations. (A) H-κ result for
station AT30 representing a good H-κ
solu-tion. (B) H-κ results for station AT32
repre-senting poor H-κ solution. (C) SWA result
for station AT30 showing good agreement
with the H-κ method. (D) SWA result for
station AT32 showing that a good result can be found without having to modify
H-κ parameter search space. Red, green,
and black asterisks represent the expected times of Ps and its first and second mul-tiples with 35 km crustal thickness and
1.7, 1.8, and 1.9 Vp/Vs ratios, respectively.
in the chosen time window on individual traces by taking the standard devia-tion of the time differences. Using this uncertainty in a standard propagadevia-tion of errors calculation, we can estimate errors in κ and H as follows:
∆κ= ∂κ ∆ κ ∆
∂
+
∂ ∂
tPs tPs tPpPs tPpPs
2 2
(3)
and
∆H H ∆ ∆
T t
H
= ∂
∂
+ ∂∂
Ps Ps
2 2
κ κ , (4)
where Δ is the standard deviation of the measurement. This technique, while requiring more interaction than H-κ stacking, allows for an improved recovery of both crustal thickness and Vp/Vs ratios where traditional H-κ stacking analy-sis may struggle, while obtaining very similar results in areas of simple crustal structure (Fig. 4).
Adaptive Common Conversion Point (CCP) Stacking
In order to resolve spatial variability in the crust and uppermost mantle, we utilize common conversion point (CCP) stacking analysis (Dueker and Sheehan, 1997) to create a three-dimensional (3D) volume of receiver function ampli tude. In this analysis, the region of interest is gridded into bins based on user-defined width and spacing. Receiver functions are migrated to depth and ray traced back to their theoretical locations in the Earth, and receiver func-tion amplitudes that plot within the same bin are averaged to represent the structure in that bin. To compute the theoretical ray paths in our data set, we use a regional 1D velocity model derived from the shear wave velocity model of Delph et al. (2015a), which comprises a Vs = 3.4 km/s crust and Vs = 4.2 km/s mantle with a constant Vp/Vs ratio of 1.78 and crustal thickness of 38 km. Although this 1D velocity model does not account for the variability in crustal thicknesses and velocities throughout our region, the differences that arise in ray tracing receiver functions to obtain piercing points based on a 1D model as opposed to a 3D model are very minor, especially in the crust. However, variability in Vp/Vs can have a significant effect on the depth to discontinuities (Zhu and Kanamori, 2000). We account for these lateral variations in velocity structure by creating a 3D velocity model that applies timing corrections to the ray-traced receiver functions so that conversions are mapped to their proper locations at depth (Eagar et al., 2010). Boundaries in this 3D velocity model are derived from the crustal thickness and Vp/Vs results from SWA in this study (Fig. 4) and the average shear wave velocities in the crust are derived from Delph et al. (2015a). For the mantle, a Vs of 4.2 km/s was assumed based on the results of Delph et al. (2015a) and Fichtner et al. (2013) with a constant Vp/Vs of 1.78. In order to maximize spatial resolution in this study, we follow the adap-tive common conversion point approach in Delph and Porter (2015), which al-lows our bin width to dilate from 0.3° to 1° until each bin has at least 10 rays.
RESULTS
By investigating the crustal thickness and Vp/Vs results from SWA (Fig. 5), conversion amplitudes (Fig. 6), and cross sections generated from adaptive CCP stacking analysis (Fig. 7), we can gain insight into the characteristics of the crust and crust-mantle boundary throughout central Anatolia.
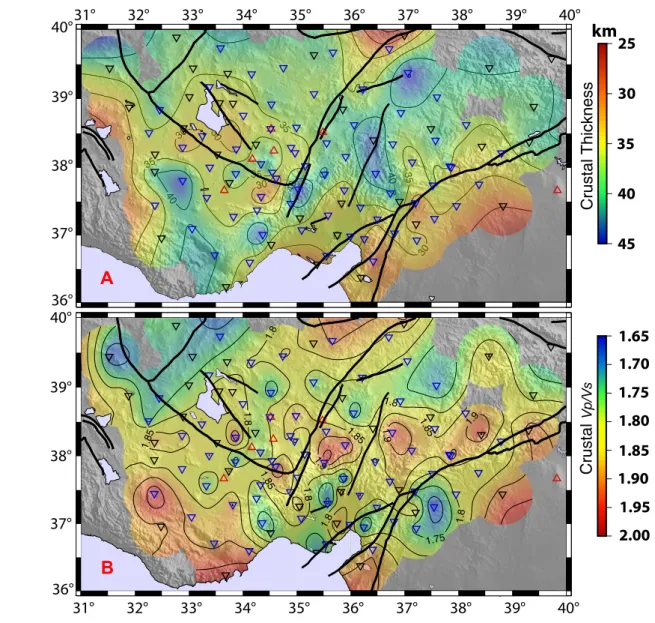
Crustal thickness estimates throughout the region are variable and cor-relate well with tectonic structures (Figs. 5A and 7). The thickest crust in the re-gion corresponds with the eastern Taurus Mountains, where crustal thickness estimates are generally high (>40 km) with values reaching 45 km (Figs. 5A and 7C). The Adana Basin to the south of the Taurus Mountains is characterized by thin crust (<35 km) with measurements as low as 25 km, indicating crustal thickness changes of as much as 15 km over ~60 km lateral distance (Figs. 5A and 7D). A similar relationship is seen on the southwestern margin of the Kırşehir block, where crustal thicknesses are as low as 30 km (Fig. 5A) in the Tuz Gölü Basin. Thin crust (~30 km) also characterizes the Anatolian plate near the EAFZ and the Arabian plate. In the CAVP and much of the Kırşehir block, crustal thickness ranges from 35 to 40 km (Fig. 7E).
The estimates of bulk crustal Vp/Vs values are variable but show some ap-parent trends (Fig. 5B). The thick crust (>40 km) beneath the Taurus Mountains is associated with elevated Vp/Vs ratios (>1.85) (Fig. 5B). In contrast, the CAVP exhibits slightly lower Vp/Vs (1.75–1.8) values (Fig. 5B), suggesting that the ef-fect of Neogene volcanism on the bulk Vp/Vs of the crust is rather limited. The Adana Basin is also characterized by low Vp/Vs (<1.8) values except in the east near the young mafic volcanics, coinciding with a high Vp/Vs (>1.85) anomaly (Fig. 5B). The lowest Vp/Vs ratios (~1.7) are found along the IAESZ near the northwestern Kırşehir block (Fig. 5B), possibly reflecting higher SiO2 content because silica inversely correlates with the Vp/Vs ratio (Christensen, 1966).
Through the investigation of conversion amplitudes in receiver functions, we can gain insight into the relative impedance contrast in the crust. We ob-serve high negative conversions in the mid-crust in 2 distinct regions: (1) near the boundary of the Anatolian and Arabian plates near the EAFZ (Figs. 6, 7C, and 7D), and (2) along the CAVP, where the southern anomalies show an ap-parent offset across Tuz Gölü fault zone (from 22 to 15 km; Figs. 6, 7A, and 7B). These anomalies are further discussed in the following.
DISCUSSION
Nature of Crustal Boundaries in Central Anatolia
these variations are due to the collision of Arabia with Eurasia, generating thicker crust north of the suture zone, rather than transform movement along the EAFZ. However, as convergence between Arabia and Eurasia proceeded, this variation in crustal thickness may have served as a boundary along which stress could be localized, leading to the development of the EAFZ in Pliocene time as a lithospheric-scale transform fault controlling tectonic escape of the
Anatolian plate. In central Anatolia, the Moho beneath the Tuz Gölü fault zone seems to be continuous, while the low-velocity layers at mid-crustal depths are offset, indicating that the Tuz Gölü fault represents a tectonic structure limited to the upper-middle crust (Figs. 7A, 7B).
A large decrease in crustal thickness also occurs at the transition from the Taurus Mountains (>40 km) into the Adana Basin (~30 km) over a relatively
Crustal Thickness
45
40
35
30
25
km
30
30
30
30
35
35
35
35 40
40 40
30 30 300
30
30 3
30
30 30
3
35 35
35
35
35
35
35
35 35
35 35 355
3555 35 35 35
35 40404040
40 40 40 40 40 40
40
40
40
40
4
40 404040404040404040404040404040404040
31°
32°
33°
34°
35°
36°
37°
38°
39°
40°
36°
37°
38°
39°
40°
31°
32°
33°
34°
35°
36°
37°
38°
39°
40°
37°
38°
39°
40°
36°
Crustal
Vp
/V
s
1.90
1.95
2.00
1.80
1.70
1.75
1.65
A
b
1.85
b
1.75 1.8 1.8
1.8
1.8
1. 8
1.8
1.85 1.85
1.8 5
1.85
1.85
1.9
1. 9
1.9
1.9
B
Figure 5. Results of stack windowing analy sis. (A) Crustal thickness. (B) Bulk
crustal Vp/Vs. Red triangles are
short lateral distance (~60 km). This pronounced crustal thinning corresponds to the Kozan fault, which is thought to be a transtensional splay fault of the EAFZ (Aksu et al., 2014). However, the identified motion on the Kozan fault is not sufficient to accommodate the 2 km uplift of the Taurus Mountains since the late Miocene. According to the depth contours of subducting African litho-sphere extracted from teleseismic tomography (Biryol et al., 2011), the Adana Basin is located east of the Cyprus slab in an area where no subducting litho-sphere is imaged, suggesting minimal sensitivity to processes related to slab dynamics. In addition, the Adana Basin was located at the leading edge of the fold and thrust belt, undergoing limited crustal thickening compared to the overthickened crust of the Anatolide-Tauride block. We interpret the Adana Basin as a diffuse transtensional plate boundary between the Anatolian and African plates that likely formed as a piggyback basin.
Across the eastern segment of the ITS that spatially coincides with a portion of the CAFZ, a thinning of the crust in the Kırşehir block–Tuz Gölü Basin is ob-served (Fig 5A, 7B, 7D, and 7E). Many previous geophysical studies have found drastic changes in various geophysical properties (e.g., Bouguer gravity anom-aly, Ates et al., 1999; Pn velocities, Gans et al., 2009; shear wave velocities, War-ren et al., 2013; Delph et al., 2015a). We interpret the diffeWar-rences in geophysical characteristics on either side of the suture to reflect these observed differences in crustal thickness, rather than previous interpretations that the upper mantle is slower to east of the ITS than to the west (Gans et al., 2009). To the west, the crust of the Tuz Gölü Basin and the southern Kırşehir block is relatively thin
(~30 km), thickening gradually to the northeast. As this thin crust crosses the inferred location of the Inner Tauride suture, it indicates that the true location of the Inner Tauride suture, at least in the lower crust, may be located farther to the northeast near the surface trace of the Tuz Gölü fault.
Low-Velocity Zones in the CAVP
We observe multiple large negative-amplitude conversions beneath most of the CAVP indicative of the presence of a velocity decrease with depth (Fig. 6). The top of the velocity decrease is shallower beneath the Anatolide-Tauride block (15 km) than it is beneath the Kırşehir block (22 km) (Figs. 6, 7A, and 7B). The northern anomaly beneath the CAVP at 18 km depth is the largest negative-amplitude anomaly (Figs. 6 and 7A), and correlates well with the in-ferred centers that fed the eruptions of large ignimbrite deposits throughout central Turkey (Aydın et al., 2012). If these low-velocity layers are associated with crustal melt that is sourcing the CAVP, we might expect high Vp/Vs ratios in the region. However, the bulk crustal Vp/Vs ratios are not consistent with a substantial amount of melt in this area (~1.75), suggesting that if these velocity decreases represent the presence of partial melts, they must be confined to rela tively thin layers (Fig. 5B). The negative anomaly located near the bound-ary of the Anatolian and Arabian plates at a depth of 19 km (Fig. 6) also cor-relates well with the recent small-volume mafic volcanic activity (Rojay et al., 2001), and may represent a mafic sill that has stalled in the crust.
31°
31°
32°
32°
33°
33°
34°
34°
35°
35°
36°
36°
37°
37°
38°
38°
39°
39°
40°
40°
36°
37°
38°
39°
40°
Receiver Function Amplitudes
–0.6
–0.5
–0.4
–0.3
–0.2
–0.1
0
15
22
18
19
0
20
40
60
80
100 Depth (km)
10 0 5 Elevaon (km) A dana Basin Anatolide T auride Kirsehir Block CAFZ KF
?
?
Slab Moho?
E ′ Bloc k 7E 0 100 200 300 400 0 100 200 300 400 7C 7D 0 100 200 300 400 50 0 0 100 200 300 400 50 06 00 Distance (km) 0 20 40 60 80100 Depth (km) 100 80 60Depth (km)40 20 0 100 80 60Depth (km)40 20 0 100 80 60Depth (km)40 20 0
10 0 5 Elevaon (km) 10 0 5 Elevaon (km) 10 0 5 Elevaon (km) 10 0 5 Elevaon (km) 0 100 200 300 400 50 06 00
RF Amplitude (Normalized)
–0.35 –0.25 –0.15 –0.05 0.05 0.15 0.25 0.35
A
B
C
D
E
32° 32° 34° 34° 36° 36° 38° 38° 40° 40° 34° 34° 36° 36° 38° 38° 40° 40°A
A
′
B
B
′
C
C
′
D
D
′
E
F
E
′
F
′
EAFZ Arabian Kirsehir Block Anatolid e-Tauride Block Anatolide -T auride Block Anatolide -T auride Block CAFZ CAFZ SRF Kirsehir Block TGFZ Ar abian Plat e EAFZ Anatolide -T auride Block Anatolide -T auride Block Kirsehir Block TGFZ CAFZ A dana Basin Anatolide -T auride Block EAFZ KF Arabian Plat e A ′ B ′ C ′ D ′ Plate?
?
Slab Moho?
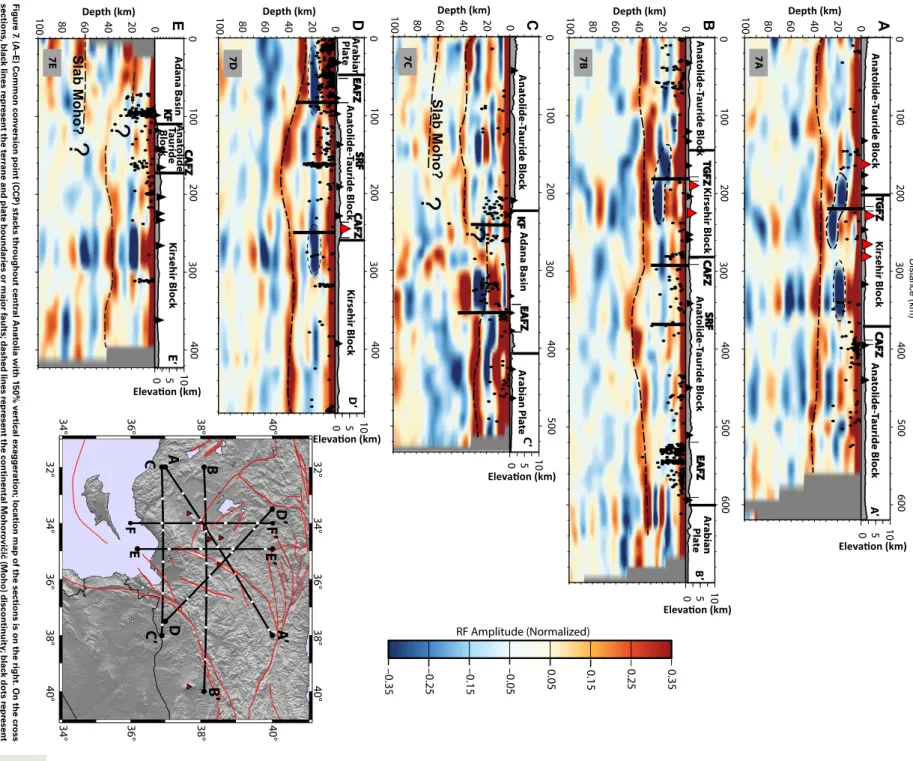
7A 7B SRF Figur e 7. (A–E) Common con
version point (CCP) stacks thr
oughout centr
al Anat
olia with 150% v
er
tical exagg
er
ation;
location map of the sections is on the right.
On the cr
oss
sections,
black lines r
epr
esent the t
err
ane and plat
e boundaries or major f
aults;
dashed lines r
epr
esent the continental Mohor
ovi
č
i
ć
(Moho) discontinuity;
black dots r
epr esent the r elocat ed ear thquak es acr
oss the r
egion (fr om T ur kelli et al., 20 15). TGFZ—T
uz Gölü f
ault z one; CAFZ—Centr al Anat olian f ault z one; EAFZ—East Anat olian f ault z one; KF— K ozan f ault; SRF—Sar ız f ault. Not
e that cr
oss-section FF
′
is sho
wn in Figur
Uplift of the Central Taurus Mountains
Schildgen et al. (2014) identified multiple episodes of uplift of the central Taurus Mountains along the southern margin of the central Anatolian plateau initiating in the late Miocene–Pliocene and followed by a late Pliocene–early Pleistocene episode of faster uplift that may be related to the arrival of the Eratosthenes Seamount along the subduction margin near Cyprus ( Schildgen et al., 2012a). These events are consistent with uplift observed in Cyprus that shows uplift similar in magnitude and timing to what has occurred in the central Taurus Mountains (~2 km of uplift in the past ~6 m.y.; Morag et al., 2016). The proposed mechanisms for this uplift are generally related to slab breakoff. Cosentino et al., (2012) proposed that the upwelling of astheno-sphere after slab breakoff was responsible for the uplift, while Schildgen et al. (2012a, 2012b, 2014) interpreted that some of the uplift could be attributed to the topographic response of slab breakoff (e.g., Duretz et al., 2011) without requiring the influx of asthenosphere to support the elevations of the central Taurus Mountains.
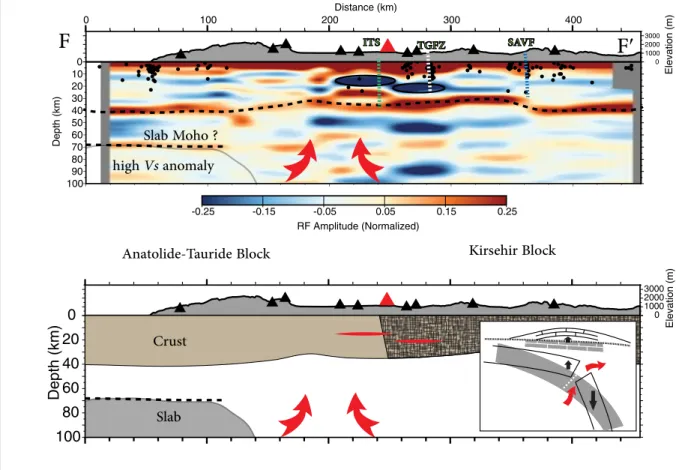
Our results show a good correlation of crustal thickness and elevation in the Taurus Mountains (Fig. 5A). The central Taurus Mountains have average elevations of ~1.5–2.0 km and a crustal thickness of ~40 km. While Airy isostasy depends on assumptions made about crustal and upper mantle density that are generally not well constrained, these crustal thicknesses and elevations are consistent with an isostatically compensated crust. In addition, the pres-ence of a fast seismic velocity anomaly in the uppermost mantle beneath the central Taurus Mountains, interpreted as representing the subducting African lithosphere (Bakırcı et al., 2012), indicates that the presence of asthenosphere beneath the central Taurus Mountains is unlikely. Consistent with this fast ve-locity anomaly, we observe a weak positive amplitude conversion at depths ~65–80 km beneath the central Taurus Mountains that spatially corresponds to the top of the slab imaged by Bakırcı et al. (2012) (Figs. 7C, 7E, and 8). This dis-continuity can be traced to the northern edge of the central Taurus Mountains, and disappears abruptly near the southernmost extension of the CAVP, which displays young volcanism with geochemical characteristics consistent with asthenospheric input (Reid et al., 2017) (Fig. 8). The dip of this discontinuity is
-0.25 -0.15 -0.05 0.05 0.15 0.25
RF Amplitude (Normalized) 0
10 20 30 40 50 60 70 80 90 100
Depth (km)
0 100 200 300 400
Distance (km)
0 1000 2000 3000
Elevation (m)
0
20
40
60
80
100
Depth (km)
0 1000 2000 3000
Elevation (m)
ITS
TGFZ
SAVF
Anatolide-Tauride Block
Slab
Kirsehir Block
Slab Moho ?
high Vs anomaly
Crust
F
F
′
subhorizontal, indicating the shallow aseismic underthrusting of the African lithosphere. At greater depth, the Cyprus slab appears segmented in the tele-seismic P wave tomography images, suggesting that the slab is currently in the process of detachment beneath central Anatolia (Biryol et al., 2011).
Based on these results, the fast shear velocities imaged beneath the cen-tral Taurus Mountains (Bakırcı et al., 2012), and the geochemical signatures indicating an input of asthenospheric material immediately to the north in the CAVP (Reid et al., 2017), we propose that rollback of the Cyprus slab initiated by at least mid-Miocene time, as indicated by extensional exhumation in the Kırşehir block (Whitney and Dilek, 1997; Whitney et al., 2003; Fayon and Whit-ney, 2007) and the initiation of volcanism in the CAVP (Le Pennec et al., 1994; Aydar et al., 2012). Because of this rollback, the central Taurus Mountains sub-sided due to the increased load of a vertically dipping slab, allowing for the deposition of late Miocene marine sediments. In the late Miocene–Pliocene, the central Taurus Mountains were characterized by thick crust most likely uplifted to attain isostatic balance. The segmentation of the Cyprus slab ac-celerated, probably just after the collision of Eratosthenes Seamount with the ongoing African subduction, and resulted in recent slab breakoff, followed by slab rebound and subsequent rapid late Pliocene–early Pleistocene uplift in the overriding plate (Buiter et al., 2002; Duretz et al., 2011), that formed the modern topography of the southern margin of the central Anatolian pla-teau (Fig. 8). This slab roll back and final breakoff would create space for the upwelling of asthenospheric material to reach the base of the lithosphere beneath central Anatolia, leading to the geochemical signatures volcanism found in the CAVP (Reid et al., 2017).
CONCLUSION
This study used recently acquired seismic data from the CD-CAT seismic deployment to produce the highest resolution images of crustal variability in central Anatolia to date. Overall, we used data from 500 teleseismic events recorded by 92 broadband seismic stations for the calculation of P and PP re-ceiver functions. We analyzed crustal thickness and Vp/Vs ratios for this data set using SWA, which represents an interactive alternative to H-κ stacking analysis in tectonically complex regions. In addition, we utilized adaptive CCP stacking analysis to generate an amplitude volume representing depths to im-pedance contrasts that allows us to gain insight into the lateral seismic varia-tions of the crust and upper mantle in central Anatolia.
Our main findings are summarized as follows.
1. Crustal thickness measurements correlate well with high elevations sup-porting isostatically compensated crust. The thickest crust is found in the Taurus Mountains (>40 km), and crustal thicknesses decreased rapidly to the south in the Adana Basin (<35 km) and Arabian plate (~30 km), and to the northwest be-neath the Tuz Gölü Basin (~30 km) and the Kırşehir block (35–40 km).
2. Bulk Vp/Vs estimates are highly variable in the region. Generally, high
Vp/Vs ratios (>1.85) are observed across the Taurus Mountains, while lower
Vp/Vs ratios (~1.7) are observed along the IAESZ that bounds the Kırşehir block to the northwest.
3. Multiple low-velocity zones displaying large negative impedance con-trasts are observed between 15 and 25 km depth near the EAFZ and beneath the CAVP and may correspond to mid-crustal magma reservoirs feeding sur-face volcanism.
4. A gently dipping positive amplitude anomaly interpreted as the Moho of the underthrusting African lithosphere is between 65 and 80 km depth be-neath the central Taurus Mountains. This anomaly abruptly ends just south of the CAVP, where young volcanism shows geochemical indicators for astheno-spheric input in agreement with slab breakoff and subsequent rebound coeval with the onset of late Pliocene–early Pleistocene rapid uplift raising the late Miocene marine sequences ~2 km above the present-day sea level.
ACKNOWLEDGMENTS
This research was funded by National Science Foundation grant EAR-1109336 to Beck. The stack-ing windowstack-ing analysis (SWA) code is available by contactstack-ing Abgarmi or Delph. We thank Dogan Kalafat and Metin Kahraman for providing the relocated earthquake data, and Nuretdin Kaymakçı for providing the digital database of the faults in Anatolia. We also thank Van Hinsbergen and the anonymous reviewer for their careful reading of our manuscript and insightful comments and suggestions. The portable seismic instruments used in Continental Dynamics–Central Anatolian Tectonics (CD-CAT) deployment were provided by IRIS PASSCAL (Incorporated Research Insti-tutions for Seismology Portable Array Seismic Studies of the Continental Lithosphere) and the Kandilli Observatory and Earthquake Research Institute. The figures in this study were produced using Generic Mapping Tools (GMT) developed by Wessel and Smith (1991).
REFERENCES CITED
Aksu, A.E., Hall, J., and Yaltirak, C., 2005, Miocene to recent tectonic evolution of the east-ern Mediterranean: New pieces of the old Mediterranean puzzle: Marine Geology, v. 221, p. 1–13, https:// doi .org /10 .1016 /j .margeo .2005 .03 .014 .
Aksu, A.E., Walsh-Kennedy, S., Hall, J., Hiscott, R.N., Yaltırak, C., Akhun, S.D., and Çifçi, G., 2014, The Pliocene–Quaternary tectonic evolution of the Cilicia and Adana basins, eastern Medi-terranean: Special reference to the development of the Kozan fault zone: Tectonophysics, v. 622, p. 22–43, https:// doi .org /10 .1016 /j .tecto .2014 .03 .025 .
Ates, A., Kearey, P., and Tufan, S., 1999, New gravity and magnetic anomaly maps of Turkey: Geophysical Journal International, v. 136, p. 499–502, https:// doi .org /10 .1046 /j .1365 -246X .1999 .00732 .x .
Aydar, E., Schmitt, A.K., Çubukçu, H.E., Akin, L., Ersoy, O., Sen, E., Duncan, R.A., and Atici, G., 2012, Correlation of ignimbrites in the central Anatolian volcanic province using zircon and plagioclase ages and zircon compositions: Journal of Volcanology and Geothermal Re-search, v. 213–214, p. 83–97, https:// doi .org /10 .1016 /j .jvolgeores .2011 .11 .005 .
Aydın, F., Siebel, W., Uysal, I., Ersoy, Y., Schmitt, A., Sönmez, M., and Duncan, R., 2012, Geochem-ical, isotopic (Sr-Nd-Pb) and geochronological (Ar-Ar and U-Pb) constraints on Quaternary bimodal volcanism of the Niğde Volcanic Complex (central Anatolia, Turkey): European Geo-sciences Union Geophysical Research Abstracts, v. 14, p. 14300–14302, EGU2012-14300-2. Aydın, F., Schmitt, A.K., Siebel, W., Sönmez, M., Ersoy, Y., Lermi, A., Dirik, K., and Duncan, R.,
2014, Quaternary bimodal volcanism in the Niğde Volcanic Complex (Cappadocia, central Anatolia, Turkey): Age, petrogenesis and geodynamic implications: Contributions to Miner-alogy and Petrology, v. 168, 1078, https:// doi .org /10 .1007 /s00410 -014 -1078 -3 .
Bakırcı, T., Yoshizawa, K., and Ozer, M.F., 2012, Three-dimensional S-wave structure of the upper mantle beneath Turkey from surface wave tomography: Geophysical Journal International, v. 190, p. 1058–1076, https:// doi .org /10 .1111 /j .1365 -246X .2012 .05526 .x .
Beck, S.L., and Zandt, G., 2005, Continental lithospheric deformation along a major strike-slip fault zone: The central North Anatolian fault zone, Turkey: International Federation of Digital Seismograph Networks: Other/Seismic Network, https:// doi .org /10 .7914 /SN /YL_2005 . Biryol, C.B., Beck, S.L., Zandt, G., and Ozacar, A.A., 2011, Segmented African lithosphere
beneath the Anatolian region inferred from teleseismic P-wave tomography: Geophysi-cal Journal International, v. 184, p. 1037–1057, https:// doi .org /10 .1111 /j .1365 -246X .2010 .04910 .x .
Bozkurt, E., 2001, Neotectonics of Turkey—A synthesis: Geodinamica Acta, v. 14, p. 3–30, https:// doi .org /10 .1080 /09853111 .2001 .11432432 .
Buiter, S.J.H., Govers, R., and Wortel, M.J.R., 2002, Two-dimensional simulations of surface defor mation caused by slab detachment: Tectonophysics, v. 354, p. 195–210, https:// doi .org /10 .1016 /S0040 -1951 (02)00336 -0 .
Bulut, F., Bohnhoff, M., Eken, T., Janssen, C., Kılıç, T., and Dresen, G., 2012, The East Anatolian fault zone: Seismotectonic setting and spatiotemporal characteristics of seismicity based on precise earthquake locations: Journal of Geophysical Research, v. 117, B07304, https:// doi .org /10 .1029 /2011JB008966 .
Çemen, I., Göncüoglu, M.C., and Dirik, K., 1999, Structural evolution of the Tuz Gölü basin in central Anatolia, Turkey: Journal of Geology, v. 107, p. 693–706, https:// doi .org /10 .1086 /314379 .
Christensen, N.I., 1966, Elasticity of ultrabasic rocks: Journal of Geophysical Research, v. 71, p. 5921–5931, https:// doi .org /10 .1029 /JZ071i024p05921 .
Cosentino, D., Schildgen, F.T., Cipollari, P., Faranda, C., Gliozzi, E., Hudáčková, N., Lucifora, S., and Strecker, M.R., 2012, Late Miocene surface uplift of the southern margin of the Central Anatolian plateau, Central Taurides, Turkey: Geological Society of America Bulletin, v. 124, p. 133–145, https:// doi .org /10 .1130 /B30466 .1 .
Delph, J.R., and Porter, R.C., 2015, Crustal structure beneath southern Africa: Insight into how tectonic events affect the Mohorovicic discontinuity: Geophysical Journal International, v. 200, p. 254–264, https:// doi .org /10 .1093 /gji /ggu376 .
Delph, J.R., Zandt, G., and Beck, S.L., 2015, A new approach to obtaining a 3D shear wave veloc-ity model of the crust and upper mantle: An application to eastern Turkey: Tectonophysics, v. 665, p. 98–100, https:// doi .org /10 .1016 /j .tecto .2015 .09 .031 .
Dueker, K.G., and Sheehan, A.F., 1997, Mantle discontinuity structure from midpoint stacks of converted P to S waves across the Yellowstone hotspot track: Journal of Geophysical Re-search, v. 102, p. 8313–8327, https:// doi .org /10 .1029 /96JB03857 .
Duretz, T., Gerya, T.V., and May, D.A., 2011, Numerical modelling of spontaneous slab breakoff and subsequent topographic response: Tectonophysics, v. 502, p. 244–256, https:// doi .org /10 .1016 /j .tecto .2010 .05 .024 .
Eagar, K.C., and Fouch, M.J., 2012, FuncLab: A MATLAB Interactive Toolbox for Handling Re-ceiver Function Datasets: Seismological Research Letters, v. 83, p. 596–603, https:// doi .org /10 .1785 /gssrl .83 .3 .596 .
Eagar, K.C., Fouch, M.J., and James, D.E., 2010, Receiver function imaging of upper mantle com-plexity beneath the Pacific Northwest, United States: Earth and Planetary Science Letters, v. 297, p. 141–153, https:// doi .org /10 .1016 /j .epsl .2010 .06 .015 .
Fayon, A.K., and Whitney, D.L., 2007, Interpretation of tectonic versus magmatic processes for re-setting apatite fission track ages in the Niğde Massif, Turkey: Tectonophysics, v. 434, p. 1–13, https:// doi .org /10 .1016 /j .tecto .2007 .01 .003 .
Fichtner, A., Saygin, E., Taymaz, T., Cupillard, P., Capdeville, Y., and Trampert, J., 2013, The deep structure of the North Anatolian fault zone: Earth and Planetary Science Letters, v. 373, p. 109–117, https:// doi .org /10 .1016 /j .epsl .2013 .04 .027 .
Frassetto, A.M., Zandt, G., Gilbert, H., Owens, T.J., and Jones, C.H., 2011, Structure of the Sierra Nevada from receiver functions and implications for lithospheric foundering: Geosphere, v. 7, p. 898–921, https:// doi .org /10 .1130 /GES00570 .1 .
Gans, C.R., Beck, S.L., Zandt, G., Biryol, C.B., and Ozacar, A.A., 2009, detecting the limit of slab break-off in central Turkey: New high-resolution Pn tomography results: Geophysical Jour-nal InternatioJour-nal, v. 179, p. 1566–1572, https:// doi .org /10 .1111 /j .1365 -246X .2009 .04389 .x . Göncüoğlu, M.C., Toprak, V., Kuscu, I., Erler, A., and Olgun, E., 1991, Geology of the Western Part
of the Central Anatolian Massif, Part 1: Southern Section: Turkish Petroleum Corporation (TPAO) Report 2909, 140 p. (in Turkish).
Govers, R., and Fichtner, A., 2016, Signature of slab fragmentation beneath Anatolia from full-waveform tomography, 2016: Earth and Planetary Science Letters, v. 450, p. 10–19, https:// doi .org /10 .1016 /j .epsl .2016 .06 .014 .
Gürer, D., van Hinsbergen, D.J.J., Matenco, L., Corfu, F., and Cascella, A., 2016, Kinematics of a former oceanic plate of the Neotethys revealed by deformation in the Ulukışla basin ( Turkey): Tectonics, v. 35, p. 2385–2416, https:// doi .org /10 .1002 /2016TC004206 .
Higgins, M., Schoenbohm, L.M., Brocard, G., Kaymakci, N., Gosse, J.C., and Cosca, M.A., 2015, New kinematic and geochronologic evidence for the Quaternary evolution of the Central Ana-tolian fault zone (CAFZ): Tectonics, v. 34, p. 2118–2141, https:// doi .org /10 .1002 /2015TC003864 . Innocenti, F., Mazzuoli, R., Pasquare, G., Radicati Di Brozolo, F., and Villari, L., 1975, The Neogene
calcalkaline volcanism of Central Anatolia: geochronological data on Kayseri-Nigde area: Geological Magazine, v. 112, p. 349–360, https:// doi .org /10 .1017 /S0016756800046744 . Kaymakçı, N., Inceöz, M., Ertepinar, P., and Koç, A., 2010, Late Cretaceous to recent kinematics of
SE Anatolia (Turkey), in Sosson, M., et al., eds., Sedimentary Basin Tectonics from the Black Sea and Caucasus to the Arabian Platform: Geological Society of London Special Publication 340, p. 409–435, https:// doi .org /10 .1144 /SP340 .18 .
Koçyığıt, A., and Beyhan, A., 1998, A new intracontinental transcurrent structure: The Central Anatolian fault zone, Turkey: Tectonophysics, v. 284, p. 317–336, https:// doi .org /10 .1016 /S0040 -1951 (97)00176 -5 .
Lefebvre, C., Meijers, M.J.M., Kaymakci, N., Peynircioğlu, A., Langereis, C.G., and van Hins-bergen, D.J.J., 2013, Reconstructing the geometry of central Anatolia during the Late Creta-ceous: Large-scale Cenozoic rotations and deformation between the Pontides and Taurides: Earth and Planetary Science Letters, v. 366, p. 83–98, https:// doi .org /10 .1016 /j .epsl .2013 .01 .003 .
Le Pennec, J.L., Bourdier, J.L., Froger, J.L., Temel, A., Camus, G., and Gourgaud, A., 1994, Neo-gene ignimbrites of the Nevsehir plateau (central Turkey): Stratigraphy, distribution and source constraints, Journal of Volcanology and Geothermal Research, v. 63, p. 59–87, https:// doi .org /10 .1016 /0377 -0273 (94)90018 -3 .
Ligorria, J.P., and Ammon, C.J., 1999, Iterative deconvolution and receiver function estimation: Bulletin of the Seismological Society of America, v. 89, p. 1395–1400.
Morag, N., Haviv, I., and Katzir, Y., 2016, From ocean depths to mountain tops: Uplift of the Troodos ophiolite (Cyprus) constrained by low-temperature thermochronology and geo-morphic analysis: Tectonics, v. 35, p. 622–637, https:// doi .org /10 .1002 /2015TC004069 . Muehlberger W.R., and Gordon, M.B., 1987, Observations on the complexity of the East
Anato-lian fault, Turkey: Journal of Structural Geology, v. 9, p. 899–903, https:// doi .org /10 .1016 /0191 -8141 (87)90091 -5 .
Mutlu, A.K., and Karabulut, H., 2011, Anisotropic Pn tomography of Turkey and adjacent regions: Geophysical Journal International, v. 187, p. 1743–1758, https:// doi .org /10 .1111 /j .1365 -246X .2011 .05235 .x .
Okay, A.I., 1984, Distribution and characteristics of the north-west Turkish blueschists, in Dixon, J.E., and Robertson, A.H.F., eds., The Geological Evolution of the Eastern Mediterranean: Geological Society of London Special Publication 17, p. 455–466, https:// doi .org /10 .1144 /GSL .SP .1984 .017 .01 .33 .
Okay, A.I., and Tüysüz, O., 1999, Tethyan sutures of northern Turkey, in Durand, B., et al., eds., The Mediterranean Basins: Tertiary Extension within the Alpine Orogen: Geological Society of London Special Publication 156, p. 475–515, https:// doi .org /10 .1144 /GSL .SP .1999 .156 .01 .22 . Özacar, A.A., Zandt, G., Gilbert, H., and Beck, S.L., 2010, Seismic images of crustal variations
beneath the East Anatolian plateau (Turkey) from teleseismic receiver functions, in Sosson, M., et al., eds., Sedimentary Basin Tectonics From the Black Sea and Caucasus to the Ara-bian Platform: Geological Society of London Special Publication 340, p. 485–496, https:// doi .org /10 .1144 /SP340 .21 .
Özsayın, E., et al., 2013, Plio-Quaternary extensional tectonics of the Central Anatolian plateau: A case study from the Tuz Gölü Basin, Turkey: Turkish Journal of Earth Sciences, v. 22, p. 691–714, https:// doi: 10 .3906 /yer -1210 -5 .
Piper, J.D.A., Gursoy, H., and Tatar, O., 2002, Palaeomagnetism and magnetic properties of the Cappadocian ignimbrite succession, central Turkey and Neogene tectonics of the Anatolian collage: Journal of Volcanology and Geothermal Research, v. 117, p. 237–262, https:// doi .org /10 .1016 /S0377 -0273 (02)00221 -4 .
Radeff, G., Schildgen, T.F., Cosentino, D., Strecker, M.R., Cipollari, P., Darbas, G., and Gurbuz, K., 2015, Sedimentary evidence for late Messinian uplift of the SE margin of the Central Anatolian plateau: Adana Basin, southern Turkey: Basin Research, v. 29, p. 488–514, https:// doi .org /10 .1111 /bre .12159 .