MULTIPARENTAL POPULATIONS
Oas1b-dependent Immune Transcriptional Pro
fi
les
of West Nile Virus Infection in the
Collaborative Cross
Richard Green,*,†Courtney Wilkins,*,†Sunil Thomas,*,†Aimee Sekine,*,†Duncan M. Hendrick,*,† Kathleen Voss,*,†Renee C. Ireton,*,†Michael Mooney,‡,§Jennifer T. Go,*,†Gabrielle Choonoo,‡,§ Sophia Jeng,** Fernando Pardo-Manuel de Villena,††,‡‡Martin T. Ferris,††Shannon McWeeney,‡,§,** and Michael Gale Jr.*,†,1
*Department of Immunology and†Center for Innate Immunity and Immune Disease (CIIID), University of Washington, Seattle, Washington 98109,‡OHSU Knight Cancer Institute,§Division of Bioinformatics and Computational Biology, Department of Medical Informatics and Clinical Epidemiology, and**Oregon Clinical and Translational Research Institute, Oregon Health & Science University, Portland, Oregon 97239,††Department of Genetics and‡‡Lineberger Comprehensive Cancer Center, University of North Carolina, Chapel Hill, North Carolina 27514
ORCID ID: 000-0002-6332-7436 (R.G.)
ABSTRACT The oligoadenylate-synthetase (Oas) gene locus provides innate immune resistance to virus infec-tion. In mouse models, variation in theOas1bgene influences host susceptibility toflavivirus infection. However, the impact ofOasvariation on overall innate immune programming and global gene expression among tissues and in different genetic backgrounds has not been defined. We examined howOas1bacts in spleen and brain tissue to limit West Nile virus (WNV) susceptibility and disease across a range of genetic backgrounds. The laboratory founder strains of the mouse Collaborative Cross (CC) (A/J, C57BL/6J, 129S1/SvImJ, NOD/ShiLtJ, and NZO/HlLtJ) all encode a truncated, defectiveOas1b, whereas the three wild-derived inbred founder strains (CAST/EiJ, PWK/PhJ, and WSB/EiJ) encode a full-length OAS1B protein. We assessed disease profiles and transcriptional signatures of F1 hybrids derived from these founder strains. F1 hybrids included wild-typeOas1b
(F/F), homozygous nullOas1b(N/N), and heterozygous offspring of both parental combinations (F/N and N/F). These mice were challenged with WNV, and brain and spleen samples were harvested for global gene expression analysis. We found that theOas1bhaplotype played a role in WNV susceptibility and disease metrics, but the presence of a functional Oas1ballele in heterozygous offspring did not absolutely predict protection against disease. Our results indicate thatOas1bstatus as wild-type or truncated, and overallOas1bgene dosage, link with novel innate immune gene signatures that impact specific biological pathways for the control offlavivirus infection and immunity through bothOas1b-dependent and independent processes.
KEYWORDS
Oas
flavivirus viral infection innate immunity multiparental
populations Multi-parent
Advanced Generation Inter-Cross (MAGIC) MPP
WNV is a mosquito transmittedflavivirus that emerged from Africa and is now endemic within Asia, middle Eastern Europe, Australia, and the Americas (Courtneyet al.2012). WNV is an enveloped virus carrying a genome of a positive sense, single-stranded RNA of roughly 11,000 nucleotides in length. While only 20% of individuals infected with WNV develop symptoms (www.cdc.gov/westnile), symptomatic indi-viduals can develop clinical illness ranging from West Nile fever to encephalitis or meningitis linked with severe inflammation in the brain and spinal cord, and leading to death (Grahamet al.2016). WNV is among a group of emergingflaviviruses including dengue virus, Zika Virus, and Japanese encephalitis virus that are global health concerns. Copyright © 2017 Greenet al.
doi:https://doi.org/10.1534/g3.117.041624
Manuscript received January 4, 2017; accepted for publication March 24, 2017. This is an open-access article distributed under the terms of the Creative Commons Attribution 4.0 International License (http://creativecommons.org/ licenses/by/4.0/), which permits unrestricted use, distribution, and reproduction in any medium, provided the original work is properly cited.
Supplemental material is available online athttp://www.g3journal.org/content/ 7/6/1665.supplemental.
Understanding their molecular pathogenesis is a major step toward a therapeutic or adjunctive therapy.
During viral infection, the infected cell senses viral replication products, including viral nucleic acid, as foreign, nonself macromole-cules through the actions of pathogen recognition receptors (PRRs), including RIG-I-like receptors (RLRs), Toll-like receptors (TLRs), and other PRRs (Suthar et al.2013). In particular,flaviviruses including WNV are sensed by the RLRs through binding of viral RNA (Loo and Gale 2008, 2011; Errettet al.2013). RNA binding induces RLR activation and interaction with downstream signaling proteins that activate transcription factors IRF3, IRF7, and NF-kB to drive innate immune gene expression and the production of type 1 and III inter-ferons (IFNs). IFN is secreted by the infected cell to signal through the IFN receptors on both the infected cell and on bystander cells, to drive the expression of hundreds of IFN-stimulated genes (ISGs) across the local tissue (Loo and Gale 2011). Innate immune genes and ISGs have antiviral and immune modulatory activity to limit viral replication and spread such that their induction and function are essential for the control of WNV infection and immunity (Daffiset al.2009; Suthar
et al.2010; Lazearet al.2013; Lazear and Diamond 2015).
TheOasgenes includingOas1bare ISGs whose expression is in-duced by IFN in most cell types (Elkhateebet al.2016, Choiet al.2015). In humans, theOasfamily containsOas1,Oas2,Oas3, and Oas-like (OasL) genes.Oas2andOas3genes have high human–mouse sequence similarity with a 1:1 orthogonal copy. The mouseOasgene cluster is located on chromosome 5 and includesOas1,Oas2,Oas3, andOasL
genes. The Oas1 gene has eight orthogonal copies (Oas1a, Oas1b,
Oas1c,Oas1d,Oas1e,Oas1f,Oas1g, andOas1h) in mouse compared to one copy (Oas1) in humans on chromosome 12. These eight mouse
Oas1genes are the result of gene duplications, rearrangements, and other evolutionary processes [Choiet al.2015, for more details of such genome regions in the CC, see Morganet al.(2017)]. Most members of the Oas gene family encode 29-59 oligoadenylate (2-5A) enzymatic activity that catalyzes adenosine into 29-59-linked oligonucleotides re-ferred to as oligoadenylates or 2-5A (Kristiansenet al. 2011). 2-5A serves as a ligand to bind and activate ribonuclease L (RNaseL), a latent endoribonuclease. When activated during viral infection, RNaseL serves to suppress viral replication by nucleolytic targeting viral and host RNAs. RNaseL products of RNA degradation can also serve as activator ligands of the RLRs, thus stimulating and amplifying further rounds of innate immune signaling (Malathiet al.2007, Siddiqui
et al.2012, Drappieret al.2015). Among theOasfamily members,
Oas1blacks 2-5A activity, revealing that the antiviral function of
Oas1bis unique and independent of RNaseL activation for control-ling WNV infection (Scherbik et al. 2006; Courtneyet al. 2012; Elbaheshet al.2011). Oas1b is found truncated in classical inbred mouse strains due the presence of a stop codon/nonsense mutation within the mRNA (Elbaheshet al.2011). When otherwise expressed as a full-length protein, OAS1b provides functional antiviral activity against WNV (Elbahesh et al. 2011). Recent studies found that OAS1b has a C-terminus domain targeting the endoplasmic retic-ulum with binding partner protein ABCF3 assisting in antiviral activity (Courtney et al.2012). The same study showed that
full-length (nontruncated)Oas1binhibited OAS1a activity and lowered 2-5A levels in a dose-dependent mannerin vivo. Polymorphisms in
Oas1bare also thought to impact the overall host immune response to virus infection, but howOas1boperates in immune regulation is not defined (Bighamet al.2011).
In vivostudies assessingOas1bfunction during WNV infection and immunity have been largely conducted with traditional inbred mouse strains, thus limiting analyses of the natural genetic variation ofOas1b
found within populations. Genetic variation of immune genes plays an important role in infection outcome and contributes to host suscepti-bility and resistance (Ferriset al.2013). As noted above, most wild derived inbred mouse strains produce a full-length Oas1b protein, whereas most if not all inbred mouse strains, including the strain of the reference genome, C57BL/6J, have a premature stop codon in
Oas1b that links with susceptibility to WNV infection (Elbahesh
et al.2011; Mashimoet al.2002, see Figure 6, Supplemental Material, Figure S1, and Table 1 and Table 2). To capture the genetic diversity of
Oas1bfor functional studies of WNV susceptibility, we evaluated its expression and linkage with WNV infection outcome and innate im-mune transcriptional signatures in the CC mouse population (Iraqi
et al.2012).
The CC is a MPP, which was generated to improve systems genetic research using the mouse as a model organism. The CC resource is composed of70 independently bred, octo-parental recombinant in-bred mouse strains (Srivastavaet al.2017), out of several hundred lines started (Shorteret al.2017). Each CC line inherits haplotypes from three wild-derived (CAST/EiJ, PWK/PhJ, and WSB/EiJ) andfive clas-sical (A/J, C57BL/6J, 129S1/SvImJ, NOD/ShILtJ, and NZO/HiLtJ) in-bred strains contributing both functional and nonfunctional OAS1b proteins into this MPP. Here, we use F1 crosses between CC strains, generated to understand complex and diverse phenotypic responses to virus infection (Rasmussenet al.2014; Grahamet al.2016). The CC mice are an excellent model of WNV infection because their intron and exon structures in theOasgene family are conserved (Choiet al.2015). However, utilization of F1s allows sequences to differ between alleles at a locus, causing allelic heterozygosity between the wild-derived and classical inbredOas1bsequences in this panel. Within this panel of F1s, we can generate classes of F1s based on theirOas1balleles: func-tionalOas1balleles from Dam and Sire (F/F), heterozygous RIX lines where only the Dam has a functionalOas1ballele (F/N), only the Sire (N/F), or neither parent has functioningOas1balleles (N/N). In pre-vious work, we used the CC model to evaluate host responses to WNV and observed phenotypic variation that recapitulates the diversity in WNV susceptibility and outcomes observed in human populations (Grahamet al.2015, Greenet al.2016a, Greenet al.2016b).
In this study, we performed a coupled analysis ofin vivoWNV infection, viral replication, host transcriptomics, and bioinformatics analyses to expand this genetic screen to identify regulatory loci (Table 1) and determine underlying transcriptional responses contributing to infection outcome. We screened 90 different F1 hybrids between CC strains infected with WNV to identify quantitative trait loci (QTL) contributing to disease phenotypes (Figure 1). To investigate the host response across F1s of differentOas1bhaplotypes, transcriptomics was
n Table 1 QTL Loci
Innate Immune Activation QTL
Chromosome and Region Phenotype Candidate Genes
Chr 5: 120–123 Mb Weight loss (D12) Oas1b(see Table S1 for a complete list)
performed on the spleens of WNV-infected mice at 2, 4, 7, and 12 d postinfection. This transcriptional profiling revealed innate immune regulatory networks associated with theOas1bhaplotype. Our obser-vations show that the CC is an important biomedical model for studies of human disease, and leveraging newly developed genomic resources in this model can improve our understanding of host responses con-trolling WNV infection and immunity.
MATERIALS AND METHODS
Mice and infection
F1s were bred at the University of North Carolina at Chapel Hill under specific-pathogen-free (SPF) conditions. The 6- to 8-wk-old male mice were transferred to the University of Washington and housed directly in a biosafety level 2 (BSL-2) laboratory within an SPF barrier facility. After a resting period, age- and sex-matched 8- to 10-wk-old mice were subcutaneously inoculated in the rear footpad with 100 PFU WNV TX-2002-HC (WN-TX). Mice were monitored daily for morbidity (percentage of initial weight loss) and clinical disease scores. Mice were then housed under BSL-3 conditions throughout the experiments, and tissues were processed under BSL-3 conditions. All animal experiments were approved by the University of Washington Institutional Animal Care and Use Committee. The Office of Laboratory Animal Welfare of the National Institutes of Health (NIH) has approved the University of Washington (A3464-01), and this study was carried out in strict compliance with the Public Health Service (PHS) Policy on Humane Care and Use of Laboratory Animals.
Virus
WN-TX was propagated using previously described methods (Graham
et al.2016; Greenet al.2016). Viral stocks were generated using su-pernatants collected from infected Vero cell lines and stored at 80.
QTL analysis
To identify polymorphic host loci impacting phenotypic differences, we used a modified approach of the DOQTL bioconductor package (version 1.6) in R. The additive haplotype model was used in our analyses and in previous studies (Gattiet al.2014). Under this model the regression equation is defined as:
gi¼X
k
xikak X8
h¼1
dijðhÞbhþgiþei
whereYiindicates the phenotype for animali,xis the indicator of covariate (k) for animal (i), andais the effect of covariate (k).dij(h) is assigned to allelic dosage of the founder (h) at locusj.bhis a co-efficient of the genetic effects in each founder. The secondYiadjusts
for kinship andeifor residual error in the animal (i). In order to generate additive allelic dosage probabilities for each F1, we generated eight-allele probabilities for each F1 with half of the probability for each allele coming from the inbred dam RI, and half coming from the sire RI, based on the MegaMUGA most recent common ancestor (MRCA) probabilities (http://csbio.unc.edu/CCstatus/index.py?run=FounderProbs) (Srivastava
et al.2017). The X-chromosome of these F1 males presents a special case, where the eight-allele probabilities are inherited fully from the dam RI. QTL genome scans were performed by regression on the day 12 weight change on genotype probabilities for each of the eight founder strains using R (see Supplemental Material for executable code). A random-effect term was included in the model to account for kinship among animals. A LOD score for each marker was calculated from the likelihood ratio comparing the regression model described above to a regression model without the founder genotype probabilities. The statistical significance of LOD scores was determined via a permutation test. A threshold of
p,0.05 was used to select significant associations.
DOQTL genotype probabilityfiles were generated with each animal having a unique genome probability entry. In this way, even animals from the same RIX would have individual (albeit identical) genome probability entries. This approach allowed us to assess both within- as well as between-strain phenotypic differences.
An adjustedp-value for each marker was not included because a permutation test was used to determine statistical significance of the LOD scores. The supplemental code provided contains hard coded significance thresholds to match the original analysis from thefigures. Since there is some randomness to the permutation test, the threshold may display slightly different values if repeated.
Identification of Oas1b allele status
We utilized haplotype probability reconstructions [based on a hidden Markov model, described in Iraqiet al.(2012) and Srivastavaet al.
(2017)] for each CC strain to identify which founder strain haplotype was present at theOas1blocus. Previous work (Grahamet al.2015) had confirmed thatOas1balleles from the CAST/Eij, PWK/PhJ, and WSB/ EiJ strains had read-through codons relative to the reference genome (Keaneet al.2011), and this read-through variant is associated with protection from WNV infection. F1s were identified asOas1bN/N if each parent had anOas1bhaplotype without the read-through variant (A/J, C57BL/6J, 129s1/SvImJ, NOD/ShILtJ, or NZO/HILtJ);Oas1bF/F if each parent had anOas1bhaplotype with the read-through variant (CAST/EiJ, PWK/PhJ, or WSB/EiJ); andOas1bheterozygous if only one parent had the read-through variant.
Oas1b sequence reconstruction
We integrated high confidence nonsynonymous SNPs from the Sanger mouse genomes project (www.sanger.ac.uk) (Iraqiet al.2012; Oreper
n Table 2 Table of F1s screened for transcriptomics analysis
Cross OASlb Status Phenotype Oaslb Origin Dam Sire
CC017·CC004 F/F Asymptomatic CAST/WSB Functional Functional
CC019·CC004 F/F Asymptomatic CAST/WSB Functional Functional
CC009·CC040 N/N Symptomatic N/A Null Null
CC006·CC007 N/N Symptomatic N/A Null Null
CC055·CC028 N/F Symptomatic PWK Null Functional
CC003·CC062 F/N Asymptomatic CAST/WSB Functional Null
CC030·CC061 F/N Asymptomatic CAST/WSB Functional Null
et al.2017; Srivastavaet al.2017) of the eight CC founder strains with the annotatedOas1bexon sequence (Figure S1).
Clinical scoring: CC F1s and their disease definitions
The clinical scoring system used to evaluate WNV-infected mice was as follows: 0, healthy mouse (baseline); 1, ruffled fur, lethargy, hunched posture, no paresis, and normal gait; 2, altered gait and limited move-ment in one hind limb; 3, lack of movemove-ment and paresis in one or both hind limbs; and 4, moribund.
RNA extraction and quantitative PCR (qPCR) of WNV
Spleen and brain tissue were removed from mock- or WNV-infected mice. Half of the brain was homogenized immediately after harvest in 1· PBS at 5500 RPM for 20 sec using a Precellys 24 machine and then centrifuged. Brain supernatant was added to TRI reagent (Ambion). Spleen tissues were stored in RNAlater (Ambion) and later homoge-nized in TRI reagent (Ambion). Total RNA was extracted using the Ribopure RNA Purification Kit (Ambion), with the addition of bromo-chloropropane (Acros Organics). RNA was converted to cDNA using the iScript Select cDNA Synthesis Kit (Bio-Rad). Using SYBR Green (Applied Biosystems) RT-PCR, WNV was quantified relative to GAPDH by probing cDNA with WNV-specific probes. qPCR results were recorded as fold change over mock-infected mice using the R statistical programming language (version 3.1). Results were loaded into Spotfire (http://spotfire.tibco.com, version 7.5.0.86) to produce box plots. Relative quantification was performed for WNV detection through qPCR. The forward and reverse primer used were: Primer WNV 1160F, 59-TCA GCG ATC TCT CCA CCA AAG-39and Primer WNV 1229R, 59-GGG TCA GCA CGT TTG TCA TTG-39.
Correlation matrix
Phenotypic results (clinical score, weight loss, and qPCR in spleen and brain) were loaded into R. Phenotypes were averaged by their genetic background (F1), tissue type, and time point. The Pearson correlation function (cor) was performed using R’s stats package and scores were displayed using the ggplot2 bioconductor package. For a complete listing of package information, data, and commands, please refer to the data reproducibility document in Github under correlation analysis.
Determining outcome: symptomatic and asymptomatic
To quantify disease outcome, we used weight loss and clinical scoring to segregate the F1s into two broad pathogenic phenotype categories: asymptomatic or symptomatic. Three animals were assessed for each F1 and outcome was based on at least one mouse out of three meeting weight loss or clinical score criteria at any time point. Symptomatic were defined as having weight loss.10% of original preinfection weight, clinical score.1, and/or death, whereas asymptomatic was defined as having weight loss,10% of original preinfection weight, clinical score of 0 or 1, and no death.
Affymetrix target preparation and microarray hybridization
RNA spleen samples were prepared for whole-transcriptome expres-sion analysis using the WT PLUS Reagent Kit following the man-ufacturer’s recommended protocol (Affymetrix, Inc.). Next, 100 ng total RNA was used to prepare the hybridization-ready targets. In-dividual sense-strand DNA targets were randomized and hybridized to Mouse Gene 2.1 ST 96-Array Plates (Affymetrix, Inc.) using the GeneTitan Multi-Channel Instrument for hybridization, staining, and washing of arrays, as well as for scanning. Quality control (QC) metrics for hybridization, labeling and sample quality were generated using the Affymetrix Expression Console (version 1.3.187) software. All samples passed QC criteria.
CC-probe masking
To ensure that all Affymetrix probes were identified across all CC lines, previously described masking techniques were applied based on the CC founder data (Grahamet al.2016; Rasmussenet al.2014). To mask out inconsistent Affymetrix probes, we used the oligomask R package designed for CC mouse data (Bottomlyet al.2014). Oligomask uses VCFfiles and the oligo package tofilter probes prior to normalization and statistical analysis.
Transcriptomic analysis
Samples were screened for QC and outlier detection using the Affymetrix expression console using boxplots, as well as multi-dimensional scaling analysis and interarray correlation plots using the R statistical
Figure 1 Analysis workflow. The analysis steps for
programming language (https://www.r-project.org, version 3.1), Bio-conductor (version 2.13), and packages oligo (1.32.0), oligomask (https://github.com/dbottomly/oligoMask), limma (3.28.4), and corre-sponding dependencies. Background correction, normalization, probe masking, and probe summarization were performed with RMA (Ro-bust Multichip Average) within the oligomask package. The sva pack-age (3.20) in R was used to correct for plate batch effects. Differential expression (DE) analysis was performed using the limma bioconductor package (see statistical analysis under supplemental wiki in Github). A statistical cutoff of.1.5-fold change over mock with a Benjamini– Hochberg-adjustedp-value,0.05 was applied. The union of all DE genes for at least one time point in at least one F1 wasfirst obtained and thenfiltered for immune genes. Immune genes were selected as genes identified in immune-related canonical pathways from Inge-nuity pathway analysis (IPA). This list of immune-related genes was used for the global heatmap (Figure 4). The ABC (ATP binding cassette) and oxysterol-binding proteins were added to the screen to observe their correlation with other knownOas1bbinding part-ners (Courtney et al. 2012). The heatmap was created using the heatmap.2 function in gplots (3.0.1) in R and bioconductor. A data report containing executable code can be found in Github under transcriptional analysis. Data were deposited in the GEO repository (access number GSE91003).
Mock correlation
Due to infection and sample collection scheduling, most mock samples were collected at either 2 or 12 d postinfection per F1. To ensure that this had no impact on normalized transcriptional activity, probe-masked expression data were compared in mocks for two separate F1s, CC (041x012)F1 and CC(004x011)F1, at days 12 and 28 postmock-infection (data not shown). Pearson correlation in R gave scores (0.9688 and 0.9687) that confirmed high correlation in the expression between mocks of the same F1s at different time points.
Coexpression heatmap
Coexpression was performed only on genes that were determined to be statistically significant from the differential expression analysis (thresh-old: log2 fold change$0.58 and FDR#0.05) in at least one compar-ison and considered immune-related (see transcriptional analysis). Pearson correlations were run on the union of log2FC using the WGCNA and heatmap.2 bioconductor packages in R (Loraineet al.
2015; Gentlemanet al.2004; Smyth 2004)
Pathway and regulator analysis
A list of statistically significant, differentially expressed genes (threshold of significance of a.1.5-fold change over mock with a Benjamini– Hochberg-adjustedp-value#0.05) were uploaded into IPA for core analysis to identify enrichment of biological pathways. The tools pro-duce a list of known biological functions with an enrichment score (2logp-value) determining how significant those genes are to each function, and an activationz-score that tells the proposed activation of that pathway (activated or inhibited).
The z-score is based on knowledge of expression changes (and functions) in the Ingenuity knowledge base (Krämeret al.2014). After the core analysis was performed in IPA, it was exported into Spotfire (version 7.5.0.86). Plots were created conservatively based on the fol-lowing criteria: each biological pathway needed a2logp-value$1.30 (corresponds top-value#0.05), two or more genes in each pathway, and had to produce an activation z-score. For the regulator effects network, the F/F, CC(019x002)F1 was analyzed for expression changes
at 2 d postinfection and the top scoring network (antiviral response, 63% known regulators) was observed. Network generation was per-formed within IPA.
Innate immune networks
Genes detected in linear modeling and correlation analyses were loaded into IPA and networks were selected based on enrichment for immune-related pathways. The F/F network was based on the top two highest scoring networks (immunological disease and inflammatory response with network scores 36 and 33). The F/N network was based on immune and inflammatory functions (network score 35). The N/N network was built on functions in cell-to-cell signaling (network score 27). Protein– protein interactions from the Ingenuity knowledge base were used to connect ABCF3 and ORPL1 with the transcriptional data. This was done using the network build and connect tools in IPA. Network data were then exported into cytoscape (version 3.1.1) to make custom networkfigures.
Data availability
A complete description of the data and methods can be found on the manuscript’s Github page (https://github.com/greener98103/oas1b/ wiki) and in the supplementalfile titled“Green_Oas1b_data_policy_ documentation.”Thisfile includes information on strains/lines, var-iantfiles from Sanger, and markerfiles [MUGA platform (Morgan
et al.2015)]. The data document also contains detailed descriptions, file locations, and links to executable code for QTL, transcriptional, and correlation analyses. Gene expression data are in GEO with the accession number GSE91003. The authors state that all data necessary for confirming the conclusions presented in the article are repre-sented fully within the article.
RESULTS
A QTL identified in chromosome 5 found in day 12 weight loss
We conducted QTL mapping across our panel of 90 F1s (Table 1), and identified an approximate 2.5 Mb region spanning from 120–122.5 Mb on chromosome 5 (here termed the host response to WNV, region 1, or
Hrw1) (Figure 1A). HrW1 impacted day 12 weight loss (Figure 2, A and C). The Hrw1aggregate peak contained 70 genes and microRNAs (excluding predicted genes). The genes under this locus include all the murineOasgenes as well as genes associated with biological path-ways including actin cytoskeleton signaling, CD28 signaling in T helper cells, and integrin signaling (Table S1andTable S2). The QTL peak sits over Oas1b. Based on previous mouse studies (Suthar et al. 2013; Mashimo et al. 2002; Fergusonet al. 2008; Kajaste-Rudnitskiet al.
2006),Oas1bis a known driver of disease phenotypes. To determine which of the eight strains in the CC were influencing the loci, we next looked at the founder effects driving this QTL.
Loci founder effects
Figure 2 WNV QTL. (A) Genome scan of 90 F1s from day 12 weight loss with a significant QTL peak on chromosome 5. The top row indicates
the Sanger mouse genomes project (Keaneet al.2011), which show that classical strains have an early stop codon, whereas wild-derived foun-ders encode a fully functional protein. These different founder
contri-butions yield a range of complex phenotypes seen in the F1s. Previous CC studies showed that F1s heterozygous forOas1bdid not guarantee protection (Grahamet al.2016) and there were likely other immune
Figure 2 Continued.
factors beyondOas1bdriving WNV infection outcome. To get a global view of WNV pathogenesis in the CC, we studied disease responses by haplotype.
Contribution of Oas1b in preventing viral growth and neuroinvasion
Guided by the observed allele effects, and the presence of the truncated stop codon inOas1b, we binned our F1s into four classes: F/F (any F1 containing CAST/EiJ, PWK/PhJ, and/or WSB/EiJ alleles), N/N (any F1 containing A/J, C57BL/6J, 129S1/SvImJ, NOD/ShiLtJ, and/or NZO/ HILtJ), and the two reciprocal heterozygous classes F/N (a maternally inherited functional allele and a paternally inherited defective allele) and N/F (a maternally inherited defective allele and a paternally inherited functional allele). We measured a variety of WNV disease response phenotypes and assessed their differences between these classes. F/F and heterozygous F1s displayed similarfluctuations in weight at day 12 postinfection (Figure 2C) compared to N/N F1s. Of the heterozygous F1s, N/F showed a slightly higher distribution in weight at day 12 compared to F/N haplotype mice. Clinical scores were also evaluated at day 12 (Figure 2D). Clinical score was calcu-lated by animal’s appearance and physical function characteristics (ruffled fur, lethargy, hunched posture, and no paresis) and move-ment (seeMaterials and Methods). The only mice that developed overt clinical scores associated with WNV disease were from the N/NOas1bF1s.
WNV is a neuroinvasive virus thatfirst replicates in the spleen and then progresses to the central nervous system in a manner controlled by the innate immune response (Sutharet al.2013; Elbaheshet al.2011). To assess viral growth and neuroinvasion, we measured the levels of WNV virus in the spleen and brain using qPCR. An inability to effec-tively control WNV growth in the periphery (such as the spleen) facil-itates viral production and neuroinvasion (Sutharet al.2013; Green
et al.2016a; Fredericksen 2014). qPCR results showed that F1s without functioningOas1balleles displayed an increased viral load in the spleen at day 4 (Figure 2E). By day 7, this lack of viral control resulted in WNV neuroinvasion characterized by virus in the brain (Figure 2F). There were lower levels of virus in heterozygous F1s in both the spleen at day 4 and in the brain by day 7. The accumulation of virus in N/N was statistically significant in the brain compared to heterozygous F1s (p-value = 0.0005) across all time points (2, 4, 7, and 12 d postinfec-tion). Viral accumulation was not statistically significant in the spleen, but we observed a correlation between viral qPCR and clinical score in the N/N and heterozygous F1s (seeFigure S2and Github).
Distribution of infection response
From the 90 F1s used for QTL mapping based on weight loss, we evaluated 83 F1s because they had clinical metrics of susceptibility to WNV infection. Responses of each line were captured and an outcome was determined as asymptomatic or symptomatic. For a line to be considered symptomatic, infected animals had to exhibit a clinical
Figure 3 Disease outcome under Oas1bfunctionality. The number of F1s summarized by disease outcome. Outcome was determined as
score.1 or a.10% loss in weight since the time of infection (see
Materials and Methods). We evaluated infection outcome based on haplotype (Figure 3). Out of the 83 F1s screened, 47 of them (56%) were symptomatic and did not contain full-lengthOas1balleles. Only five F1s lines were asymptomatic with F/F alleles (6%), and zero lines with F/F alleles were symptomatic. Likewise, no F1s with N/N alleles were determined to be asymptomatic. F/FOas1balleles provided com-plete protection against WNV clinical disease. Of the asymptomatic heterozygous F1s, (F/N and N/F), 16 were F/N (19%) compared to 14 N/F (17%). We only observed four symptomatic N/F F1s (5%) compared to one asymptomatic F/N F1 (1%). We also observed a re-lationship between viral load and disease phenotypes (seeFigure S2).
To identify differences between the heterozygous lines, we looked at allelic contributions among the eight founder strains. There was a subtle difference in disease outcome among the heterozygous lines but this was likely driven by lines containing anOas1ballele from the WSB/EiJ or CAST/EiJ founder strains. F1s that contained theOas1ballele from the PWK/PhJ founder strain appeared to only provide moderate protection compared to either the WSB/EiJ or CAST/EiJ alleles (seeMaterials and Methods). These observations support previous studies implying a ma-jor role forOas1bin protection against WNV disease in mice, although this is thefirst time a comparison has been made between heterozygous F1s and theirOas1b’s founder effects.
To reveal innate immune signatures driving WNV susceptibility, we performed a multi-tier bioinformatics analysis (see Figure 1) involving genome-wide microarray analysis on a set of F1s with differentOas1b
haplotypes (F/F, F/N, N/F, and N/N), focusing on revealing the profile of immune-related genes in the spleen at days 2, 4, 7, and 12 post-WNV infection as compared to mock-infected congenic control mice (Table 2). We centered our transcriptional profiling assessment on the spleen to better understand peripheral immune programming and possible link-age with the control of viral neuroinvasion.
Coregulatory patterns between Oas1b haplotypes
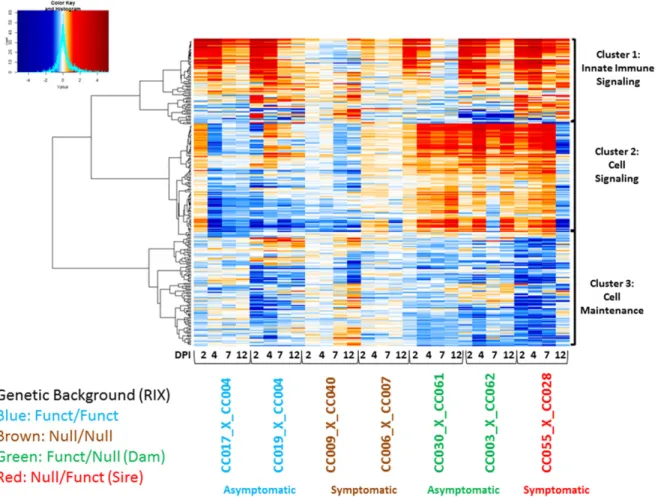
We performed a transcriptional correlation analysis using the union of statistically significant genes across F1s with different haplotypes (Figure 4). Since the genetic backgrounds among F1s vary and those withoutOas1bproduced a large amount of differentially expressed genes (especially in later time points due to increased illness), we focused on statistically significant immune-related genes. Correla-tion analysis identified three distinct gene clusters. Functional anal-ysis was performed to summarize the clusters into known biological functions. Genes within cluster 1 are largely involved in innate immunity, genes within cluster 2 include those involved in cellular signaling, and cluster 3 genes include a role in cell maintenance (Figure 4).
Figure 4 Heatmap of immune disease modules. Coexpression in spleen at days 2, 4, 7, and 12 postinfection. The heatmap represents differential
Genes in cluster 1 (innate immune signaling) include several molecules involved in RLR signaling, IFN responses, and death receptor signaling. The coregulated gene module contained ISGs,
Myd88,Oas2,Oas3,Stat2, andTlr7. Cluster 1 was also enriched for IFN regulatory factors (Irf3,Irf7, andIrf9). Expression of genes in this cluster appeared to be activated across all F1s, although not all met statistical significance. Within the F/F F1s, activation of this cluster was highly induced only until day 4. This profile is different from the heterozygous F1s, especially the symptomatic N/F F1 CC (055x028)F1, which remained induced through day 12. The Oas
genes also appear in cluster 1. These heatmap and qPCR results display an early termination of innate immune signaling in the asymptomatic lines that could be influencing disease outcome. Ex-pression changes in the second cluster (cell signaling) are primarily influenced by the three heterozygous F1s. The genes in this module are associated with the cell cycle, DNA replication, DNA repair, growth, and proliferation. This cluster/gene module showed little variation across heterozygous F1s and was sparsely suppressed in the F/F F1s. Expression was inverted at day 12 between the asymp-tomatic and sympasymp-tomatic F1s (F/N and N/F, see Table 2), suggesting that this subcluster links with viral infection and differential WNV disease.
The expression changes found in CC(055x028)F1 between days 7 and 12 postinfection correspond with viral load. At day 12 post-infection, we found an increase in viral load in the brain as measured by qPCR (Figure S6). The gene expression changes between days 7 and 12 postinfection could mark viral spread and subsequent neuroinvasion.
The coexpressed genes found in the third cluster (cell maintenance) are involved in cell/tissue morphology and leukocyte extravasation (diape-desis). Genes in this biological pathway are suppressed in expression relative to mock-infected controls, implying that leukocyte migration is less active during infection in CC(009x040)F1 (N/N) and CC(055x028)F1 (F/N). Inhibition of leukocyte migration (and supporting chemokines) to infection sites could destabilize protection against WNV in these F1s.
To validate select innate immune gene expression, we performed qPCR on two virus-inducible genes: tetratricopeptide repeats 1 (Ifit1) and IFNb(Ifnb1) using the F1s shown in our heatmap and in Table 2.
Ifit1andIfnb1are IRF3 target genes induced upon WNV infection;
Ifit1is also an ISG and is highly expressed in response to type 1 or type 3 IFNs. Not surprisingly,Ifit1induction was highest at day 2 postinfec-tion, indicative of IRF3 activation and the onset of IFN signaling ( Fig-ure S3andFigure S4). All F1s appeared elevated forIfit1but it was highest in F/F CC(019x004)F1. Ifit1decreased by day 4 post-WNV infection, indicating that viral replication was being controlled. The
Figure 5 Heatmap of QTL genes. Coexpression in spleen at days 2, 4, 7, and 12 postinfection. The heatmap represents differential expression of
Ifit1elevation in N/N F1s at day 2 post-WNV infection indicated in-duction of IFN proin-duction.Ifnb1appeared low across most of the F1s in the spleen except the one N/N F1 at day 2 post-WNV infection. This IFN response was also seen in the brain in the N/N along with virus at day 7 and suggests that the F/F F1 was protective from the neuro-invasion (Figure S4). In summary, the gene expression profile of both
F/F and N/NOas1bhaplotypes revealed expressed IFN signaling at day 2, but this alone did not link with protection in the N/N line.
Transcriptional analysis of genes within the Hrw1 locus
To determine if expression differences in theOasfamily members and other genes within theHrw1locus on chromosome 5 (Figure 5) linked
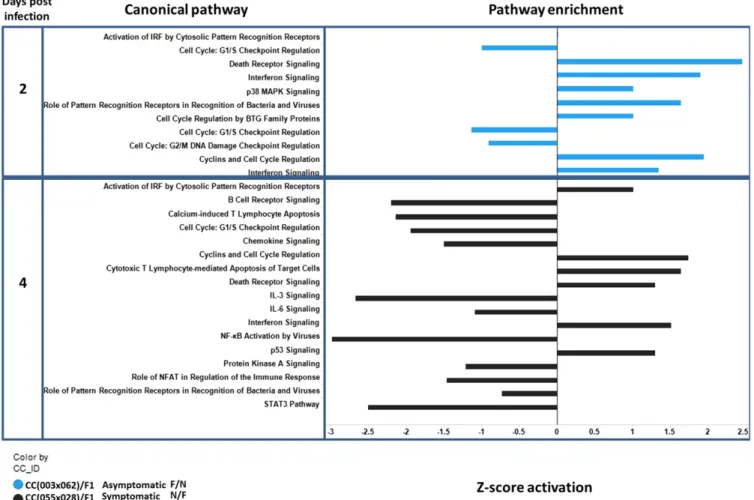
Figure 7 Pathway analysis in the presence (F/F, Functional + Functional Oas1b) and absence (N/N, Non-functional + Non-functional Oas1b) of
functioningOas1b. A bar plot quantifying enrichment of biological pathways across F1s and time points (2, 4, and 7 days) postinfection. They-axis indicates time point and biological pathway. Thex-axis shows the activationz-score for a pathway. Thez-score is based on literaturefindings and determines the magnitude of gene regulation for a pathway. Values to the left indicate that pathway is inhibited and values to the right indicate that pathway is activated. The colors in the bar plot mark the different F1 backgrounds [blue = CC(009x040)F1 and red = CC(006x007)F1].
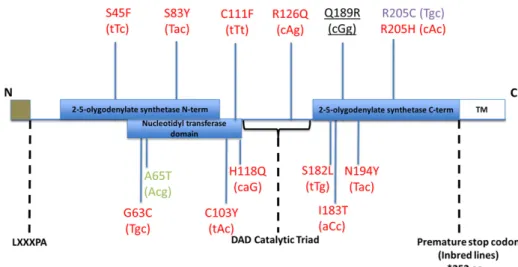
Figure 6Oas1bprotein. SNPs that impact
with WNV infection outcome, we applied a targeted transcriptional analysis within the locus. The genes thatflank theOascluster (Dtx1and
Rph3a) were identified as expressed compared to mock-infection in our heatmap. There are several genes whose expression was reduced (downregulated) independently ofOassignatures in the heterozygous F1s. Interestingly,Rasal1appeared downregulated in CC(055x028)F1, which was previously observed with elevated viral load in the spleen and brain (Scherbiket al.2006), and thisfinding was confirmed with qPCR in the spleen at day 4 postinfection (seeMaterials and Methods).
Rasal1is an inhibitory regulator of the Ras-cyclic AMP pathway and is involved in dendrite formation (observed in melanocytes), intercellular signal transduction, and GTPase activity, and could be implicated in WNV disease. We also evaluated the expression of otherOas gene family members and found that the F1s with the largest induction of
Oasgenes were CC(017x004)F1 (F/F), CC(019x004)F1 (F/F), and CC(055x028)F1 (N/N).Oas1bis included in Figure 5 and was in-duced by WNV infection to be differentially regulated compared to mock, but was not always statistically different across infection time points after multiple statistical comparisons.Oasl1(Oas-like gene 1),
Oas3, andOas1awere the most highly induced (upregulated)Oas
gene family members across the panel.Oas1aandOas1g, which are influential in viral detection and the innate immune response, were the next highest in expression.Oasl1has been shown to regulate IRF7 production (Leeet al.2013).Oas3was found upregulated in
each F1 we screened using qPCR and transcriptomics in at least one time point except for N/N CC(090x040)F1, which had low gene expression levels. The importance ofOas3in virus response is cor-roborated by a previous study that found that OAS3 displayed a higher affinity for dsRNA than OAS1 or OAS2, which indicated its contributive role in the antiviral response (Li et al.2016). Im-portantly, none of the significant Oas genes were suppressed or “downregulated”in our analyses. We validated ourfindings with qPCR inOastarget genesOas1g,Oas2, andOas3. Thus, our analysis ofOasgene family members is supportive ofOasgenes playing a significant role in antiviral immunity.
Oas1b haplotype distinguishes gene expression modules
We conducted pathway analysis to assess the biological differences of significant genes in F1s of differentialOas1bhaplotype. As shown in Figure 6, the Sanger sequencing revealed several polymorphisms within functional domains of the full-length Oas1b protein among alleles encoded in the PWK/PhJ, WSB/EiJ, and CAST/EiJ outbred parental CC strains compared to the C57BL6/J reference strain, while all of the classical inbred founder strains encoded a stop codon within the OAS1b C-terminal domain. We first focused on the presence and absence of full-lengthOas1bto reveal differences in gene module ex-pression between the two groups.
Figure 8 Pathway analysis in the heterozygousOas1bF1s at day 2 and 4 post-WNV infection. A bar plot similar to day 4 showing enriched
The immune response at day 2 postinfection (Figure 7) was impacted byOas1bstatus. Immune pathways in F/F F1s were pre-dominantly activated between days 2 and 4 postinfection. Aside from low level viral recognition, the N/N CC(006x007)F1 did not show significant activation in immune pathways until day 4 post-infection. By day 4 postinfection, several pathways were expressed in parallel, including pathways involving death receptor signaling, IFN response, toll like receptors, and viral recognition receptors, thus, marking the onset of the innate immune response. In contrast, STAT3 signaling was downregulated by day 4 postinfection in the F/F asymptomatic F1s, reflecting differential STAT3 signaling activity between the two groups. By day 7 postinfection, the N/N F1 profile marked a reduced transcriptional response within innate immune signaling pathways including NF-kb, and pattern recognition recep-tor signaling, possibly reflecting the progression of WNV infection out of the spleen onward to the CNS.
To assess gene expression pathways amongOas1bheterozygous F1s, we concentrated on the day 2 and 4 postinfection time points (Figure 8). These pathway analyses compared the downstream effects ofOas1b
between symptomatic CC(055x028)F1, whoseOas1ballele is derived from PWK/PhJ,vs.asymptomatic F/N CC(003x062)F1, whoseOas1bis from WSB/EiJ. We observed differences in G1/S checkpoint cell cycle pathways between CC(055x028)F1 and CC(003x062)F1. The pathway was downregulated in the asymptomatic line, but had very weak
in-duction in the symptomatic line, possibly marking differential pathol-ogy among the lines. At day 2 postinfection, N/F CC(055x028)F1 had reduced expression of p53 signaling wherein the other heterozygous lines showed differential p53 module expression and cell signaling re-sponse modules at day 4 post-WNV infection. We observed more extensive gene module regulation in the Oas1b heterozygous mice overall.
Innate immune regulatory networks
Based on correlation and functional analysis, we proceeded to construct novel innate immune regulatory networks to discern the unique host response associated withOas1ballelic differences. Using transcriptional data from F1s of differentOas1bhaplotypes, we identified three im-mune regulatory networks during WNV infection. Figure 9 represents theOas1ballele from both parents (F/F), Figure 10 shows the network fromOas1bheterozygous (F/N), and Figure 11 shows the network from
Oas1bhomozygous nonfunctioning (N/N) mice. The F/F innate (day 2 postinfection) immune network (Figure 9) is comprised ofIrf3,Irf7,
Stat1,STAT2,Myc, and the poly(ADP-ribose) polymerase family of proteins (PARP) response networks, and includes theOasgene cluster.
Irfs andStats were the major hubs launching virus-responsive genes and ISG networks, along with the induction of theOaspathway. IRF3/7 also connects with several pattern recognition receptors including
DDX58 (the RLRs), IFIH1, and DDX60. PARP genes contribute to
Figure 9 Innate immune regulation network [Oas1ballele (F/F)]. Innate immune regulatory network identified in F1s with F/FOas1balleles. Each
death receptor signaling and apoptosis whileMx1/Mx2are ISGs in-volved in antiviral innate immunity against several viruses (Shaffer
et al. 2001). Antigen presentation is clearly activated, as indicated through network connections among the MHC class I family of genes. ABCF3 is connected by MYC (myelocytomatosis) and performs vari-ous roles in the cell, and has been identified as anOas1b-binding pro-tein of WNV control (Courtneyet al. 2012). IFIT1B and SNRPD3
(small nuclear ribonucleoprotein) connect toORP1L, anotherOas1b -binding protein. Thus, network analysis of F/F Oas1bmice reveals innate immune and antigen processing induction, OAS protein expres-sion, and network interaction of knownOas1b-binding proteins in response to WNV associated with homozygous full-lengthOas1b
genotype.
The innate (day 2 postinfection) heterozygous network (F/N) in Figure 10 shared genetic signatures with F/F and includedSTAT3as one of the network hubs. Additional hubs includedEED(embryonic ectoderm development),MYC, andPOU5F1(POU class 5 homeo box 1), major cell signaling pathways (Neriet al.2012; Shaw and Martin 2009). Along withSTAT3, the heterozygous network also connects the OAS pathway genes (1–3 includingOas1b). Unique to this network is the incorporation of DAXX (death domain associated protein) and
Mov10(RISC complex RNA helicase).DAXXis involved in death re-ceptor signaling and targets infected cells for apoptosis (Engelhardt
et al.2001; Liet al.2000; Perlmanet al.2001).Mov10is an IFN-inducible gene recently shown to have antiviral activity against RNA viruses like Sendai and VSV, but not seen before in WNV. This network again supports previous work (Courtneyet al.2012) where ABC proteins are binding partners toOas1b, as noted above. In our network, we also identified connections with ABCF1 and ABCF2.
The N/N network, derived from later time points (days 7 and 12 postinfection), are involved in cell-to-cell signaling interactions and RNA post-translational modifications. There are several connector hubs in this network driven by genesPLCG1, GRB2, andFYN.PLCG1is involved in CD28 signaling in T helper cells and apoptosis. GRB2 is a growth factor receptor signaling-adaptor protein and is involved in a variety of cell signaling programs (Jang et al. 2009). Interestingly, ABCF3 is connected to GRPB2 through protein interactions with HIRIP3 (HIRA-interacting protein 3) and CSNK2A2 (casein kinase 2a2). It is believed that HIRIP3 functions as part of a multi-protein complex with roles in chromatin and histone metabolism. CSNK2A2 is a kinase, and has roles in apoptosis and G2/M phase cell cycling. ORP1L is connected to GRB2 through interactions with growth factor KITLG (Kit ligand). KITLG has several cellular roles including differ-entiation and apoptosis. The N/N network shares a STAT3 hub with the F/N network but its interaction partner is the FYN proto-oncogene (Src family tyrosine kinase family), which is involved in ATP binding as well as CD4 and CD8 receptor binding. Toll-like receptor 4 (TLR4), a well-documented immune signaling receptor, is downregulated. Taken together, these results linkOas1bhaplotype with differential gene net-works and WNV infection outcome.
Identifying regulatory factors in host innate immune signaling
Our results show that F1s containing functionalOas1balleles from both parents do not succumb to WNV infection. To determine the regula-tors of transcriptional responses in theseOas1bF/F F1s, we performed a predicted regulator analysis to localize target genes and find addi-tional transcripaddi-tional regulators necessary for protection. Our regulator
Figure 10 Innate immune regulation network [Oas1ballele (F/N)]. Innate immune regulatory network identified in F1s with F/NOas1balleles.
network (Figure 12) revealed that gene expression upregulation oc-curred predominantly in ISGs at day 2 postinfection. The network analysis determined activation of four transcriptional regulators (IRF3, IRF5, IRF7, and NCOA2). Three of these—IRF3, IRF5, and NCOA2—have been functionally linked to innate immune regulation or WNV infection in previous studies (Lazearet al.2013; Flammeret al.
2010). The regulators and their candidate genes shared two distinct operations: antiviral response and inhibition of viral replication.
Among the target genes in the network wereOasmembers,Mx1, and various chemokines. Additionally, BAK1 (BCL antagonist/killer 1) and ZBP1 (Z-DNA binding protein 1) are present in the network and play roles in cell cycle regulation and proapoptotic activity; each are putative IRF-target genes. FCGR1A FCgreceptor is also linked to this network and is known to function in antigen presentation and removal of in-fected cells via apoptosis. NCOA2 is anOas1bF/F network gene and is a transcriptional coregulatory protein with multiple nuclear interacting domains allowing DNA to become more accessible for transcription.
Oas1and 2 expression is in part mediated by IRFs and NCOA2; studies using mouse bone-derived macrophages lacking NCOA2 expression showed a decrease in ISG expression (Flammer et al. 2010). Thus,
WNV infection in the context of the F/FOas1bhaplotype engages specific IRF, IFN, and virus-responsive transcriptional networks that mediate protection from neuroinvasion and disease.
DISCUSSION
Infectious diseases cause a wide range of responses across genetically diverse populations. The use of genetically diverse MPP within the infectious disease community has been increasing with an effort to characterize (Iraqiet al.2012; Ferriset al.2013; Rasmussenet al.2014; Grahamet al.2015, 2016) and genetically define the range of disease responses under host genetic control during viral infections (Boonet al.
2009; Ferriset al.2013; Gralinskiet al.2015, 2017). Here, we confirmed a role for variants at theOas1blocus in driving major disease outcomes following WNV infection. By leveraging prior gene sequence informa-tion of the Oas1bgene, we subclassified our F1s into four diplotype classes at theOas1blocus. We found significant within-class variation in disease outcomes in these F1s, utilized transcriptional analysis to identify key host genes (and pathways) involved in allelic differences, and obtained a comprehensive view of the innate immune response associated withOas1bhaplotype variation.
Figure 11 Innate immune regulation network [Oas1ballele (N/N)]. Innate immune regulatory network identified in F1s with N/NOas1balleles.
Genetic variation impacts disease
TheOas1bgene has been shown (Bighamet al.2011; Courtneyet al.
2012) to play a major role in controlling WNV disease by limiting viral replication (Kajaste-Rudnitskiet al.2006) within the C3H mouse strain (Perelyginet al.2002). We identified a major-effect QTL over theOas1b
locus within a large population of F1s, and this QTL showed allele effects consistent with the previously described sequence variation withinOas1b. Importantly, this variant appears to segregate between wild-derived inbred strains and classical inbred strains derived from small population fancy mice (Yanget al.2011). While our study and previous ones cannot definitively answer the question of whether the mutation arose in natural populations or in laboratory mice, it high-lights the utility of assessing a broader range of genetic variants (both at targeted loci and genome-wide) in dissecting disease responses.
The presence of genes of major effect within genetic reference or other mapping populations can overshadow effects of other genetic variants cocirculating within these populations. As seen in our study and others (Ferris et al. 2013), it is possible to detect, transcriptionally characterize, and genetically map variants modifying disease responses in the presence of a major gene. As many pathogens and other diseases are impacted by large-effect genes (Ferris and Heise 2014), care in the design of experiments and their resultant analysis within the context of reference populations must be given. As we have shown here, studies further characterizing between-class responses at a molecular level can
improve insight into disease mechanisms. Alternatively, studies such as F2 crosses or molecular investigations of strains within an allele class can identify specific variants modifying disease and will help to expand our knowledge of naturally polymorphic networks driving aberrant disease responses.
Oas1b has been shown to act independently from the RNase L pathway to mediate protection against WNV infection. OAS1b lacks OAS activity, and hence does not produce 2-5A that otherwise binds and activates RNaseL (Brinton and Perelygin 2003; Perelygin et al.
2002). In addition to ABC and ORP1L protein binding by OAS1b, our network analysis also observed additional factors implicated in
Oashaplotype control of WNV infection includingDAXX(mediated apoptosis),Mov10(antiviral),GRB2(cell signaling and leukocyte mi-gration), andTrafd1.Trafd1has not previously been associated with theOasfamily but appears within our QTL heatmap (Figure 5).Trafd1
is an immune regulator known to be activated by STAT1 in mouse bone-derived macrophages (Mashimaet al.2005), and possibly con-tributes to innate immune protection mediated by this Oas1b network. Evolutionary studies have observed that there is a balancing selection occurring at the Oas1gene locus across the human and nonhuman primate species. The allelic drift between primates produced variations in amino acids associated with RNA binding and this contributed to the susceptibility toflaviviruses (Fergusonet al.2008). By performing a large genome scan across our diverse mouse backgrounds, we
Figure 12 Infection regulator network F/F. A regulatory network generated from differentially expressed genes in CC(019x004)F1 at day
confirmed a QTL (containing theOasgenes and others) correlated with WNV infection. We chose here to observe the transcriptional differ-ences influenced byOas1busing the CC and allelic effects to determine the differential outcome (Figure S1). Our transcriptional analysis showed that there is still considerable strain-specific variation within the F1 backgrounds with functionalOas1b. While true disentangling of the relationship between genetic variants within these transcriptional networks andOas1ballelic variants (e.g., via genome editingOas1bloci within CC strains) is beyond the scope of this study, our results strongly suggest that the anti-WNV effect ofOas1bleads to differ-ential activation of molecular programs. Further work to under-stand these programs, the role of genetic variants within its members, and the causal role ofOas1b, will help to elucidate the mechanisms of WNV disease and point to potential therapeutic responses to this disease.
We observed for thefirst time the role of parental effects ofOas1band their differential host transcriptomics. Among the heterozygous F1s, we noted a slightly higher survival rate in F1s whereOas1bwas functional in the mother (F/N). We also observed three immune regulatory net-works influenced by WNV infection and theOas1bhaplotype. Our analysis found a surprising relationship with cell cycle checkpoint sig-naling, diapedesis, andOas1bhaplotype. We found that theMov10
gene was included in this network of gene activation in F1s with het-erozygous F/N alleles. Interestingly,Mov10has been shown previously to function in an IRF3-dependent manner independent of the RIG-I pathway (Cuevaset al.2016), implicating possible RIG-I-independent signaling within theOas1bnetwork to drive gene expression within this module.
We were also able to assemble an innate immune network linking functionalOas1bto proteins including IRFs, specific ISGs, ubiquitin protein ligases, and PARP genes. The F/F and some F/N F1s displayed earlier viral recognition, which appeared in transcriptional pathway analysis and qPCR throughIfit1andIfnb1expression. In symptomatic F1s lacking functional Oas1b(N/N), transcriptomics profiling indi-cated a lack of innate immune induction and cell migration that in-cluded monocyte migration and macrophage development. These observations indicate that, without activation of key processes such as innate immune signaling, diapedesis, and IFN responses, the host is unable to develop a strong defense and thus succumbs to infection in a manner linked to loss ofOas1bfunction. For example, the symptomatic N/F CC(055x028)F1 was unable to control viral replication in the spleen and developed neuroinvasive infection by day 12 (Figure S4). Lastly, our regulatory network (Figure 12) identified nuclear receptor coactivator 2 (NCOA2) as a novel transcriptional regulator producing an antiviral effect linked withOas1b.
Understanding why some people are susceptible to viral infection while others are resistant is both a genetics and a genomics challenge that can be studied through genetics reference populations and infection models like the CC. Our study identifies new features of gene regulation linked with differentialOas1bgenotypes within varied genetic back-grounds. This work also affirms the CC as a valuable tool for revealing the genetics of immune regulation and WNV control. CC mouse pop-ulation is therefore an optimal model of virus infection amenable to defining genetic traits of disease outcome.
ACKNOWLEDGMENTS
Thanks to Amy Green for proofreading, and to Darla Miller and Ginger Shaw for their support with mouse resources. Supported by National Institutes of Health grants U19AI100625, R01AI104002, and U19AI083019. The funders had no role in the design, data acquisition, analysis, or preparation of the manuscript.
LITERATURE CITED
Bigham, A. W., K. J. Buckingham, S. Husain, M. J. Emond, K. M. Bofferding
et al., 2011 Host genetic risk factors for West Nile virus infection and disease progression. PLoS One 6(9): e24745.
Boon, A. C., J. deBeauchamp, A. Hollmann, J. Luke, M. Kotbet al., 2009 Host genetic variation affects resistance to infection with a highly pathogenic H5N1 influenza A virus in mice. J. Virol. 83(20): 10417– 10426.
Bottomly, D., B. Wilmot, and S. K. McWeeney 2014 Oligomask: a frame-work for assessing and removing the effect of genetic variants on mi-croarray probes. R J. 6(1): 159–163.
Brinton, M. A., and A. A. Perelygin, 2003 Genetic resistance toflaviviruses. Adv. Virus Res. 60: 43–85.
Cartmell, T., S. Poole, A. V. Turnbull, N. J. Rothwell, and G. N. Luheshi, 2000 Circulating interleukin-6 mediates the febrile response to localised inflammation in rats. J. Physiol. 526(Pt. 3): 653–661.
Choi, U. Y., J. S. Kang, Y. S. Hwang, and Y. J. Kim, 2015 Oligoadenylate synthase-like (OASL) proteins: dual functions and associations with diseases. Exp. Mol. Med. 47: e144.
Courtney, S. C., H. Di, B. M. Stockman, H. Liu, S. V. Scherbiket al., 2012 Identification of novel host cell binding partners ofOas1b, the protein conferring resistance toflavivirus-induced disease in mice. J. Virol. 86: 7953–7963.
Cuevas, R. A., A. Ghosh, C. Wallerath, V. Hornung, C. B. Coyneet al., 2016 MOV10 provides antiviral activity against RNA viruses by en-hancing RIG-I-MAVS-independent IFN induction. J. Immunol. 9: 3877– 3886.
Daffis, S., M. S. Suthar, M. Gale, Jr, and M. S. Diamond, 2009 Measure and countermeasure: type I IFN (IFN-alpha/beta) antiviral response against West Nile virus. J. Innate Immun. 5: 435–445.
Drappier, M., and T. Michiels, 2015 Inhibition of the OAS/RNase L path-way by viruses. Curr. Opin. Virol. 15: 19–26.
Elbahesh, H., B. K. Jha, R. H. Silverman, S. V. Scherbik, and M. A. Brinton, 2011 The Flvr-encoded murine oligoadenylate synthetase 1b (Oas1b) suppresses 2–5A synthesis in intact cells. Virology 409(2): 262–270.
Elkhateeb, E., H. T. Tag-El-Din-Hassan, N. Sasaki, D. Torigoe, M. Morimatsu
et al., 2016 The role of mouse 29,59-oligoadenylate synthetase 1 paral-ogs. Infect. Genet. Evol. 45: 393–401.
Engelhardt, O. G., E. Ullrich, G. Kochs, and O. Haller, 2001 Interferon induced antiviral Mx1 GTPase is associated with components of the SUMO-1 system and promyelocytic leukemia protein nuclear bodies. Exp. Cell Res. 271: 286–295.
Errett, J. S., M. S. Suthar, A. McMillan, M. S. Diamond, and M. Gale, Jr., 2013 The essential, nonredundant roles of RIG-I and MDA5 in de-tecting and controlling West Nile virus infection. J. Virol. 87(21): 11416– 11425.
Ferguson, W., S. Dvora, J. Gallo, A. Orth, and S. Boissinot, 2008 Long-term balancing selection at the west nile virus resistance gene,Oas1b, main-tains transspecific polymorphisms in the house mouse. Mol. Biol. Evol. 8: 1609–1618.
Ferris, M. T., and M. Heise, 2014 Quantitative genetics in the study of virus-induced disease. Adv. Virus Res. 88: 193–225.
Ferris, M. T., D. L. Aylor, D. Bottomly, A. C. Whitmore, L. D. Aicheret al., 2013 Modeling host genetic regulation of influenza pathogenesis in the collaborative cross. PLoS Pathog. 2: e1003196.
Flammer, J. R., J. Dobrovolna, M. A. Kennedy, Y. Chinenov, C. K. Glasset al., 2010 The type I interferon signaling pathway is a target for glucocor-ticoid inhibition. Mol. Cell. Biol. 19: 4564–4574.
Fredericksen, B. L., 2014 The neuroimmune response to West Nile virus. J. Neurovirol. 2: 113–121.
Gatti, D. M., K. L. Svenson, A. Shabalin, L. Y. Wu, W. Valdaret al., 2014 Quantitative trait locus mapping methods for diversity outbred mice. G3 4(9): 1623–1633.
Graham, J. B., S. Thomas, J. Swarts, A. A. McMillan, M. T. Ferriset al., 2015 Genetic diversity in the collaborative cross model recapitulates human West Nile virus disease outcomes. MBio 6(3): e00493–e00515. Graham, J. B., J. L. Swarts, C. Wilkins, S. Thomas, R. Greenet al., 2016 A mouse
model of chronic West Nile virus disease. PLoS Pathog. 12(11): e1005996. Gralinski, L. E., M. T. Ferris, D. L. Aylor, A. C. Whitmore, R. Greenet al.,
2015 Genome wide identification of SARS-CoV susceptibility loci using the collaborative cross. PLoS Genet. 11(10): e1005504.
Gralinski, L., V. Menachery, A. Morgan, A. Totura, A. Beallet al., 2017 Allelic variation in mouse Ticam2 contributes to SARS-CoV pathogenesis. G3 (Bethesda) 7: 1653–1663.
Green, R., C. Wilkins, S. Thomas, A. Sekine, R. C. Iretonet al., 2016a Identifying protective host gene expression signatures within the spleen during West Nile virus infection in the collaborative cross model. Genom. Data 10: 114–117. Green, R., C. Wilkins, S. Thomas, A. Sekine, R. C. Iretonet al., 2016b
Trans-criptional profiles of WNV neurovirulence in a genetically diverse collabo-rative cross population. Genom. Data 10: 137–140.
Iraqi, F.A., M. Mahajne, Y. Salaymah, H. Sandovski, H. Tayemet al. Collab-orative Cross Consortium, 2012 The genome architecture of the collab-orative cross mouse genetic reference population. Genetics 190(2): 389–401. Jang, I. K., J. Zhang, and H. Gu, 2009 Grb2, a simple adapter with complex roles in lymphocyte development, function, and signaling. Immunol. Rev. 232(1): 150–159.
Kajaste-Rudnitski, A., T. Mashimo, M. P. Frenkiel, J. L. Guénet, M. Lucas
et al., 2006 The 29,59-oligoadenylate synthetase 1b is a potent inhibitor of West Nile virus replication inside infected cells. J. Biol. Chem. 281(8): 4624–4637.
Keane, T. M., L. Goodstadt, P. Danecek, M. A. White, K. Wonget al., 2011 Mouse genomic variation and its effect on phenotypes and gene regulation. Nature 477(7364): 289–294.
Krämer, A., J. Green, J. Pollard, and S. Tugendreich, 2014 Causal analysis approaches in ingenuity pathway analysis. Bioinformatics 4: 1–8. Kristiansen, H., H. H. Gad, S. Eskildsen-Larsen, P. Despres, and R. Hartmann,
2011 The oligoadenylate synthetase family: an ancient protein family with multiple antiviral activities. J. Interferon Cytokine Res. 1: 41–47. Lazear, H. M., and M. S. Diamond, 2015 New insights into innate immune
restriction of West Nile virus infection. Curr. Opin. Virol. 11: 1–6. Lazear, H. M., A. Lancaster, C. Wilkins, M. S. Suthar, A. Huanget al.,
2013 IRF-3, IRF-5, and IRF-7 coordinately regulate the type I IFN re-sponse in myeloid dendritic cells downstream of MAVS signaling. PLoS Pathog. 1: e1003118.
Lee, M. S., B. Kim, G. T. Oh, and Y. J. Kim, 2013 OASL1 inhibits translation of the type I interferon-regulating transcription factor IRF7. Nat. Immunol. 4: 346–355.
Li, H., C. Leo, J. Zhu, X. Wu, J. O’Neilet al., 2000 Sequestration and inhibition of Daxx-mediated transcriptional repression by PML. Mol. Cell. Biol. 20: 1784–1796.
Li, Y., S. Banerjee, Y. Wang, S. A. Goldsteinet al., 2016 Activation of RNase L is dependent on OAS3 expression during infection with diverse human viruses. Proc. Natl. Acad. Sci. USA. Feb 23(8): 2241–2246.
Loo, Y. M., and M. Gale, Jr., 2008 Unveiling viral enablers. Nat. Biotechnol. 10: 1093–1094.
Loo, Y. M., and M. Gale, Jr., 2011 Immune signaling by RIG-I-like recep-tors. Immunity 34(5): 680–692.
Loraine, A. E., I. C. Blakley, S. Jagadeesan, J. Harper, G. Milleret al., 2015 Analysis and visualization of RNA-Seq expression data using RStudio, bioconductor, and integrated genome browser. Methods Mol. Biol. 1284: 481–501.
Malathi, K., B. Dong, M. Gale, Jr., and R. H. Silverman, 2007 Small self-RNA generated by RNase L amplifies antiviral innate immunity. Nature. 448: 816–819.
Mashimo, T., M. Lucas, D. Simon-Chazottes, M. P. Frenkiel, X. Montagutelli
et al., 2002 A nonsense mutation in the gene encoding 29-59 -oligoadenylate synthetase/L1 isoform is associated with West Nile virus susceptibility in laboratory mice. Proc. Natl. Acad. Sci. USA 99(17): 11311–11316.
Mashima, R., K. Saeki, D. Aki, Y. Minoda, H. Takakiet al., 2005 FLN29, a novel interferon- and LPS-inducible gene acting as a negative regulator of toll-like receptor signaling. J. Biol. Chem. 280(50): 41289–41297. Morgan, A. P., C. P. Fu, C. Y. Kao, C. E. Welshet al., 2015 The Mouse
Universal Genotyping Array: From Substrains to Subspecies. G3 (Be-thesda). 2015 12: 263–279.
Morgan, A. P., D. M. Gatti, T. M. Keane, R. J. Galante, A. I. Packet al., 2017 Structural variation shapes the landscape of recombination in mouse. Genetics 206: 603–619.
Neri, F., A. Zippo, A. Krepelova, A. Cherubini, M. Rocchigianiet al., 2012 Myc regulates the transcription of the PRC2 gene to control the expression of developmental genes in embryonic stem cells. Mol. Cell. Biol. 32(4): 840–851.
Oreper, D. G., Y. Cai, L. M. Tarantino, F. Pardo-Manuel de Villena, and W. Valdar, 2017 Inbred strain variant database (ISVDB): a repository for probabilistically informed sequence differences among the collaborative cross strains and their founders. G3 (Bethesda) 7: 1623–1630. Perelygin, A. A., S. V. Scherbik, I. B. Zhulin, B. M. Stockman, Y. Liet al.,
2002 Positional cloning of the murineflavivirus resistance gene. Proc. Natl. Acad. Sci. USA 99(14): 9322–9327.
Perlman, R., W. P. Schiemann, M. W. Brooks, H. F. Lodish, and R. A. Weinberg, 2001 TGF-beta-induced apoptosis is mediated by the adapter protein Daxx that facilitates JNK activation. Nat. Cell Biol. 3: 708–714.
Rasmussen, A. L., A. Okumura, M. T. Ferris, R. Green, F. Feldmannet al., 2014 Host genetic diversity enables Ebola hemorrhagic fever patho-genesis and resistance. Science 346(6212): 987–991.
Scherbik, S. V., J. M. Paranjape, B. M. Stockman, R. H. Silverman, and M. A. Brinton, 2006 RNase L plays a role in the antiviral response to West Nile virus. J. Virol. 80(6): 2987–2999.
Shaffer, A. L., A. Rosenwald, E. M. Hurt, J. M. Giltnane, L. T. Lamet al., 2001 Signatures of the immune response. Immunity. 15: 375–385. Shaw, T., and P. Martin, 2009 Epigenetic reprogramming during wound
healing: loss of polycomb-mediated silencing may enable upregulation of repair genes. EMBO Rep. 8: 881–886.
Shorter, J. R., F. Odet, D. L. Aylor, W. Pan, C.-Y. Kaoet al., 2017 Male infertility is responsible for nearly half of the extinction observed in the Collaborative Cross. Genetics 206: 557–572.
Siddiqui, M. A., and K. Malathi, 2012 RNase L induces autophagy via c-Jun N-terminal kinase and double-stranded RNA-dependent protein kinase signaling pathways. J. Biol. Chem. 287: 43651–43664.
Smyth, G.K., 2004 Linear models and empirical Bayes methods for assess-ing differential expression in microarray experiments. Stat. Appl. Genet. Mol. Biol. 3: Article3.
Srivastava, A., A. P. Morgan, M. Najarian, V. K. Sarsani, J. S. Sigmonet al., 2017 The genomes of the collaborative cross. Genetics 206: 537–556. Suthar, M. S., D. Y. Ma, S. Thomas, J. M. Lund, N. Zhanget al., 2010 IPS-1
is essential for the control of West Nile virus infection and immunity. PLoS Pathog. 6(2): e1000757.
Suthar, M. S., M. S. Diamond, and M. Gale, Jr., 2013 West Nile virus in-fection and immunity. Nat. Rev. Microbiol. 2: 115–128.
Yang, H., J. R. Wang, J. P. Didion, R. J. Buus, T. A. Bellet al., 2011 Subspecific origin and haplotype diversity in the laboratory mouse. Nat. Genet. 43(7): 648–655.

![Figure 11 Innate immune regulation network [Oas1b allele (N/N)]. Innate immune regulatory network identified in F1s with N/N Oas1b alleles.](https://thumb-us.123doks.com/thumbv2/123dok_us/8306740.2200038/15.904.77.833.71.681/figure-regulation-network-innate-regulatory-network-identified-alleles.webp)
